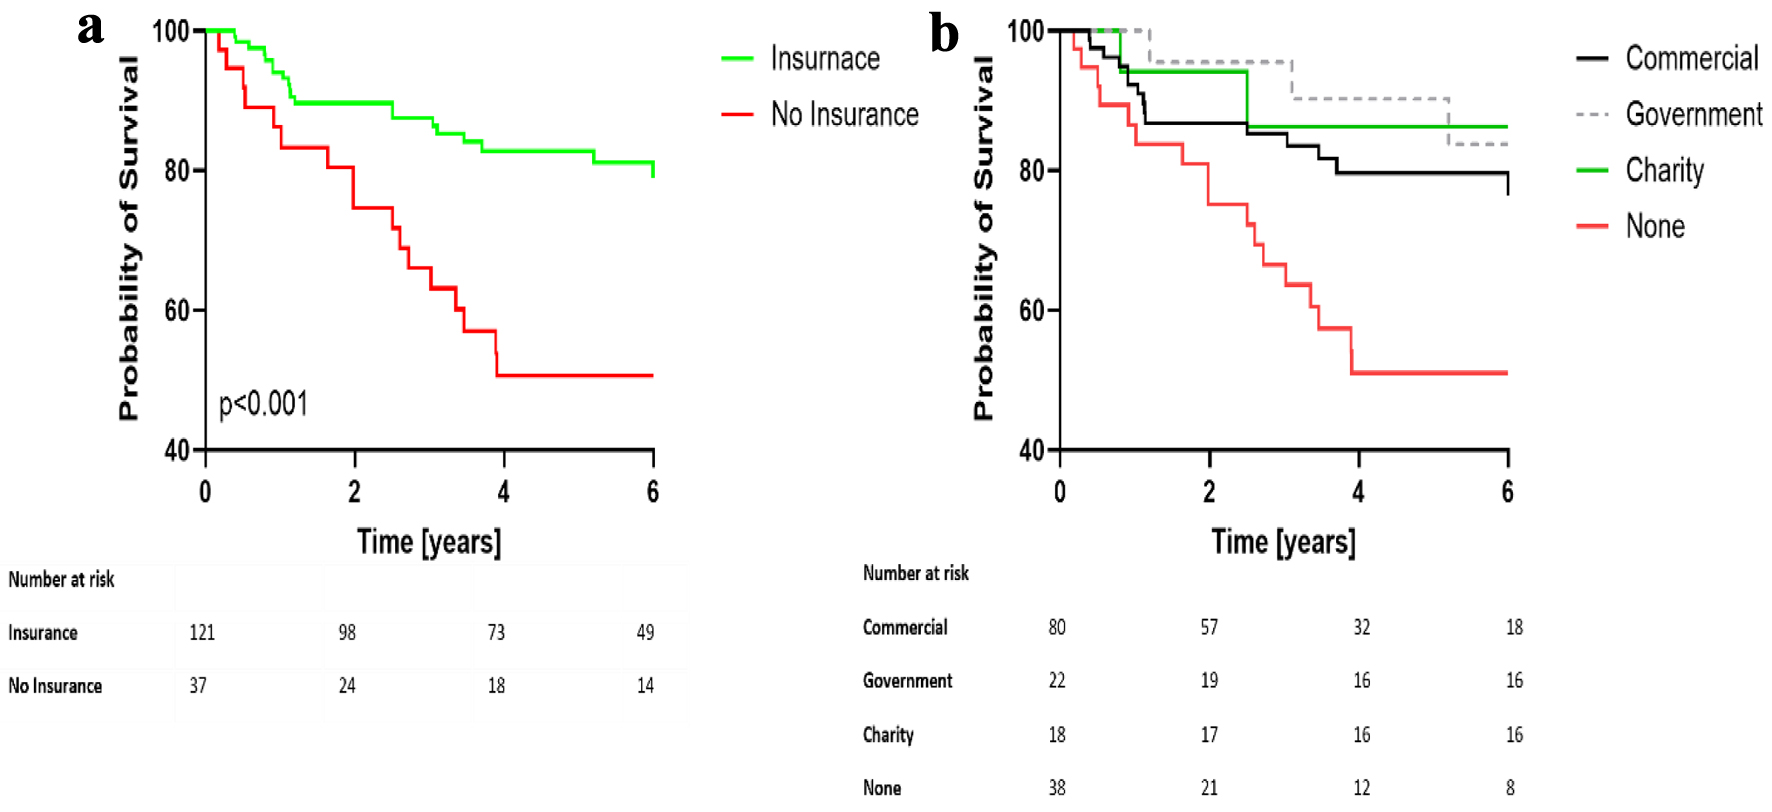
Cardiology Research, ISSN 1923-2829 print, 1923-2837 online, Open Access
Article copyright, the authors; Journal compilation copyright, Cardiol Res and Elmer Press Inc
Journal website https://cr.elmerpub.com

Original Article

Volume 16, Number 3, June 2025, pages 189-196


Complex Interactions of Social Determinants of Health on Survival Outcomes in Hispanic Patients With Pulmonary Arterial Hypertension in a US-Mexican Border City

Figures

Figure 1.
Figure 1. Kaplan-Meier analysis of overall survival according to insurance (a) and insurance type (b). (a) Survival probabilities for patients with and without insurance. (b) Survival rates based on insurance type. A P-value of less than 0.01 highlights a statistically significant difference among the groups.
Figure 2.
Figure 2. Kaplan-Meier analysis of overall survival according to employment status (a) and latent risk group (b). (a) Survival probabilities for patients based on employment status. (b) Survival probabilities based on latent risk group. A P-value of less than 0.01 indicates a statistically significant difference among the groups.

Tables

Table 1. Baseline Characteristics in the Entire Cohort and by Death Status
 
FactorAll patientsAliveDeathP-value
Data are presented as mean (SD), except for gender and language (%). P-values for continuous variables were calculated using the t-test for time to worsening and age, and the Chi-square test for gender, language, marital status, insurance, employment, and religion. *Statistically significant. CHD: congenital health disease; CO: cardiac output; CTD: connective tissue disease; IPAH: idiopathic pulmonary arterial hypertension; mPAP: mean pulmonary pressure; N: total number of participants; SD: standard deviation; 6MWD: six-minute walk distance; WHO-FC: World Health Organization Functional Classification.
N15812137
Time to worsening (years), mean (SD)3.75 (2.01)4.28 (1.86)2.01 (1.46)< 0.001*
Age, mean (SD)57.65 (15.46)57.96 (15.79)56.65 (14.55)0.66
Gender0.55
  Female112 (71.8%)84 (70.6%)28 (75.7%)
  Male44 (28.2%)35 (29.4%)9 (24.3%)
PAH etiology
IPAH51%47%49%0.251
CTD23%24%29%
CHD17%23%15%
Others9%6%7%
Language0.79
  English91 (57.6%)69 (57.0%)22 (59.5%)
  Spanish67 (42.4%)52 (43.0%)15 (40.5%)
Marital status0.083
  Married53 (33.5%)45 (37.2%)8 (21.6%)
  Separated16 (10.1%)9 (7.4%)7 (18.9%)
  Divorced11 (7%)7 (5.8%)4 (10.8%)
  Widowed17 (10.8%)15 (12.4%)2 (5.4%)
  Life partner2 (1.3%)1 (0.8%)1 (2.7%)
Insurance< 0.001*
  Insured121 (76.6%)101 (83.5%)20 (54.1%)
  No insurance37 (23.4%)20 (16.5%)17 (45.9%)
Employment0.83
  Employed70 (44.3%)52 (43.0%)18 (48.6%)
  No employment52 (32.9%)41 (33.9%)11 (29.7%)
  Retired36 (22.8%)28 (23.1%)8 (21.6%)
Religion0.33
  Religious132 (83.5%)103 (85.1%)29 (78.4%)
  Not religious26 (16.5%)18 (14.9%)8 (21.6%)
6MWD, mean (SD)362.20 (107.32)385.86 (97.32)284.81 (103.06)< 0.001
WHO-FC< 0.001
  19 (5.7%)8 (6.6%)1 (2.7%)
  227 (17.1%)27 (22.3%)0 (0.0%)
  3101 (63.9%)79 (65.3%)22 (59.5%)
  421 (13.3%)7 (5.8%)14 (37.8%)
mPAP, mean (SD)43.25 (12.74)41.97 (12.56)47.45 (12.61)0.021
CO, mean (SD)3.85 (1.73)4.06 (1.67)3.18 (1.76)0.007


Table 2. Unadjusted Association of Each Factor With Overall Survival
 
CovariatesHR95% CIP-value
Unadjusted and adjusted association factors are presented as HR with 95% CI and P-value. P-values were derived from Cox proportional hazards regression. *Statistically significant. Age: participant age; Gender: male versus female; Language: Spanish versus English; Marital status: living alone versus in a relationship; Insurance: no insurance versus insured; Employment: no employment versus employed; Religious affiliation: religious versus non-religious; WHO-FC: > 2 vs. ≤ 2; mPAP, CO, and 6MWD. CI: confidence interval; CO: cardiac output; HR: hazard ratio; mPAP: mean pulmonary pressure; 6MWD: six-minute walk distance; WHO-FC: World Health Organization Functional Classification.
Age0.9940.974 - 1.0140.568
Gender - male0.8330.393 - 1.7660.634
Language - Spanish0.9260.480 - 1.7850.818
Marital - living alone1.7360.819 - 3.6790.15
Insurance - no insurance2.9221.530 - 5.5790.001*
Employment - no1.2320.647 - 2.3490.525
Religion - not religious1.5910.727 - 3.4820.245
WHO-FC > 2 vs. ≤ 212.3511.693 - 90.1160.013
6MWD0.9920.989 - 0.995< 0.001*
mPAP1.0281.004 - 1.0530.02
CO0.7060.551 - 0.9040.006


Table 3. Adjusted Association of Each Factor With Overall Survival
 
Adjusted model 1Adjusted model 2
HR95% CIP-valueHR95% CIP-value
Adjusted model 1 was based on the entire follow-up data whereas adjusted model 2 was based on follow-up data limited to 5 years. Data are presented as HR with 95% CI and P-value. P-values were derived from Cox proportional hazards regression. *Statistically significant. Age: participant age; Gender: male versus female; Language: Spanish versus English; Marital status: living alone versus in a relationship; Insurance: no insurance versus insured; Employment: no employment versus employed; Religion: not religious versus religious; WHO-FC: > 2 vs. ≤ 2; mPAP, CO, and 6MWD. CI: confidence interval; CO: cardiac output; HR: hazard ratio; mPAP: mean pulmonary pressure; 6MWD: six-minute walk distance; WHO-FC: World Health Organization Functional Classification.
Employment - no1.830.93 - 3.600.0782.991.42 - 6.300.004
CO0.730.58 - 0.920.007
mPAP1.031.00 - 1.060.0221.021.00 - 1.050.102
WHO-FC ≥ 310.261.40 - 74.940.02211.271.47 - 86.660.02
6MWD0.990.99 - 0.99< 0.0010.990.99 - 1.00< 0.001*
Insurance - no2.171.05 - 4.490.037