Figures
↓ Figure 1. Trends in age-adjusted mortality rate (AAMR) related to HF, sepsis, and both in the USA (1999 - 2019). HF: 1999 to 2012 APC: -2.27*, 2012 to 2019 APC: 1.99*. Sepsis 1999 to 2012 APC: -0.48*, 2012 to 2017 APC: 1.66*, 2017 to 2019 APC: -3.69*. *Statistically significant results. HF: heart failure; APC: annual percentage change.

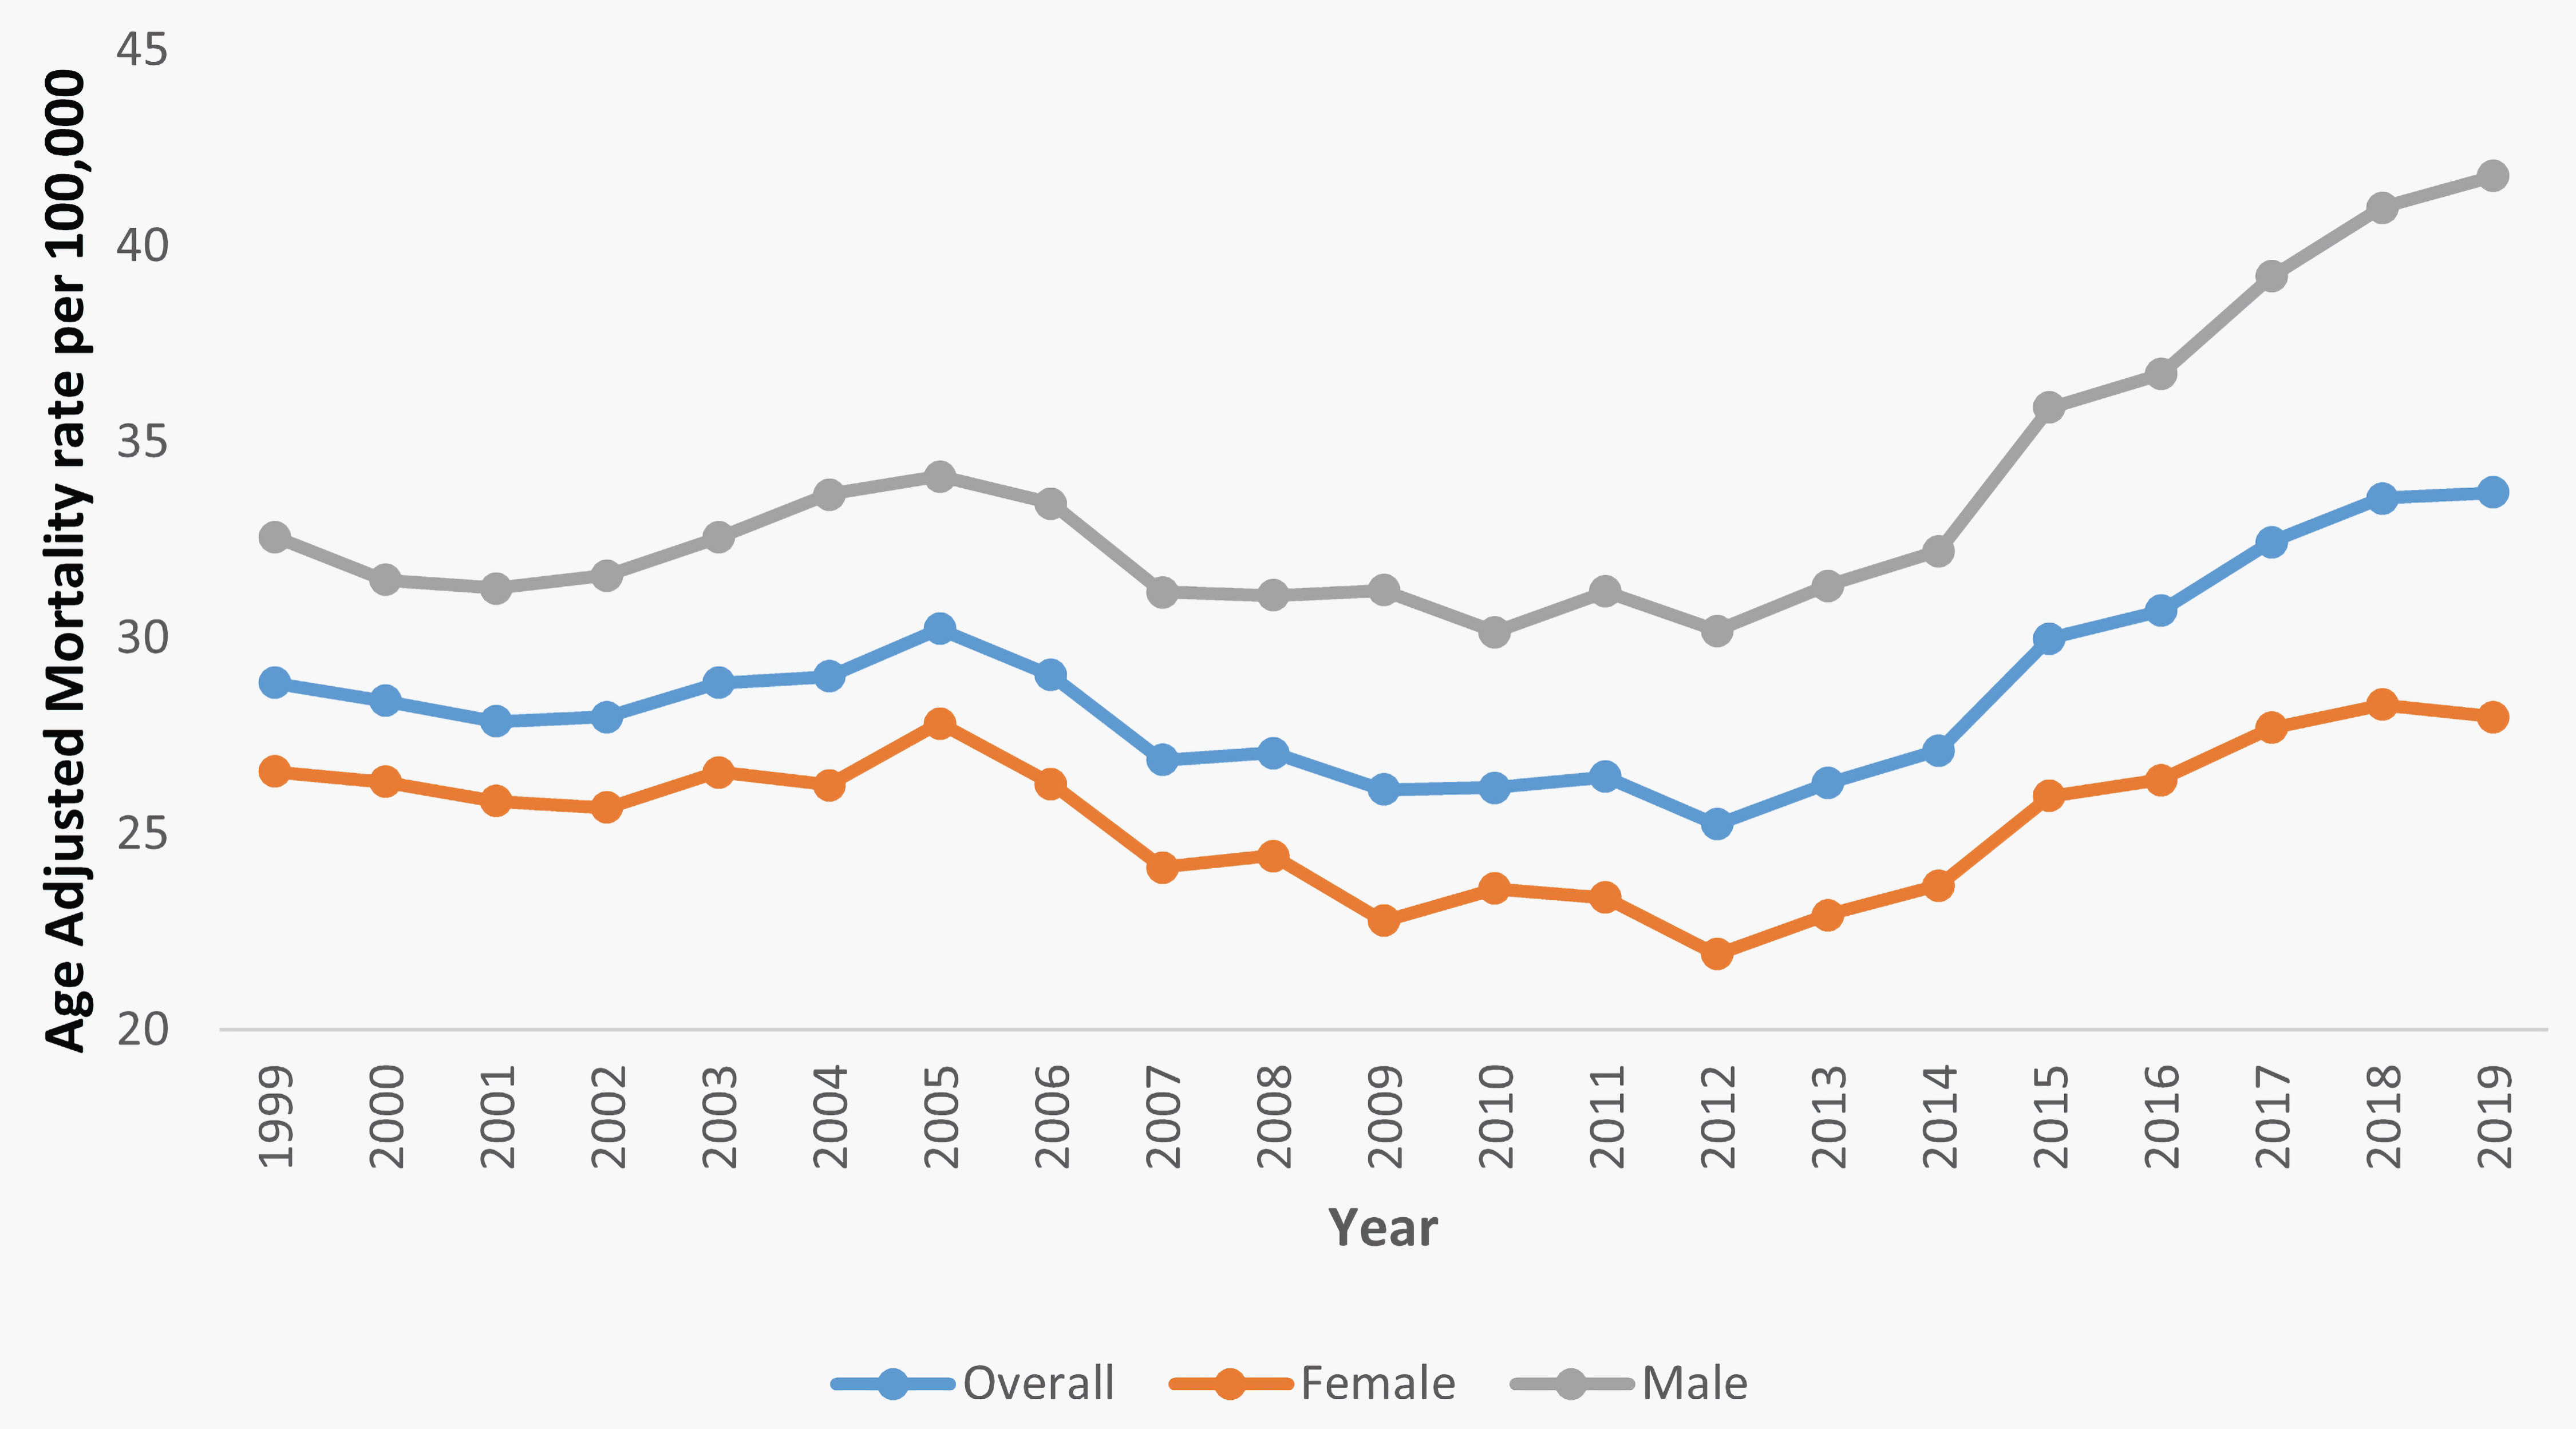
↓ Figure 2. Trends in HF and sepsis-related age-adjusted mortality rates (AAMR) stratified by gender in the USA (1999 - 2019). Overall, 1999 to 2005 APC: 0.53, 2005 to 2012 APC: -1.96, 2012 to 2019 APC: 4.65*. Female 1999 to 2005 APC: 0.24, 2005 to 2012 APC: -2.47. Male 1999 to 2005 APC: 0.90, 2005 to 2012 APC: -1.48, 2012 to 2019 APC: 5.20*. *Statistically significant results. HF: heart failure; APC: annual percentage change.
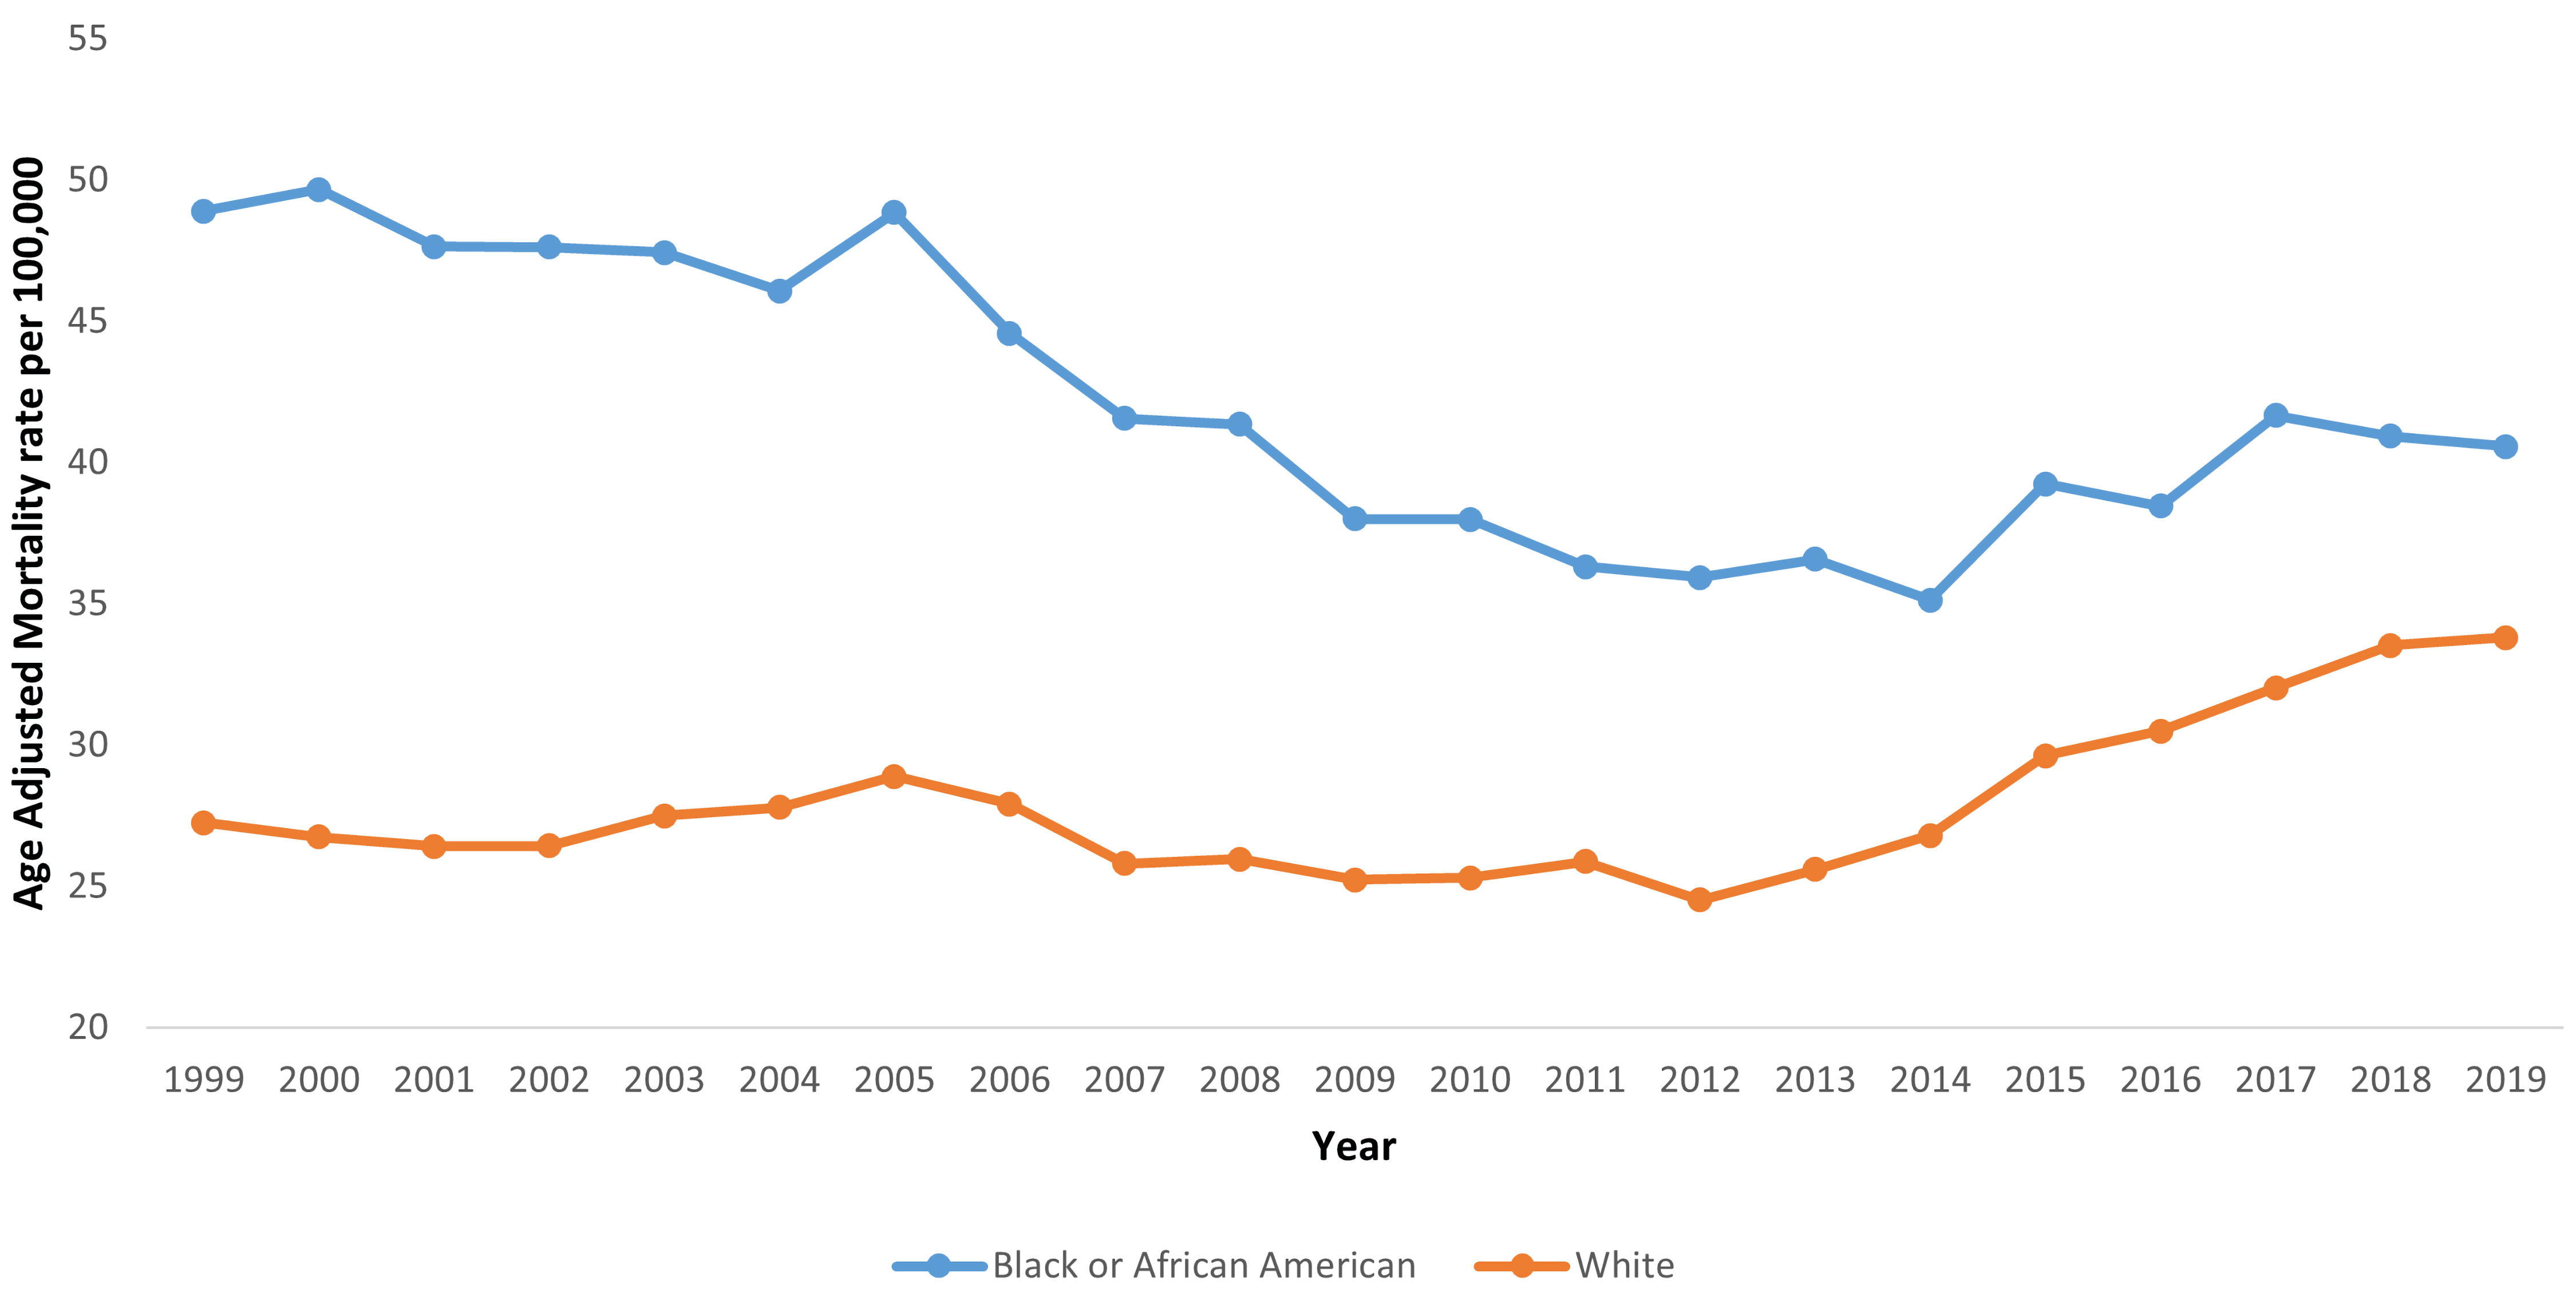
↓ Figure 3. Trends in HF and sepsis-related age-adjusted mortality rates (AAMR) stratified by race in the USA (1999 - 2019). Black or African American 1999 to 2005 APC: -0.72, 2005 to 2011 APC: -4.58*, 2011 to 2019 APC: 1.98*. White 1999 to 2005 APC: 0.75, 2005 to 2012 APC: -1.68, 2012 to 2019 APC: 5.07*. *Statistically significant results. HF: heart failure; APC: annual percentage change.
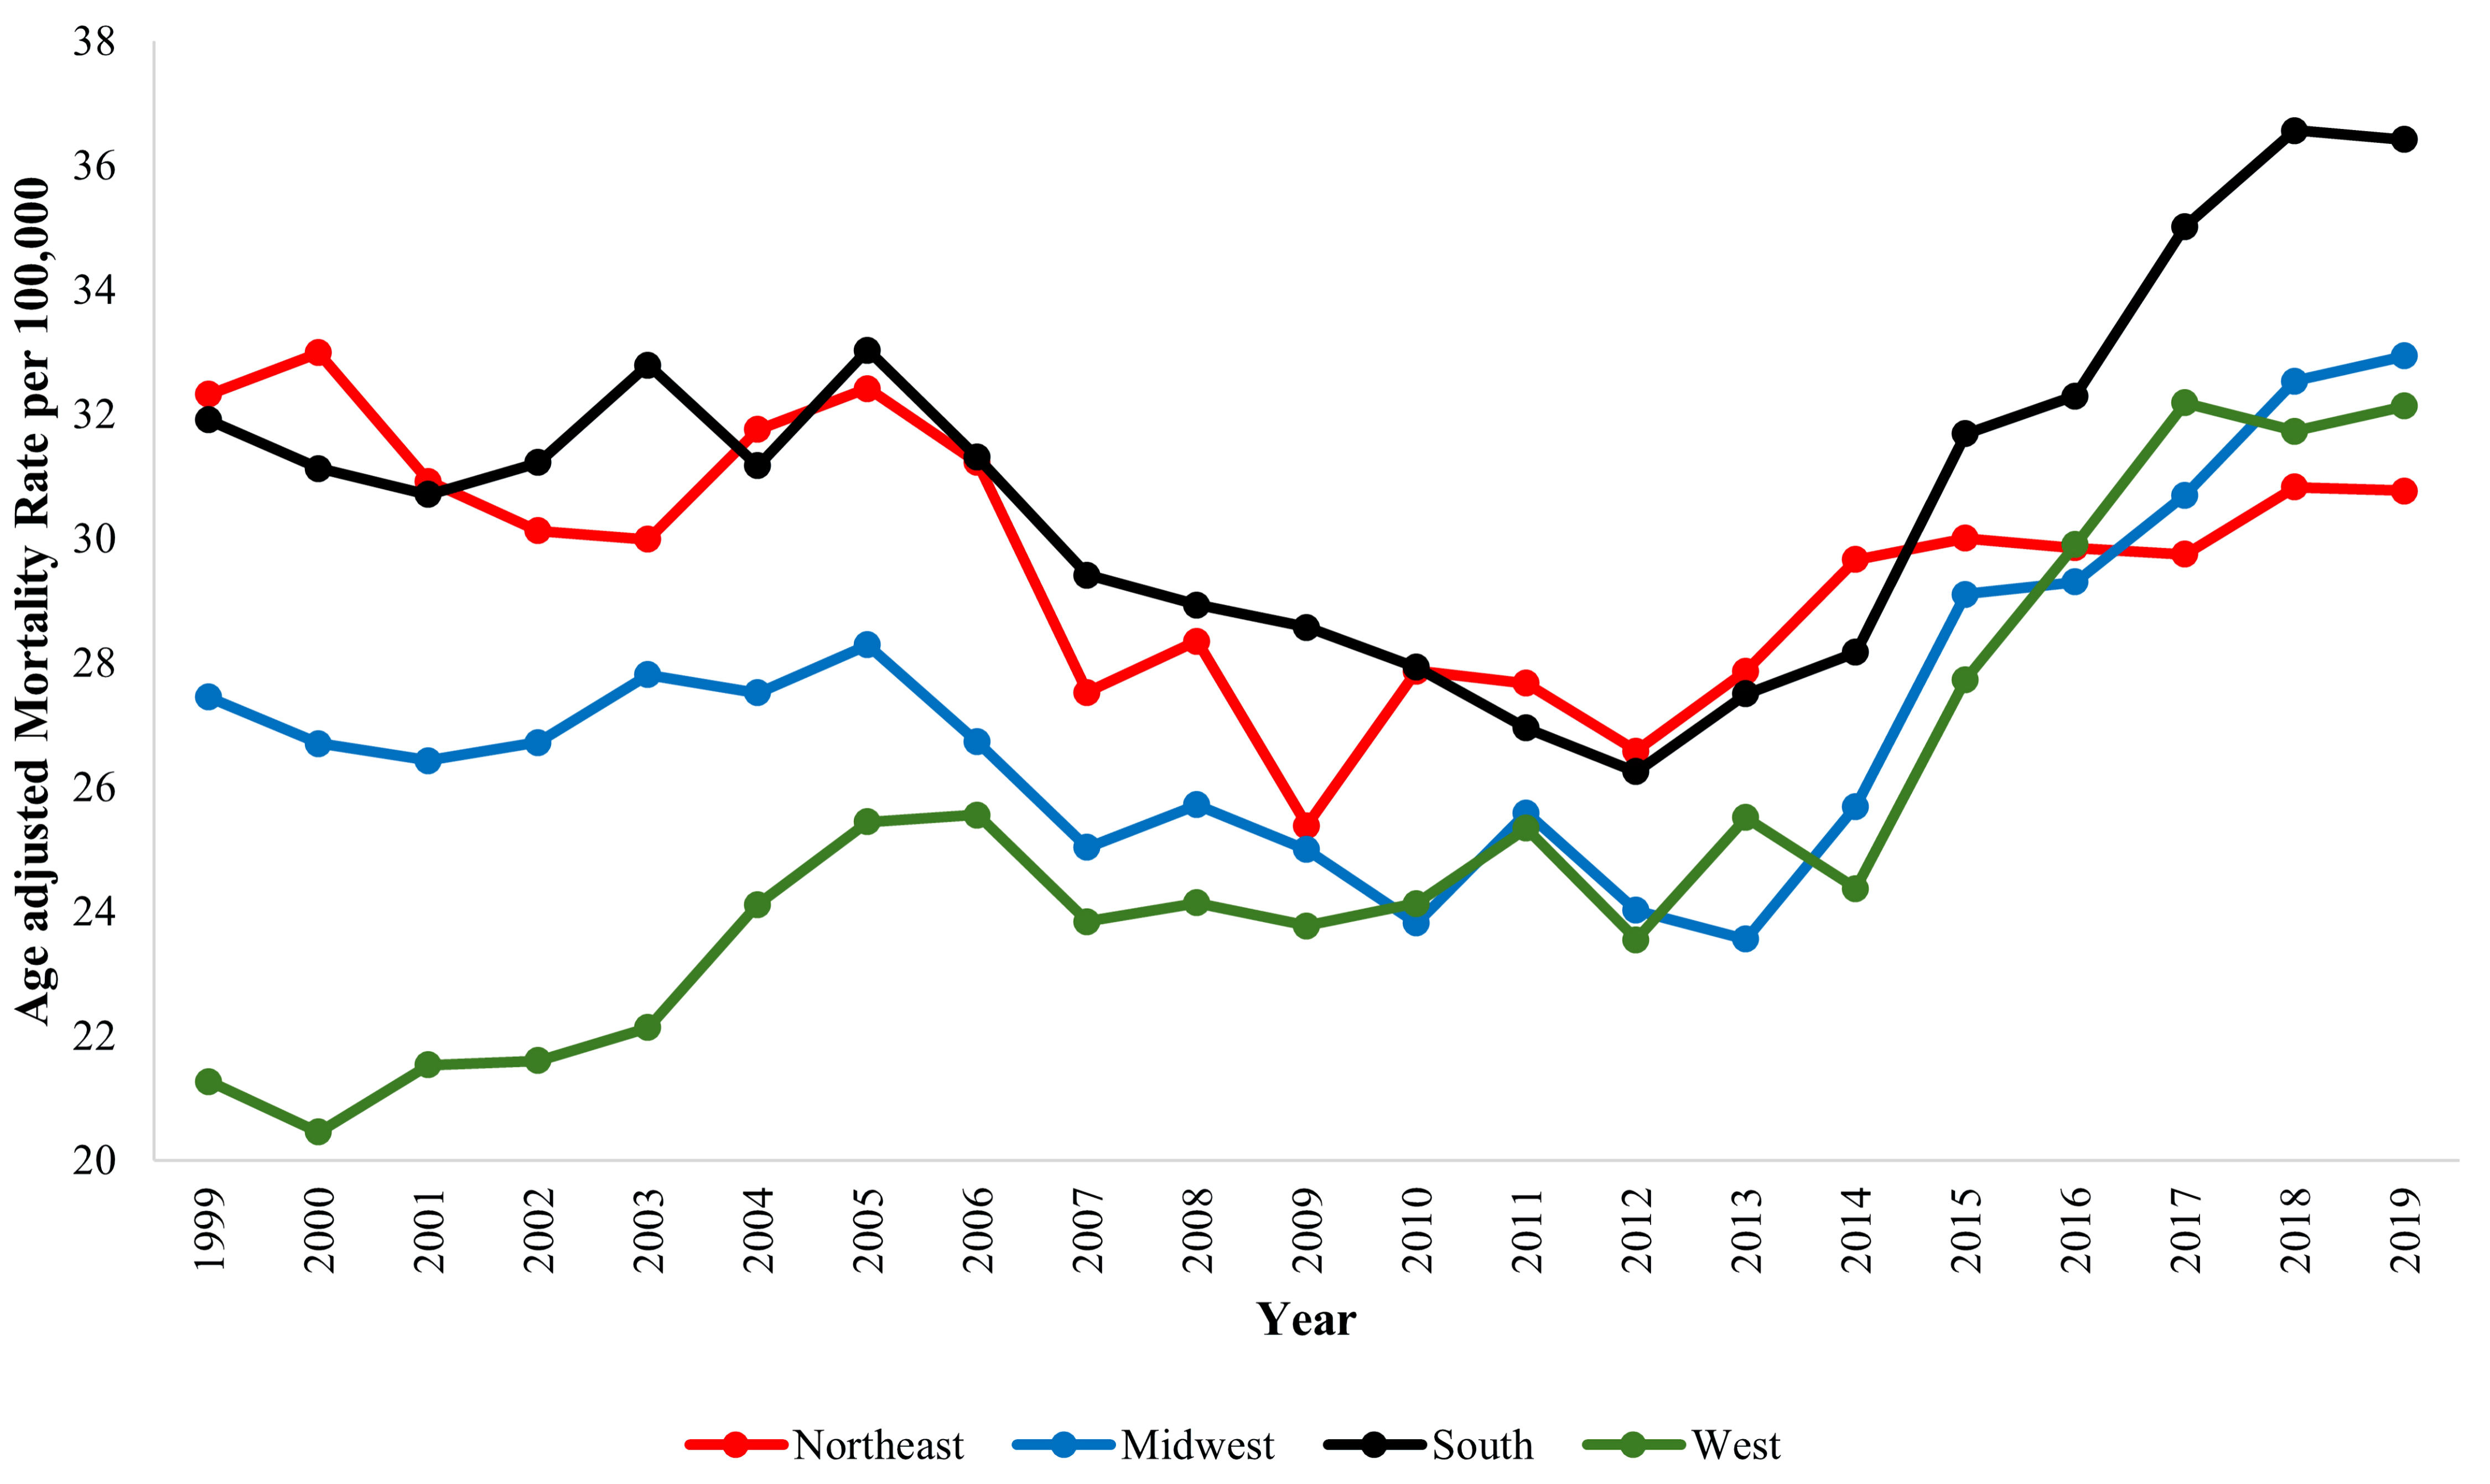
↓ Figure 4. Trends in HF and sepsis-related age-adjusted mortality rates (AAMR) stratified by region in the USA (1999 - 2019). Northeast 1999 to 2006 APC: -0.54, 2006 to 2009 APC: -5.03, 2009 to 2019 APC: 1.72. Midwest 1999 to 2013 APC: -0.89*, 2013 to 2019 APC: 5.61*. South 1999 to 2005 APC: 0.42, 2005 to 2012 APC: -2.81*, 2012 to 2019 APC: 5.37*. West 1999 to 2005 APC: 3.16*, 2005 to 2014 APC: 0.11, 2014 to 2017 APC: 9.45, 2017 to 2019 APC: -0.72. *Statistically significant results. HF: heart failure; APC: annual percentage change.
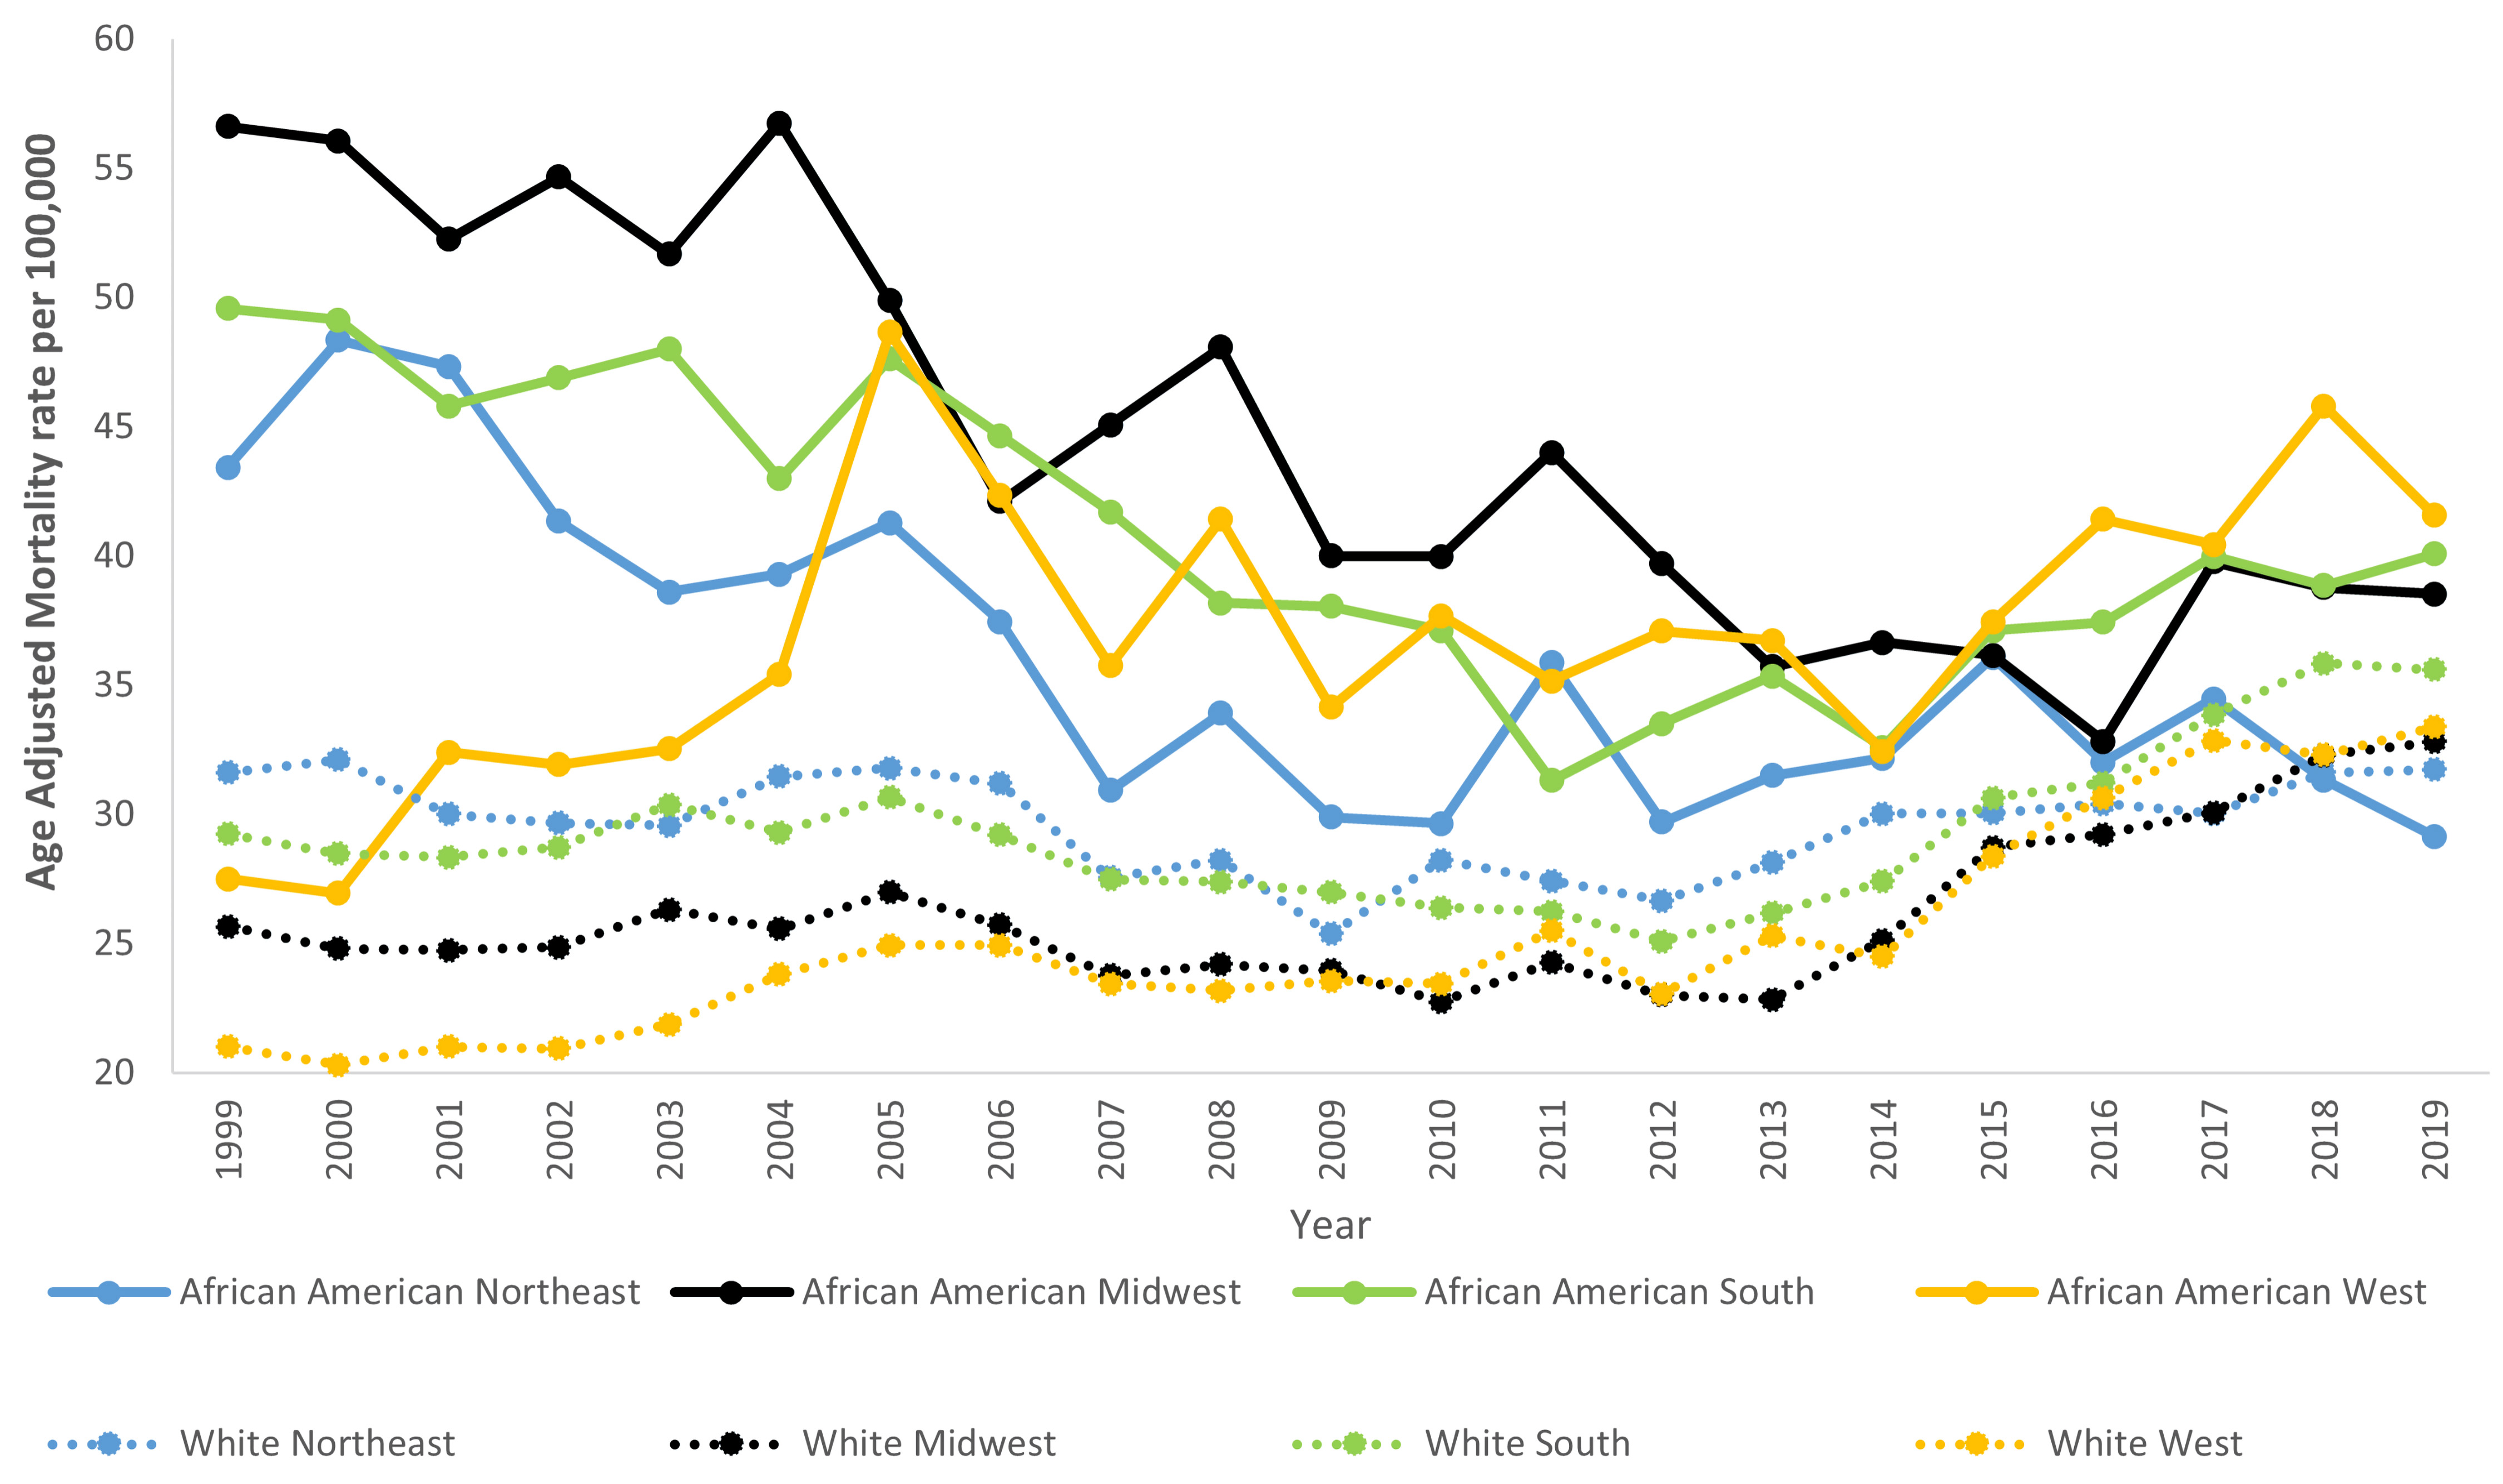
↓ Figure 5. Trends in HF and sepsis-related age-adjusted mortality rates (AAMR) stratified by region and race in the USA (1999 - 2019). African American Northeast 1999 to 2009 APC: -3.94*, 2009 to 2019 APC: 0.05; African American Midwest 1999 to 2016 APC: -2.97*, 2016 to 2019 APC: 4.61; African American South 1999 to 2006 APC: -0.79, 2006 to 2011 APC: -6.02*, 2011 to 2019 APC: 3.18*; African American West 1999 to 2005 APC: 9.26*, 2005 to 2011 APC: -3.96*, 2011 to 2019 APC: 3.08*. White Northeast 1999 to 2006 APC: -0.22, 2006 to 2009 APC: -4.93, 2009 to 2019 APC: 1.98; White Midwest 1999 to 2012 APC: -0.85*, 2012 to 2019 APC: 5.30*; White South 1999 to 2005 APC: 0.70, 2005 to 2012 APC: -2.40*, 2012 to 2019 APC: 5.64*; White West 1999 to 2013 APC: 1.22, 2013 to 2019 APC: 5.47*. *Statistically significant results. HF: heart failure; APC: annual percentage change.
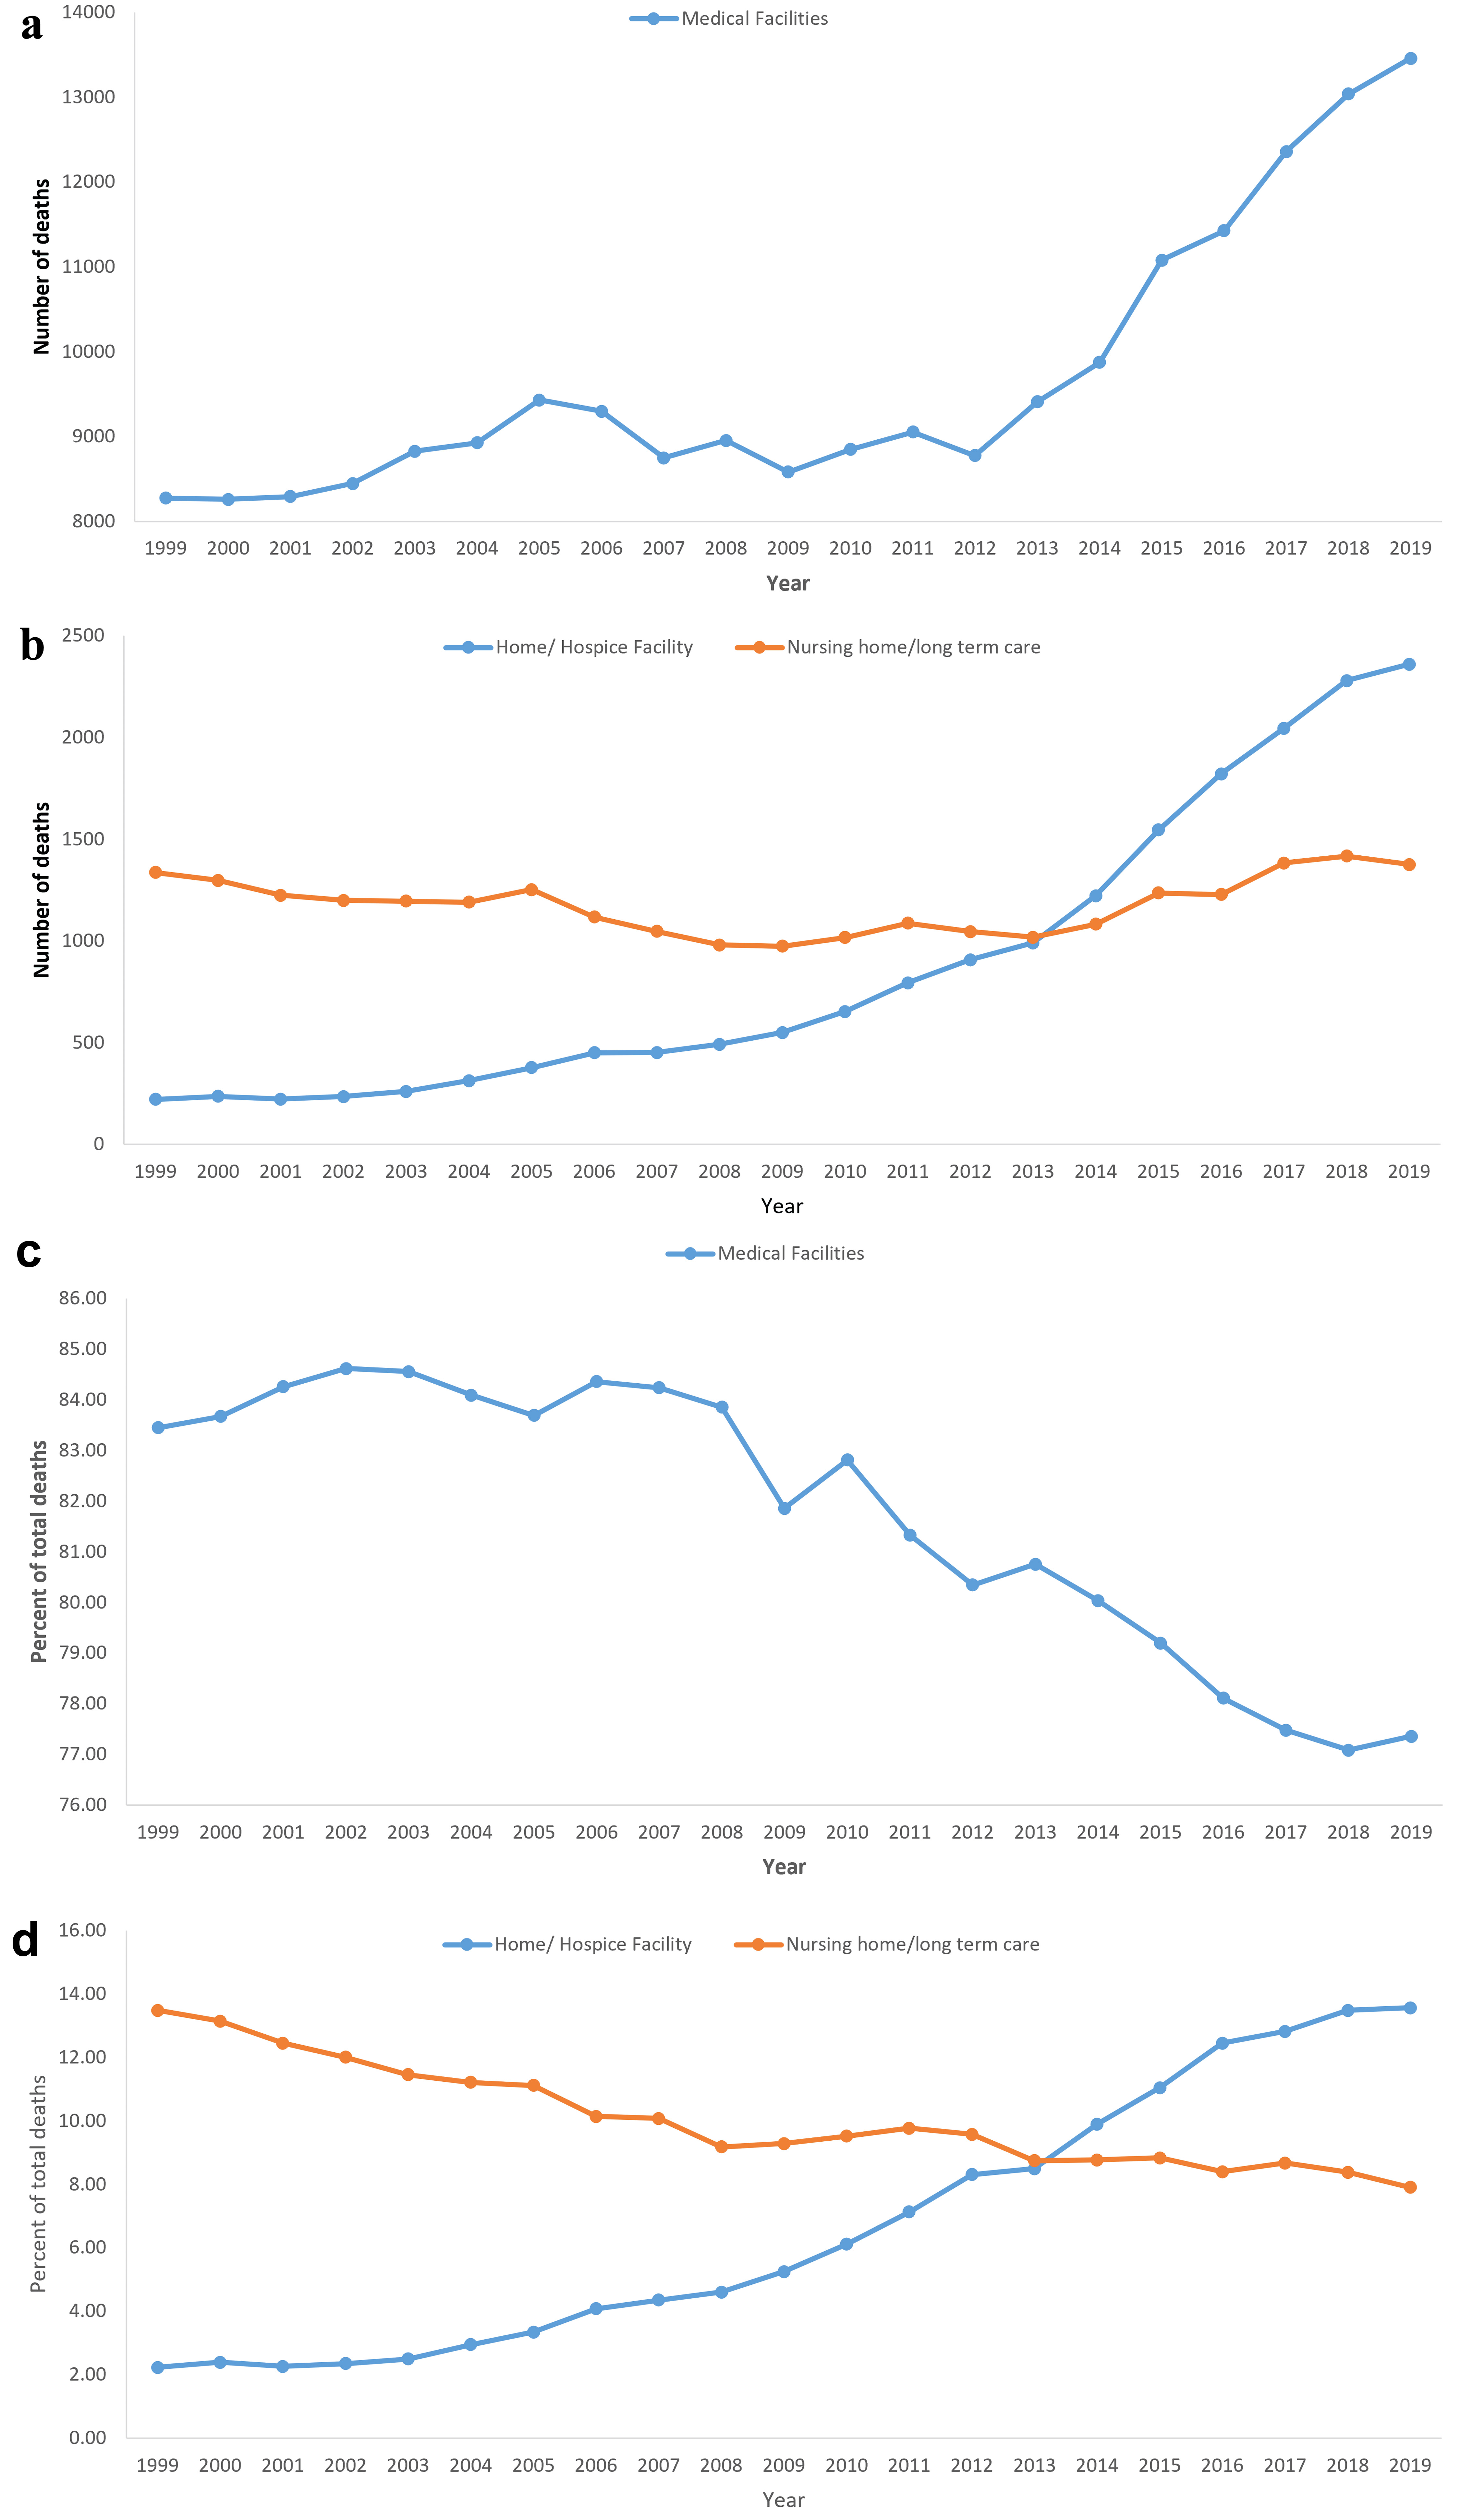
↓ Figure 6. (a, b) Trends in overall number of HF and sepsis-related deaths stratified by place of death in the USA (1999 - 2019). (c, d) Trends in the percentage of HF and sepsis-related deaths stratified by place of death in the USA (1999 - 2019).
Table
↓ Table 1. Annual HF + Sepsis Deaths, Stratified by Gender and Race, Along With HF and Sepsis Deaths From 1999 to 2019
| Year | Heart failure | Sepsis | HF + sepsis | Female | Male | Black or African American | White |
|---|
| HF: heart failure. |
| 1999 | 271,853 | 105,431 | 9,916 | 5,833 | 4,083 | 1,322 | 8,426 |
| 2000 | 271,991 | 104,569 | 9,873 | 5,837 | 4,036 | 1,355 | 8,357 |
| 2001 | 269,209 | 105,878 | 9,841 | 5,783 | 4,058 | 1,316 | 8,341 |
| 2002 | 267,254 | 108,124 | 9,984 | 5,800 | 4,184 | 1,322 | 8,446 |
| 2003 | 269,110 | 108,776 | 10,439 | 6,035 | 4,404 | 1,335 | 8,895 |
| 2004 | 263,769 | 108,608 | 10,617 | 5,994 | 4,623 | 1,321 | 9,072 |
| 2005 | 270,942 | 113,935 | 11,270 | 6,462 | 4,808 | 1,433 | 9,581 |
| 2006 | 261,285 | 113,021 | 11,022 | 6,203 | 4,819 | 1,332 | 9,420 |
| 2007 | 256,157 | 112,891 | 10,387 | 5,769 | 4,618 | 1,276 | 8,849 |
| 2008 | 260,129 | 117,722 | 10,677 | 5,954 | 4,723 | 1,301 | 9,075 |
| 2009 | 253,082 | 115,315 | 10,484 | 5,606 | 4,878 | 1,240 | 8,943 |
| 2010 | 257,683 | 117,781 | 10,683 | 5,895 | 4,788 | 1,259 | 9,115 |
| 2011 | 262,103 | 121,114 | 11,132 | 6,000 | 5,132 | 1,247 | 9,577 |
| 2012 | 263,246 | 121,775 | 10,923 | 5,770 | 5,153 | 1,292 | 9,293 |
| 2013 | 275,742 | 128,249 | 11,651 | 6,107 | 5,544 | 1,376 | 9,899 |
| 2014 | 283,643 | 134,159 | 12,338 | 6,444 | 5,894 | 1,377 | 10,601 |
| 2015 | 303,747 | 145,091 | 13,990 | 7,210 | 6,780 | 1,594 | 11,969 |
| 2016 | 308,910 | 146,345 | 14,629 | 7,481 | 7,148 | 1,637 | 12,546 |
| 2017 | 325,722 | 151,983 | 15,952 | 8,047 | 7,905 | 1,843 | 13,542 |
| 2018 | 339,962 | 153,782 | 16,912 | 8,412 | 8,500 | 1,884 | 14,452 |
| 2019 | 352,260 | 149,974 | 17,395 | 8,432 | 8,963 | 1,962 | 14,873 |
| Total | 5,887,799 | 2,584,523 | 250,115 | 135,074 | 115,041 | 30,024 | 213,272 |