Figures
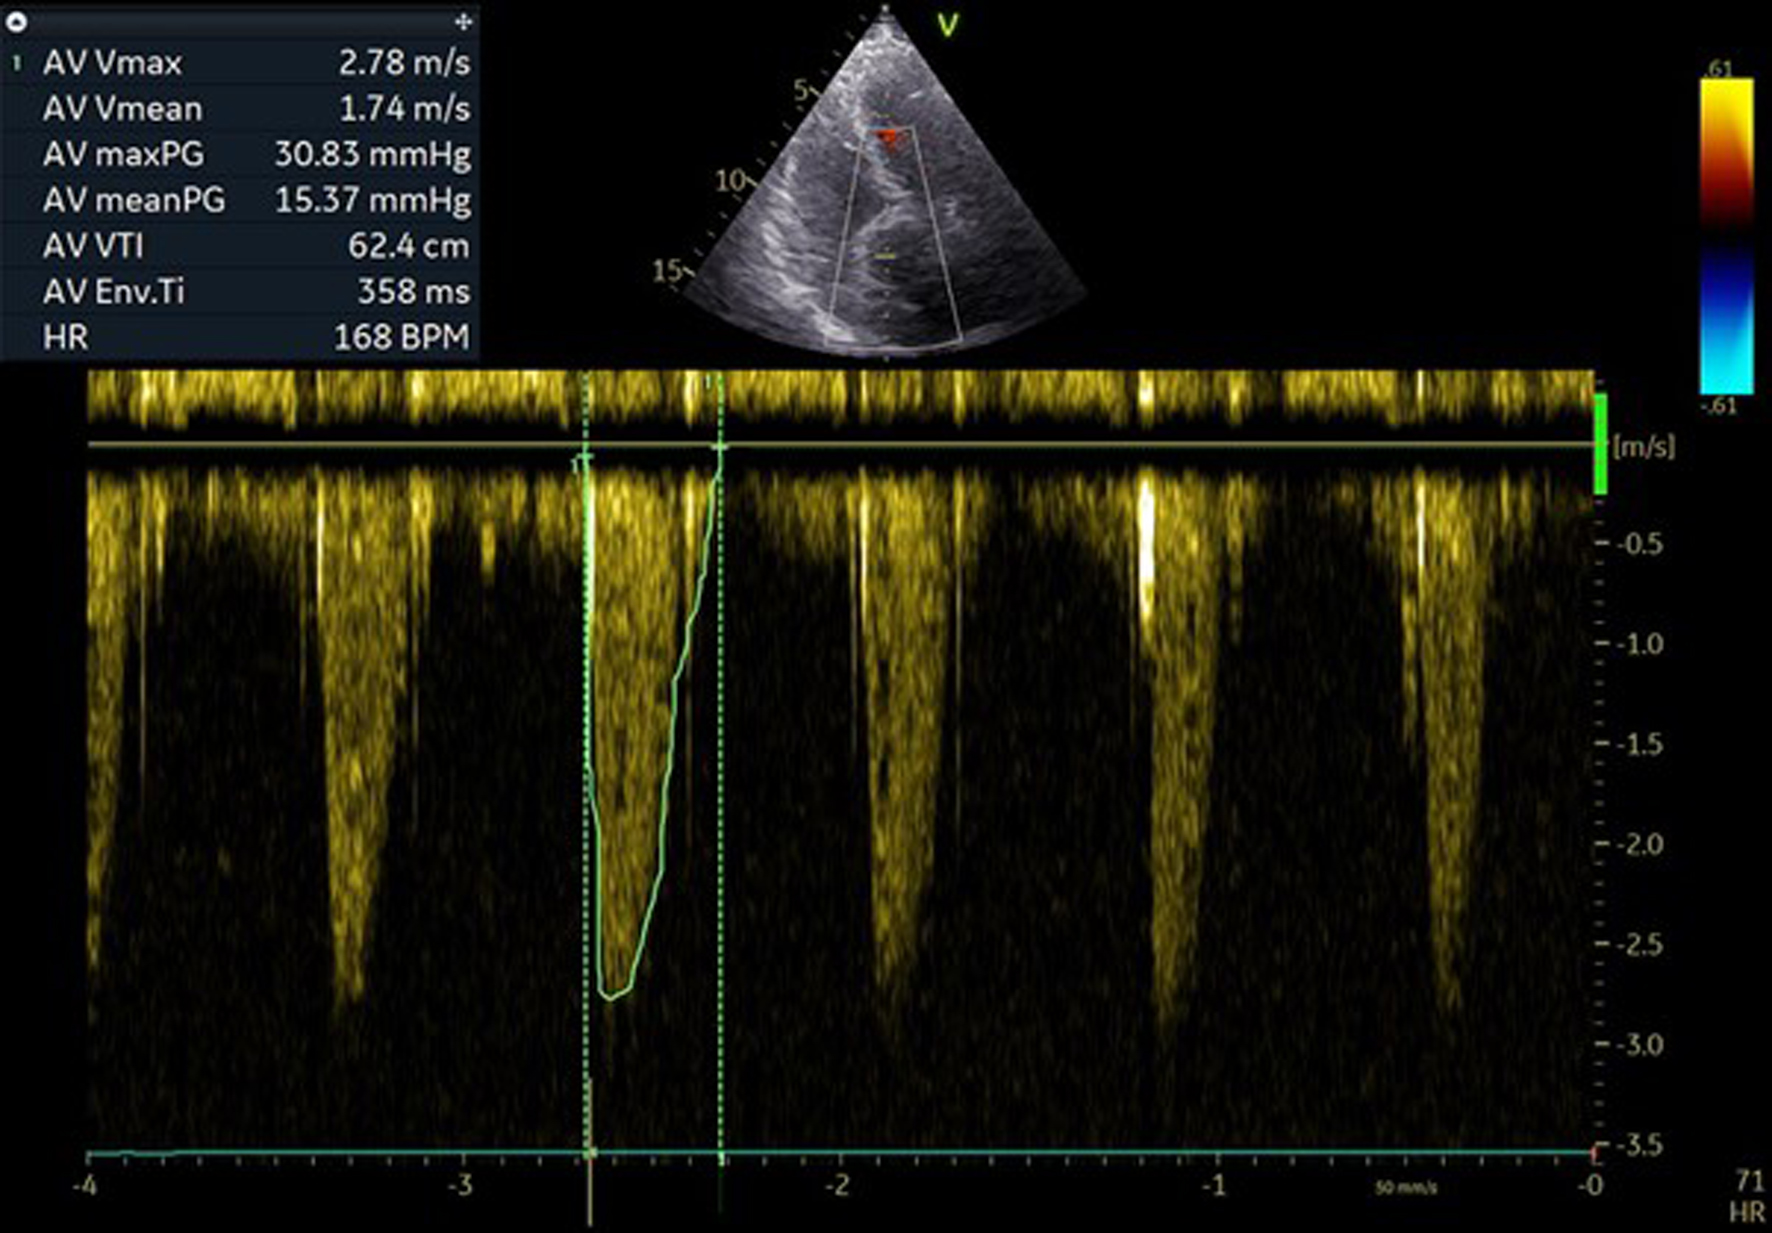
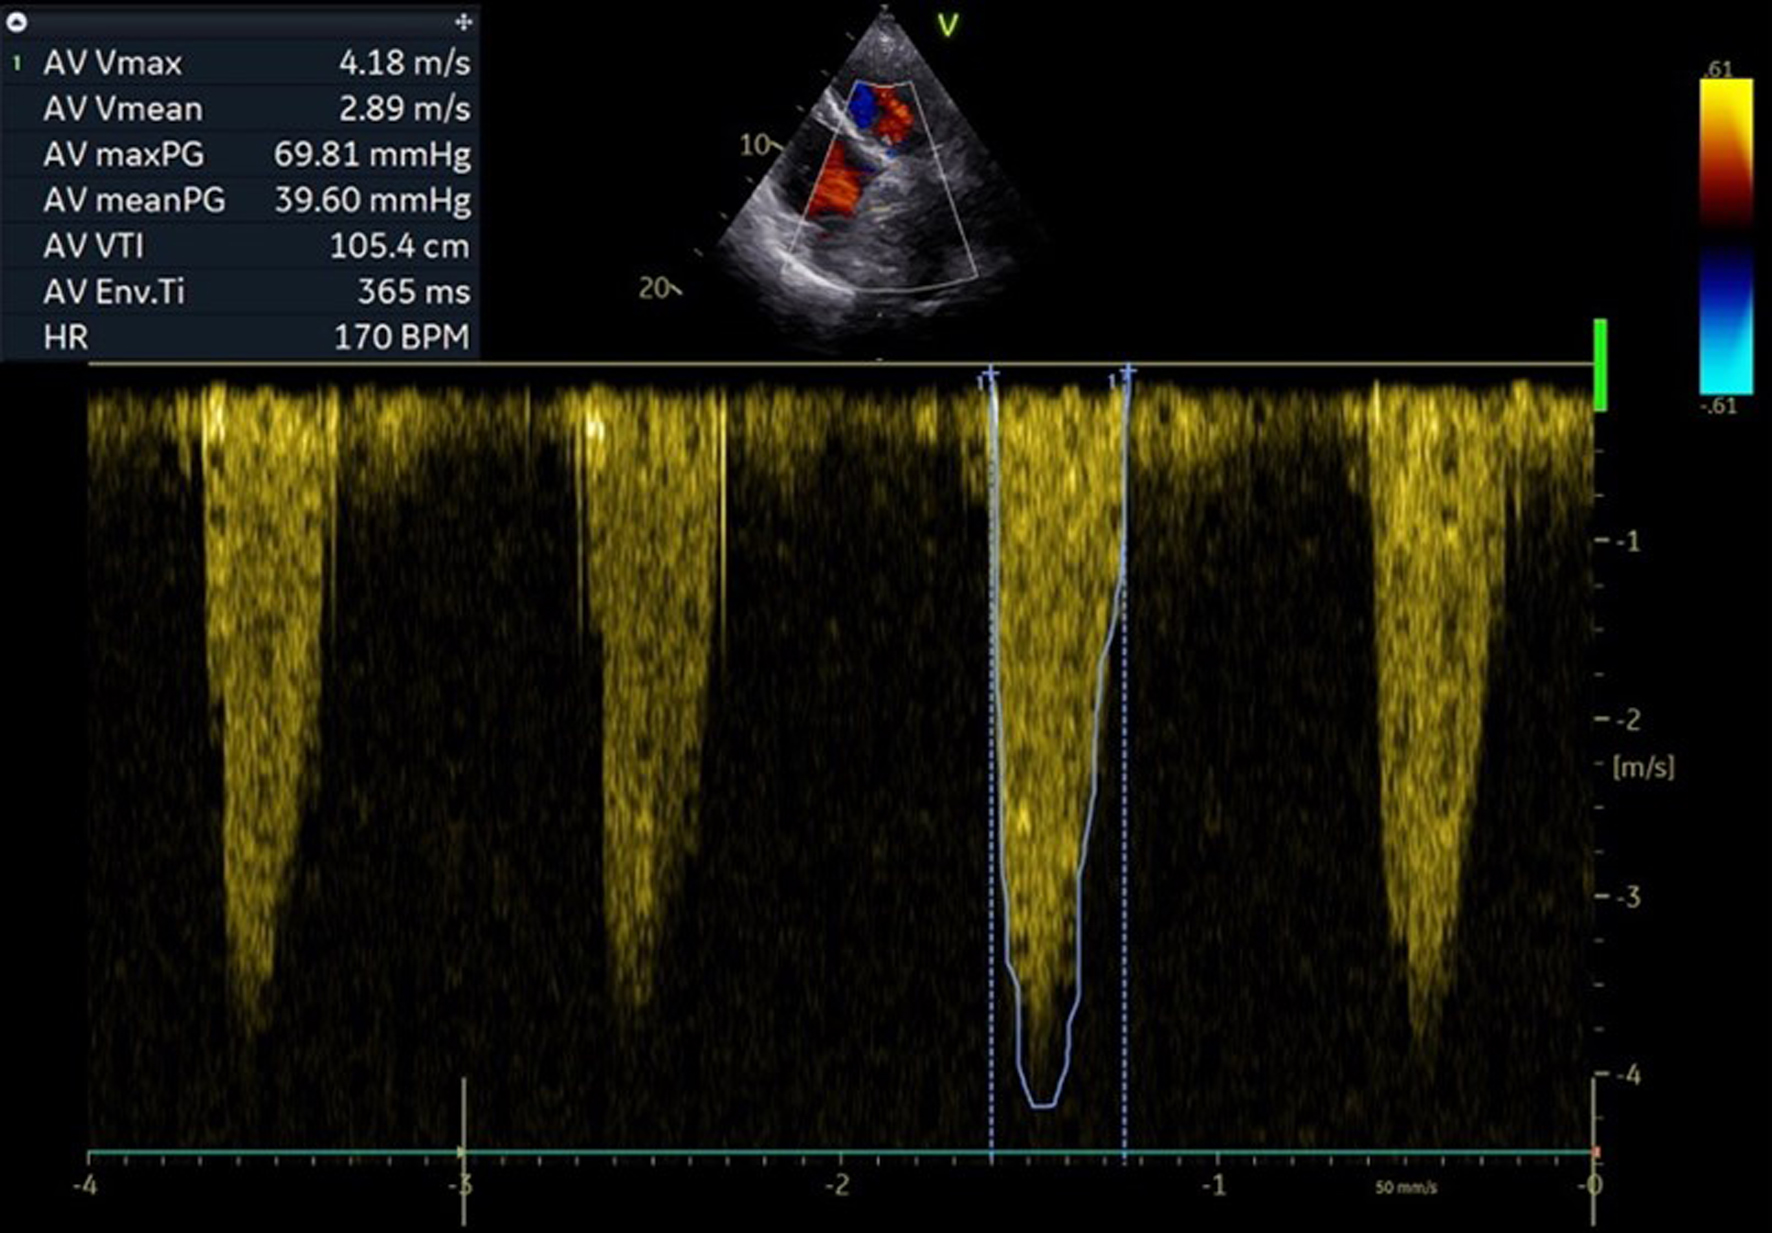
↓ Figure 1. Pre-procedural echocardiographic pressure gradients over surgical aortic bioprostheses.
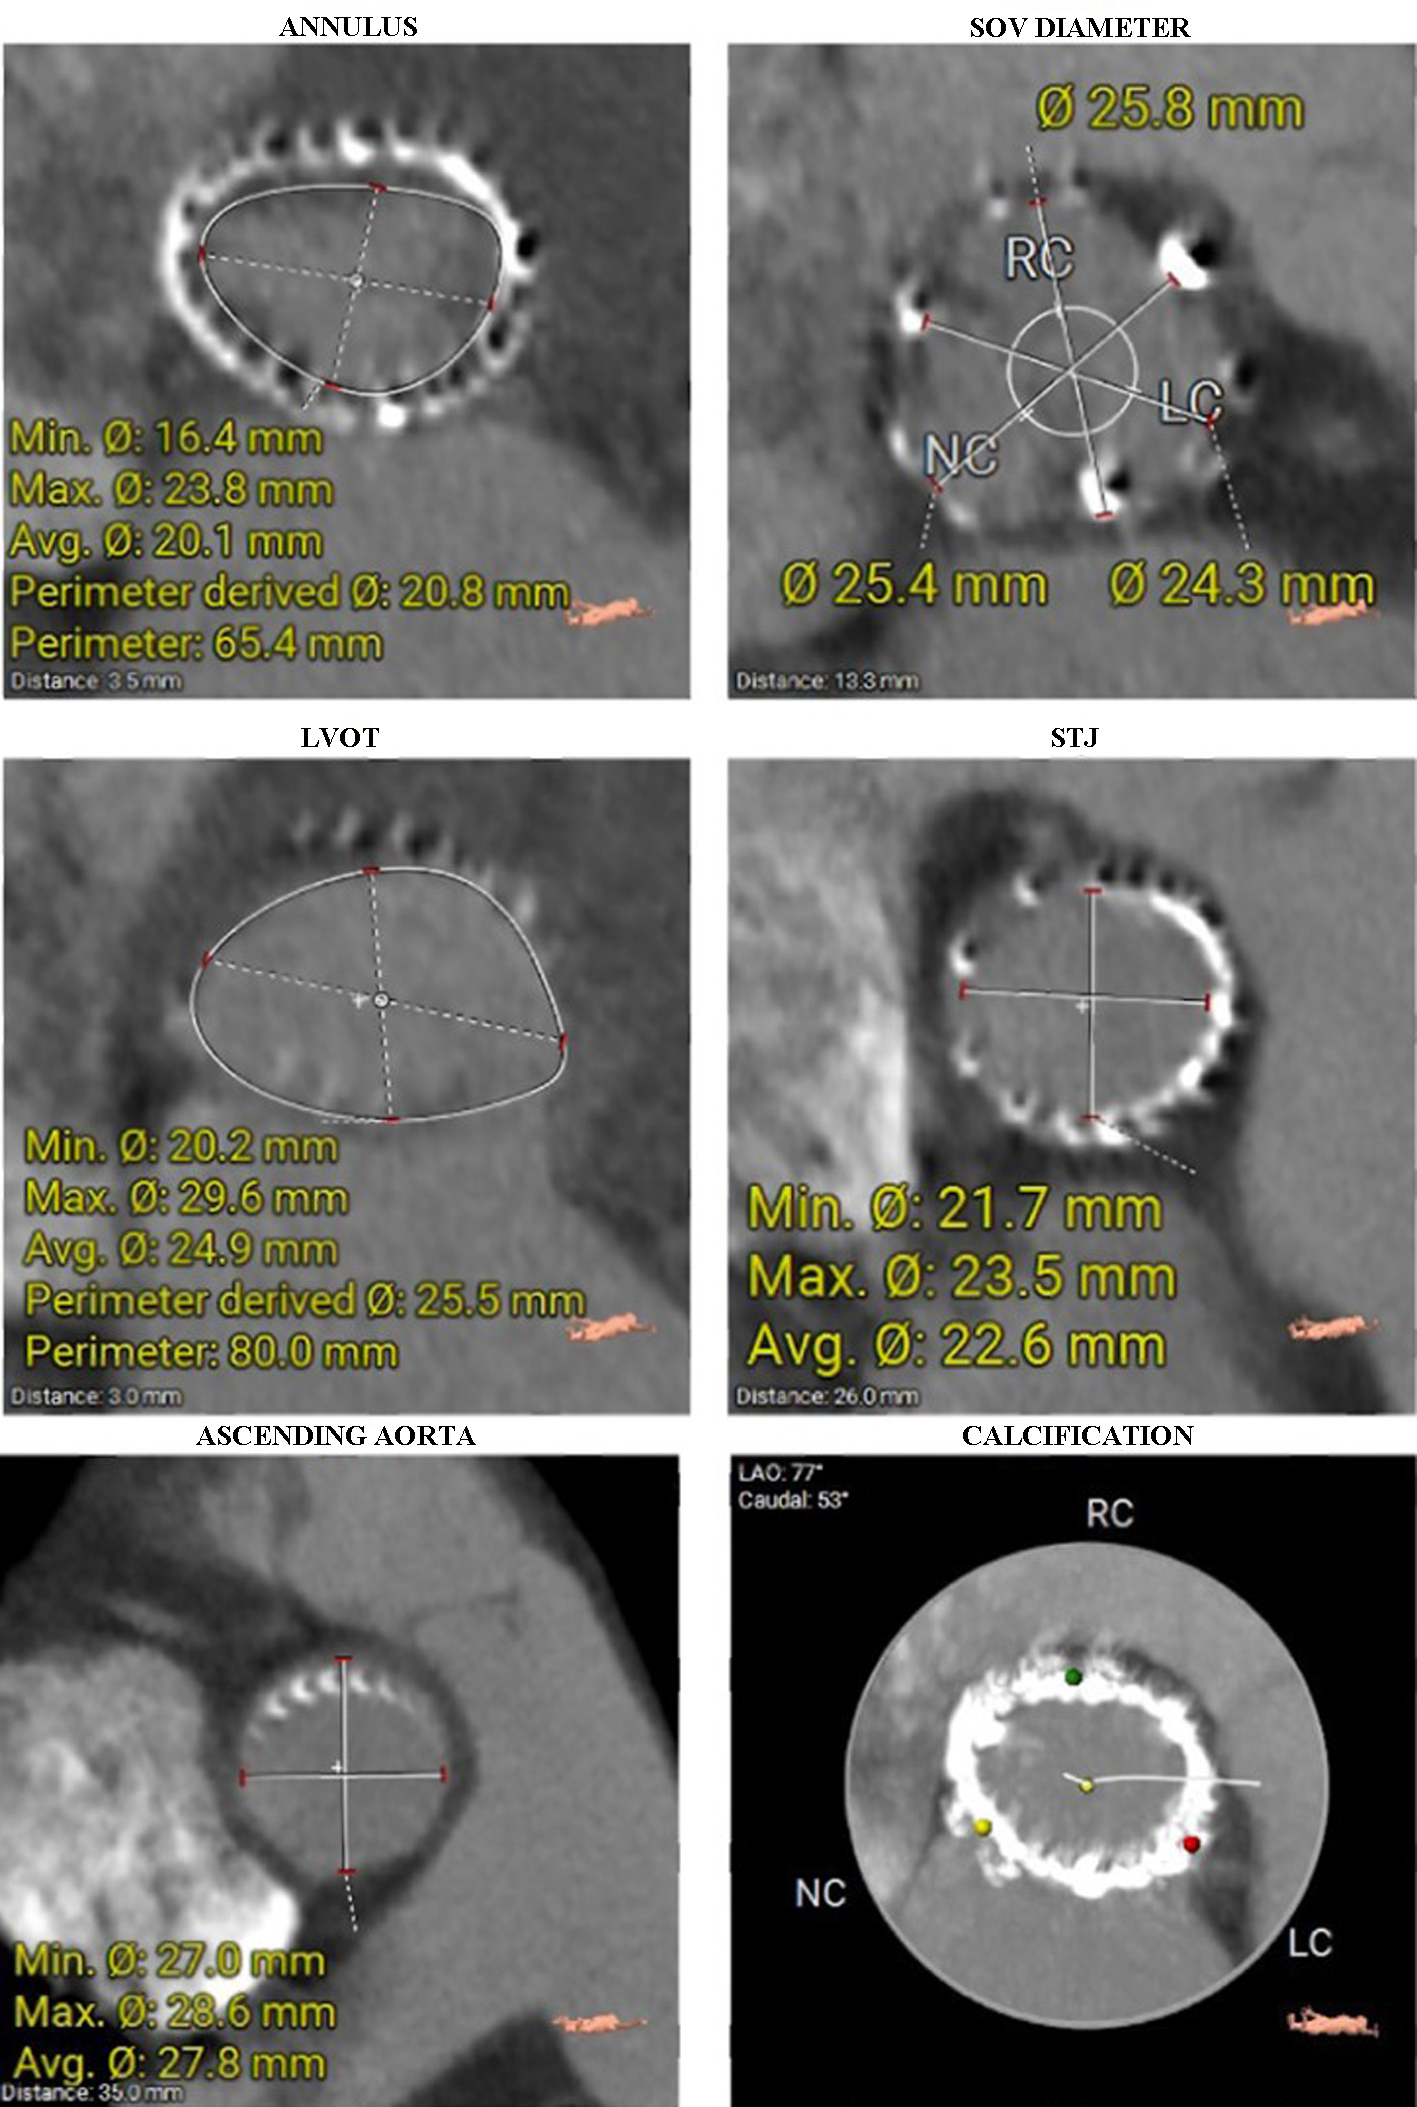
↓ Figure 2. Diameters of the aortic annulus, SOV, LVOT, STJ, and ascending aorta were measured on CT. The last image shows a heavily calcified aortic annulus. CT: computed tomography; LVOT: left ventricular outflow tract; SOV: sinus of Valsalva; STJ: sinotubular junction.
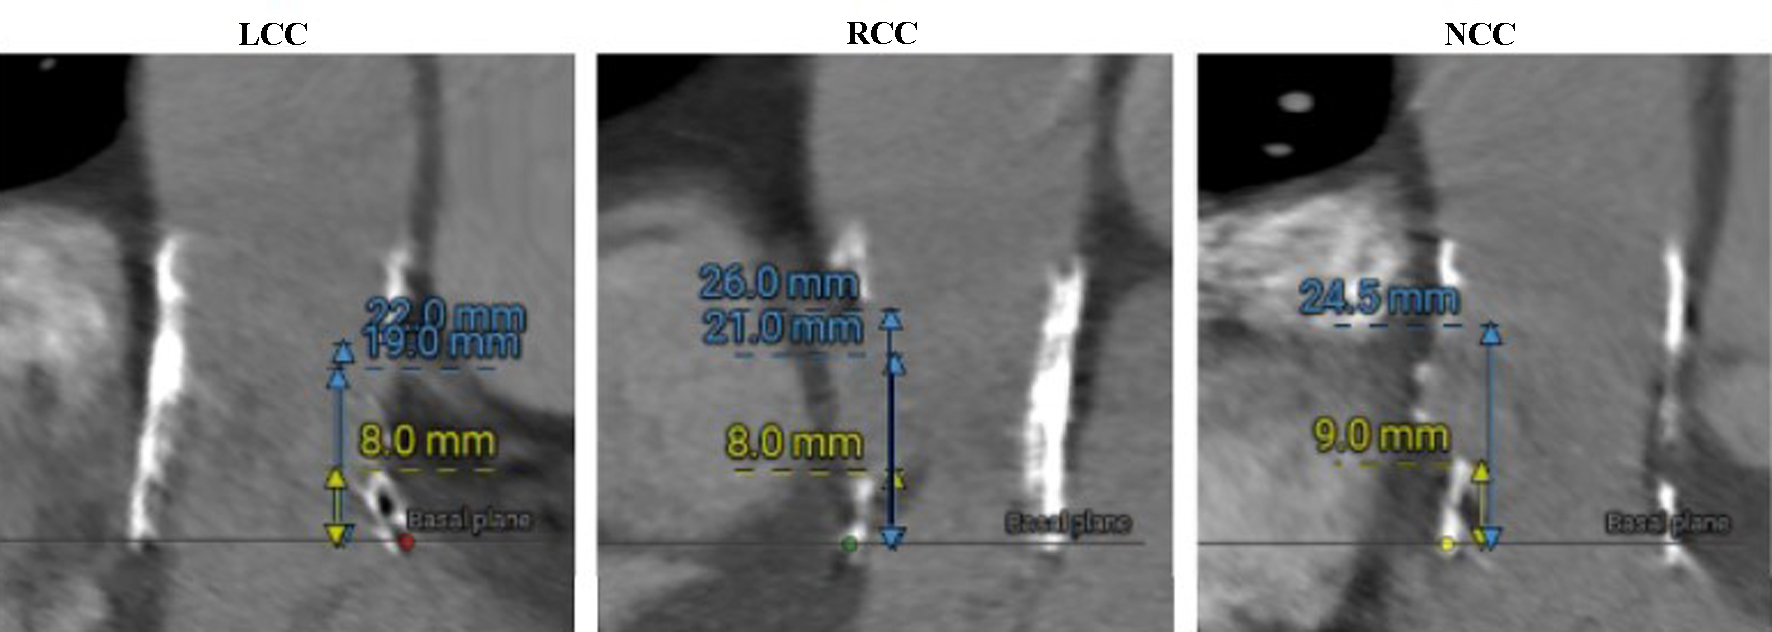
↓ Figure 3. Sinus of Valsalva heights measured on CT (LCC, RCC, and NCC, respectively). CT: computed tomography; LCC: left coronary cusp; NCC: non-coronary cusp; RCC: right coronary cusp.
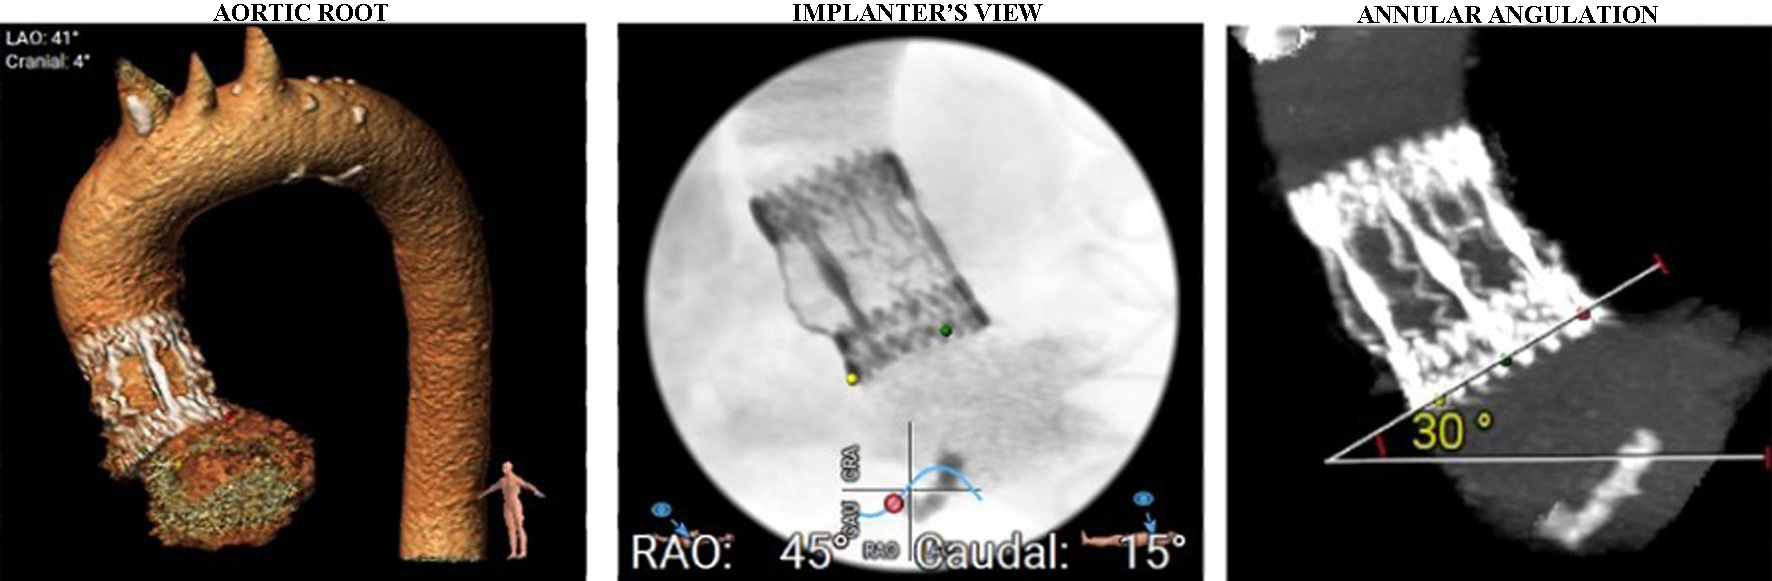
↓ Figure 4. Aortic arch and aortic root angulation. Separate origins of brachiocephalic trunk, left carotid artery, and left subclavian artery were seen.
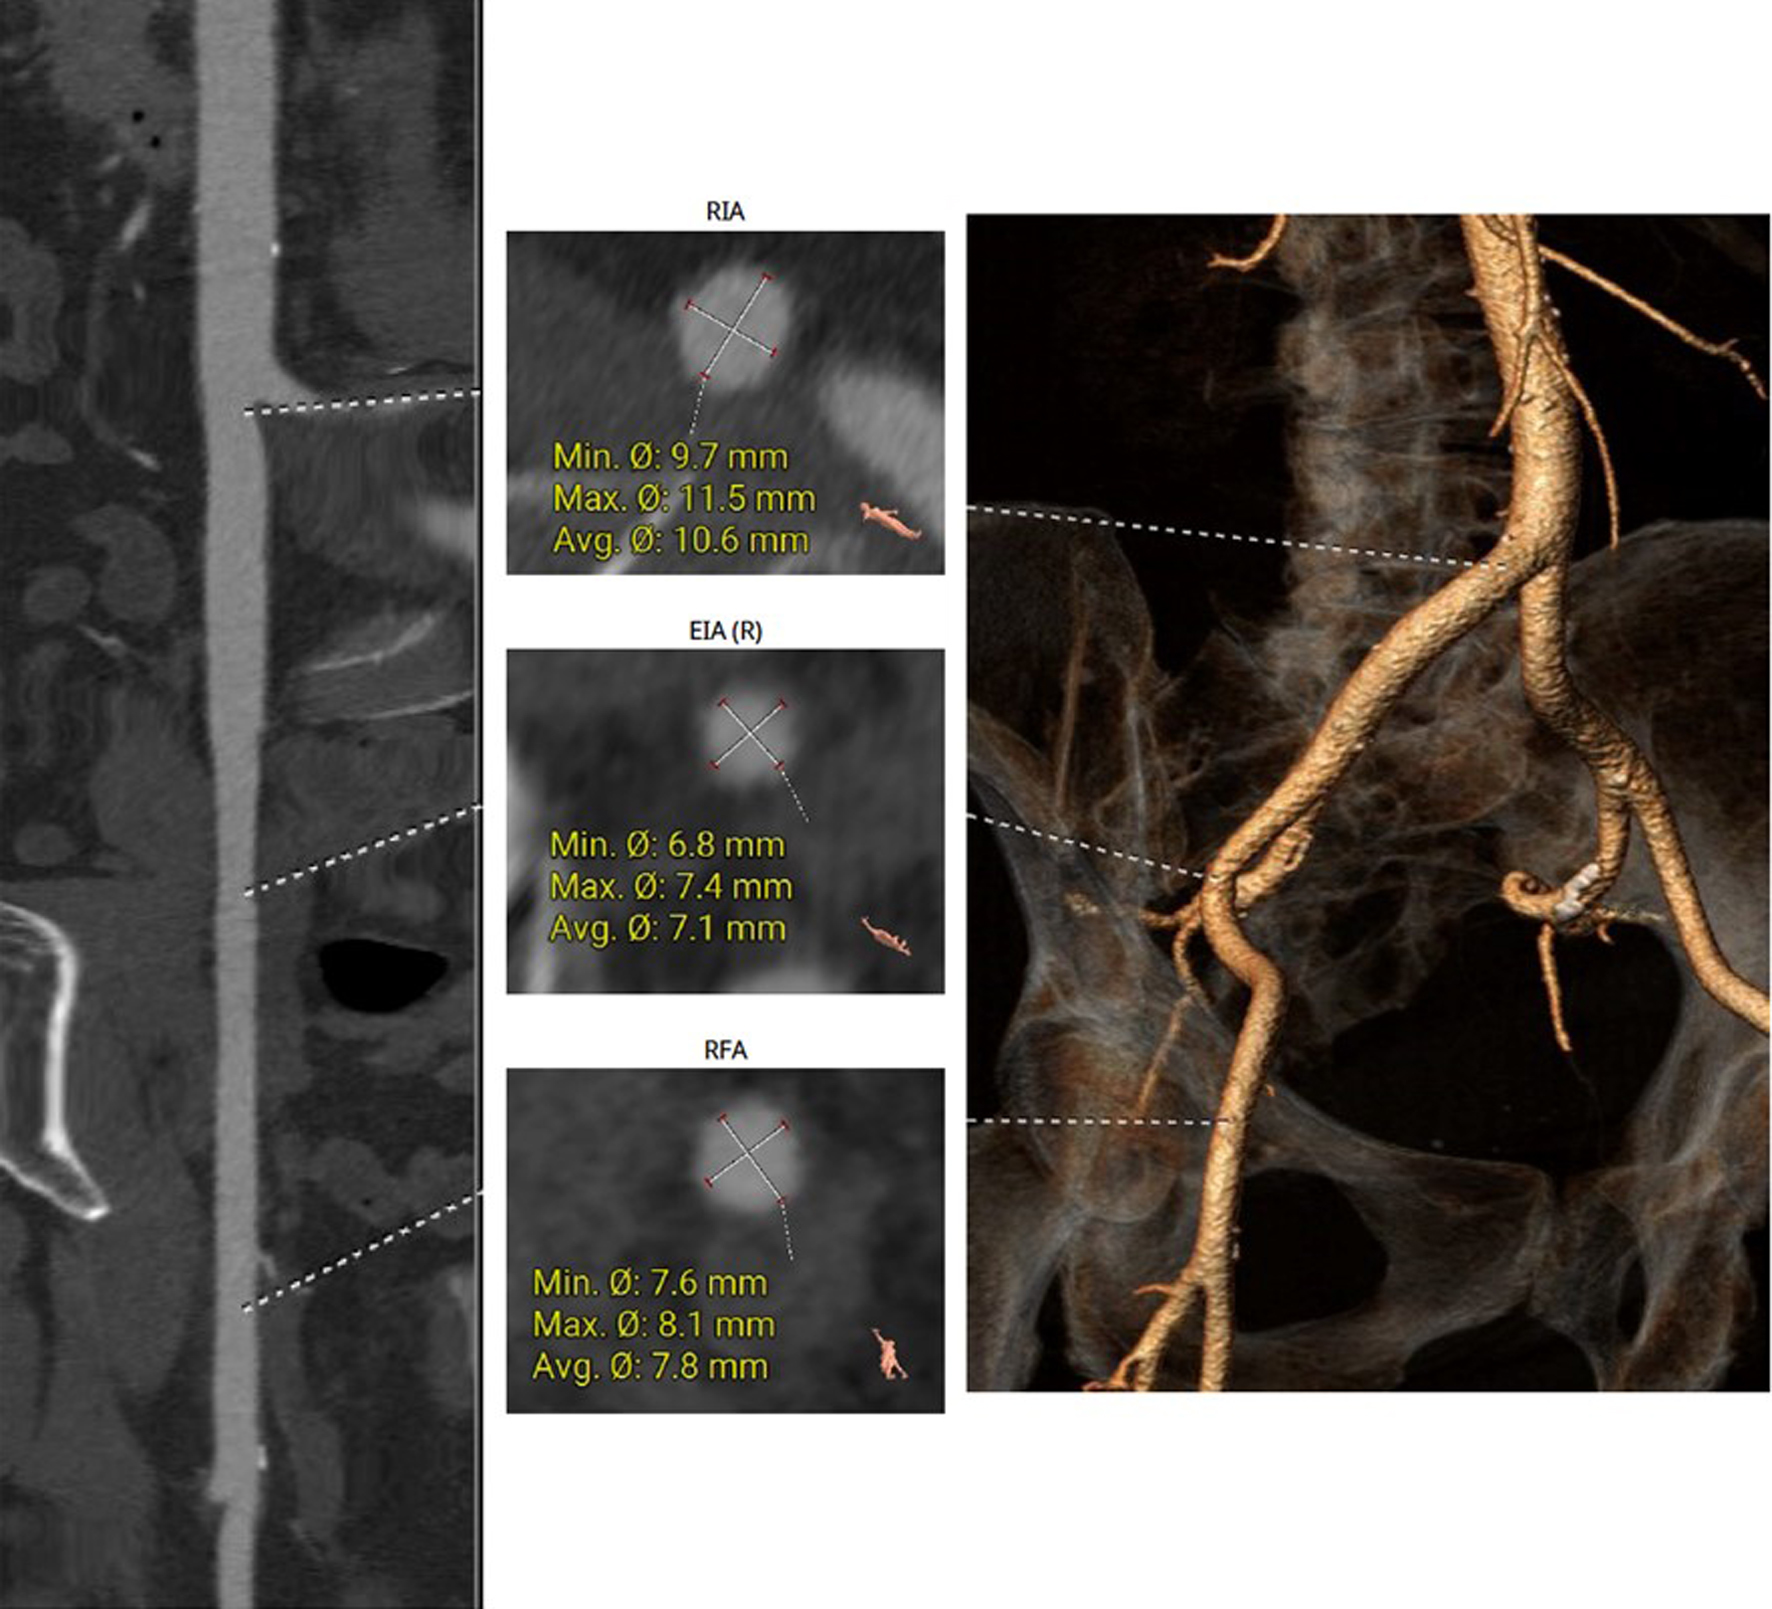
↓ Figure 5. The right femoral artery was chosen for the main access site, without significant tortuosity or notable calcification seen on CT. CT: computed tomography.
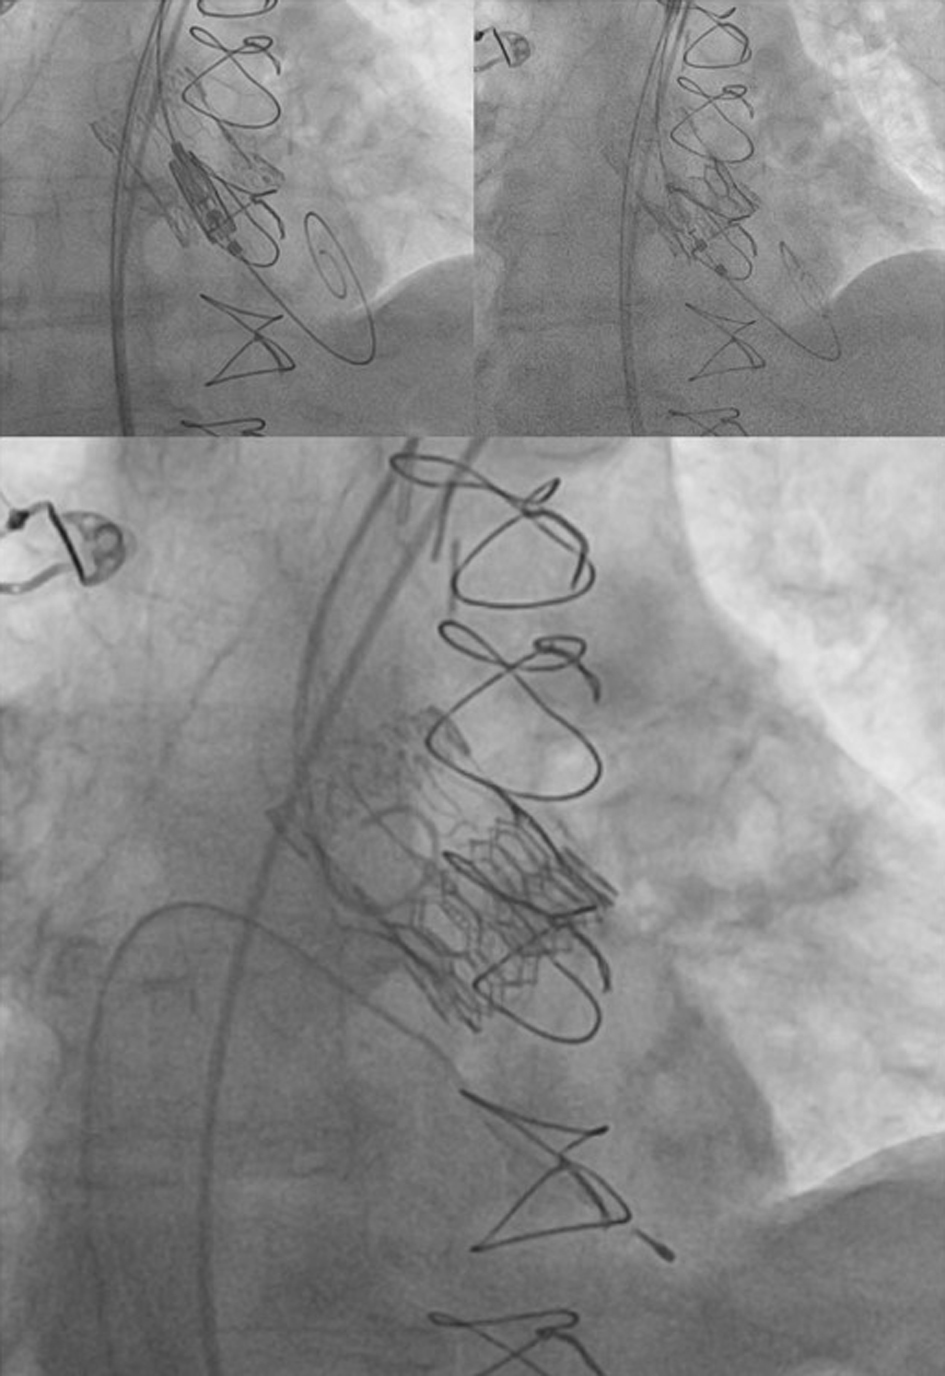
↓ Figure 6. Valve-in-valve TAVR - implantation of ballon-expandable Myval Octacor valve into previously implanted bioprothesis. TAVR: transcatheter aortic valve replacement.
↓ Figure 7. Post-procedural pressure gradients over aortic valve.