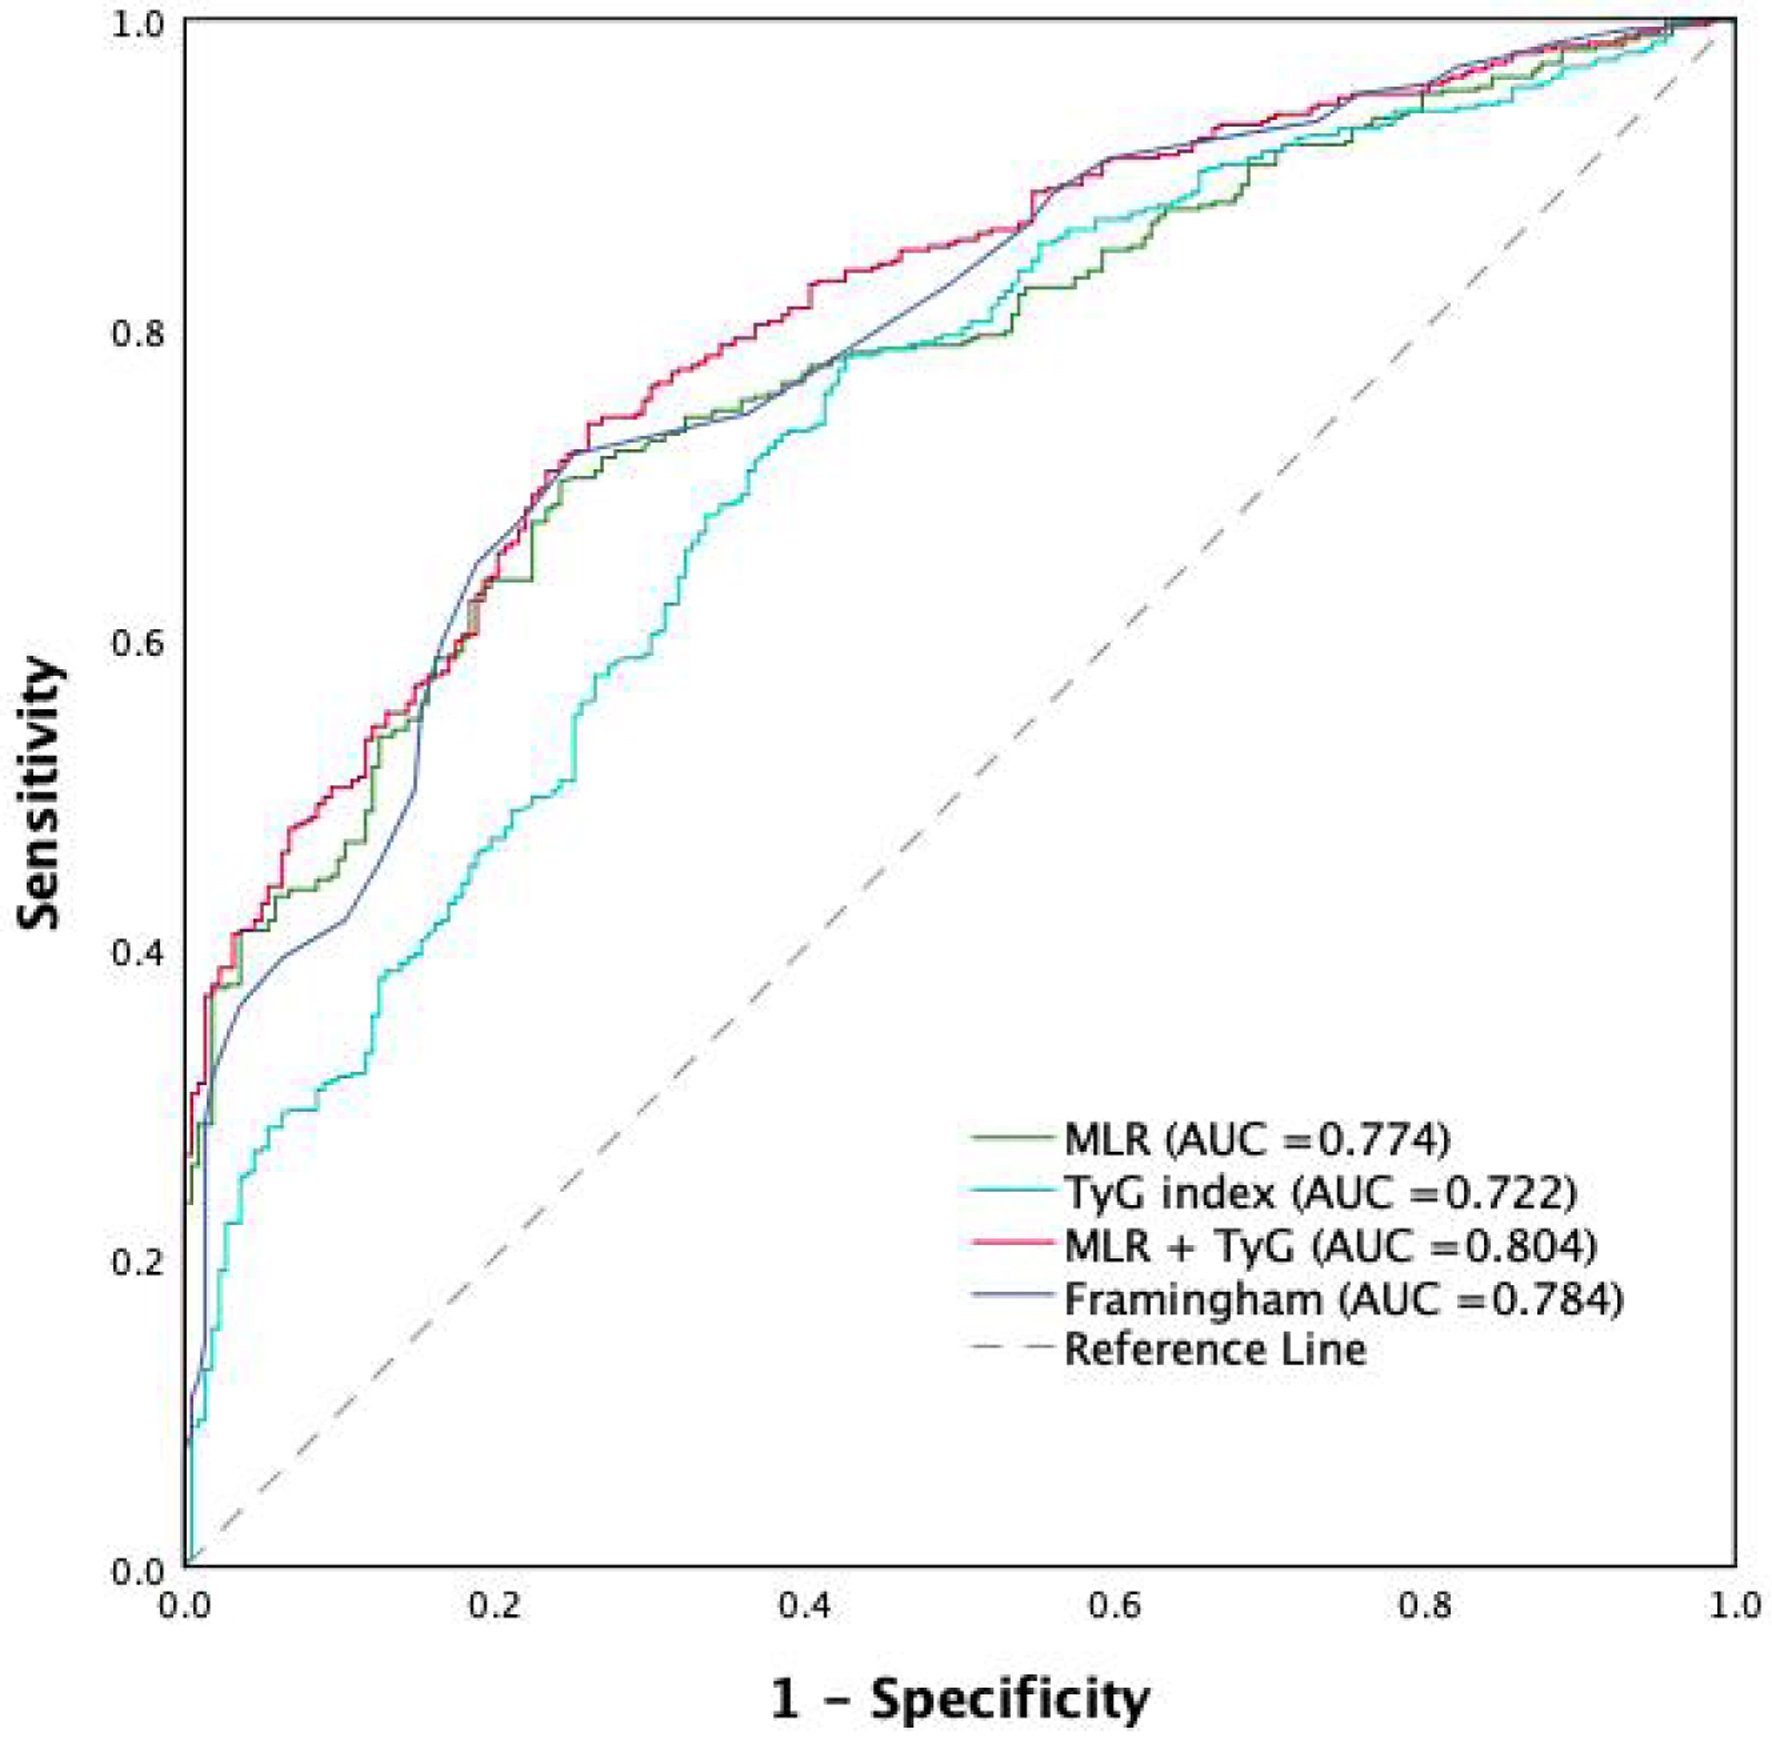
Cardiology Research, ISSN 1923-2829 print, 1923-2837 online, Open Access
Article copyright, the authors; Journal compilation copyright, Cardiol Res and Elmer Press Inc
Journal website https://cr.elmerpub.com

Original Article

Volume 16, Number 2, April 2025, pages 110-119


A Clinical Retrospective Study on the Combined Use of Monocyte-to-Lymphocyte Ratio and Triglyceride-Glucose Index to Predict the Severity of Coronary Artery Disease

Figures

Figure 1.
Figure 1. ROC curve comparing the predictive performance of MLR, TyG index, their combination (MLR and TyG index), and the Framingham risk model for CAD severity. CAD: coronary artery disease; MLR: monocyte-to-lymphocyte ratio; ROC: receiver operating characteristic; TyG: triglyceride-glucose.
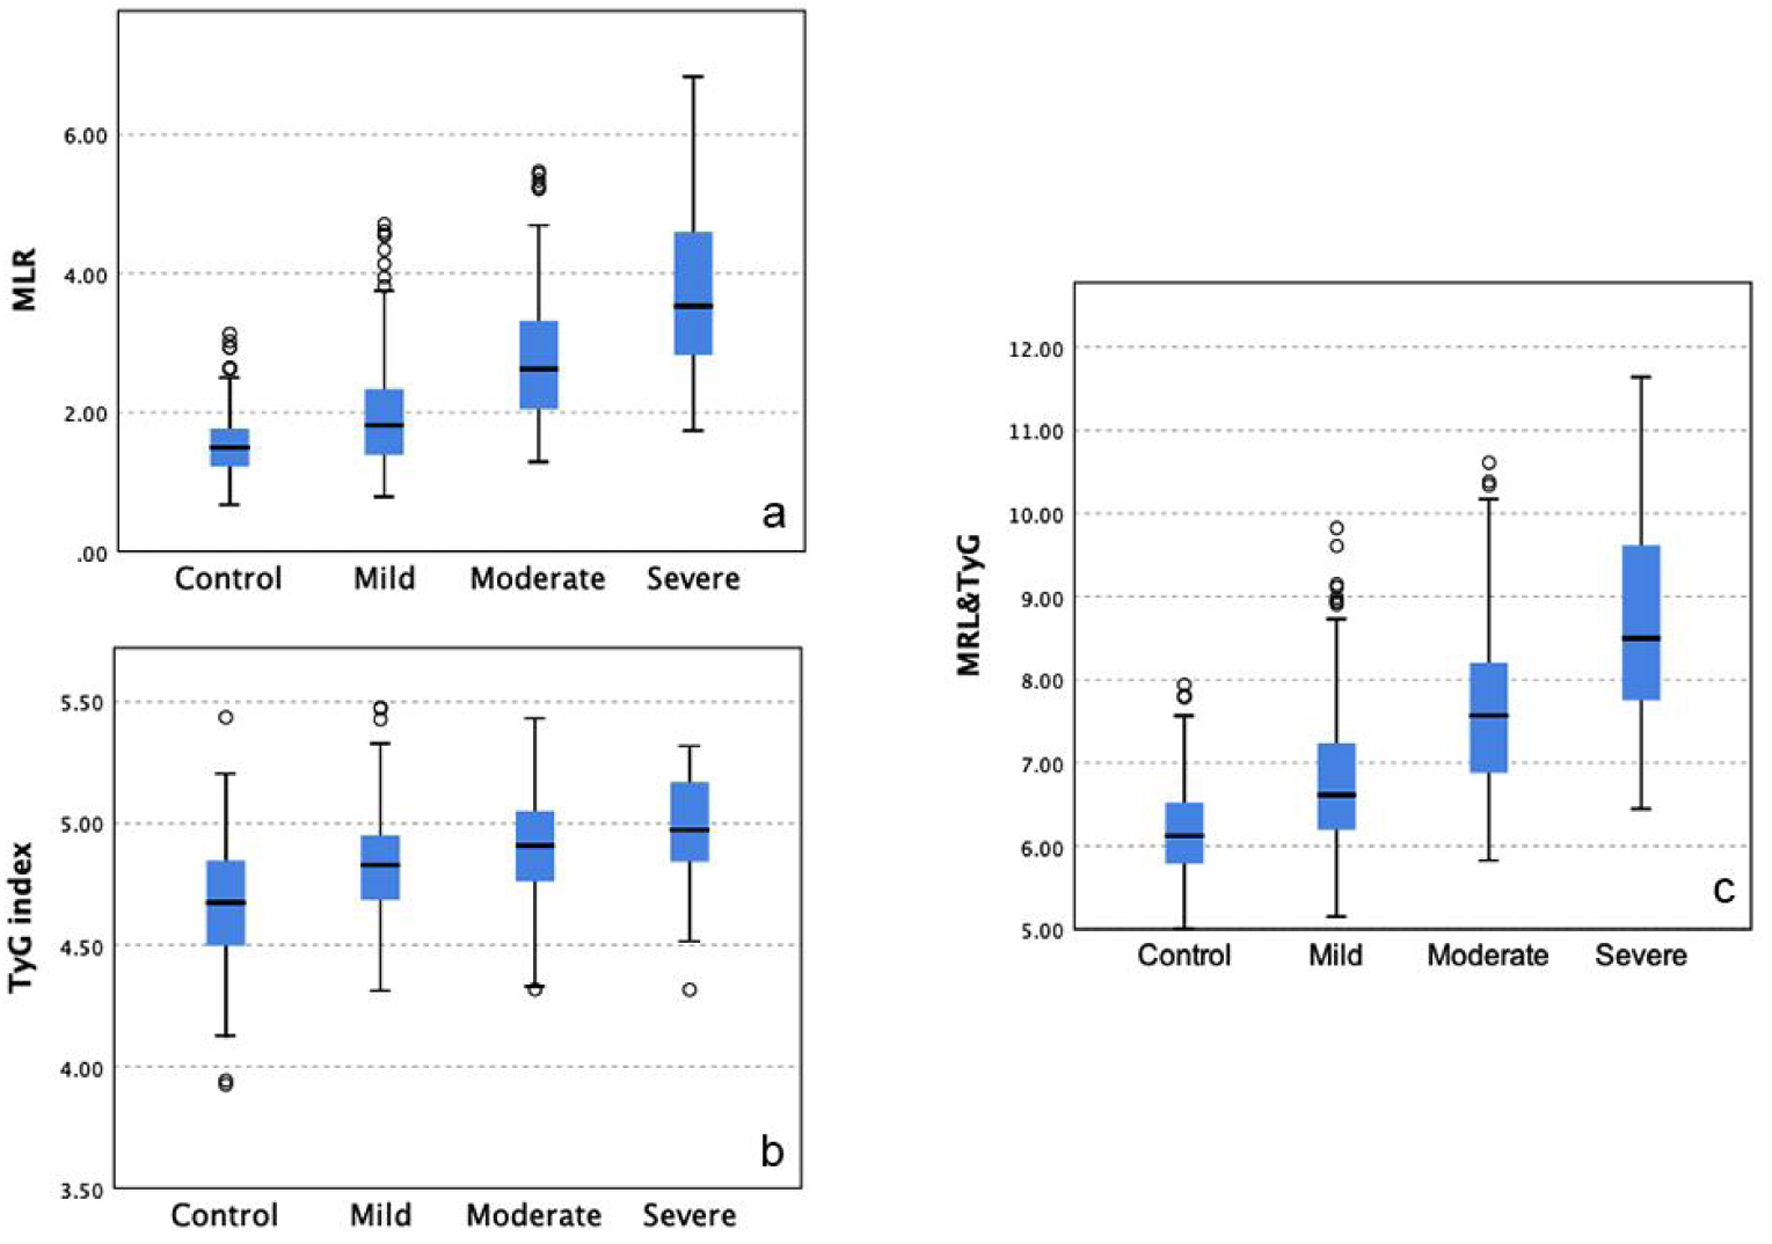
Figure 2.
Figure 2. Differences in MLR and TyG index across CAD severity groups. Significant differences were observed in MLR (a) and TyG index (b) across CAD severity groups, with the combined model (c) showing the most pronounced distinction. CAD: coronary artery disease; MLR: monocyte-to-lymphocyte ratio; TyG: triglyceride-glucose.
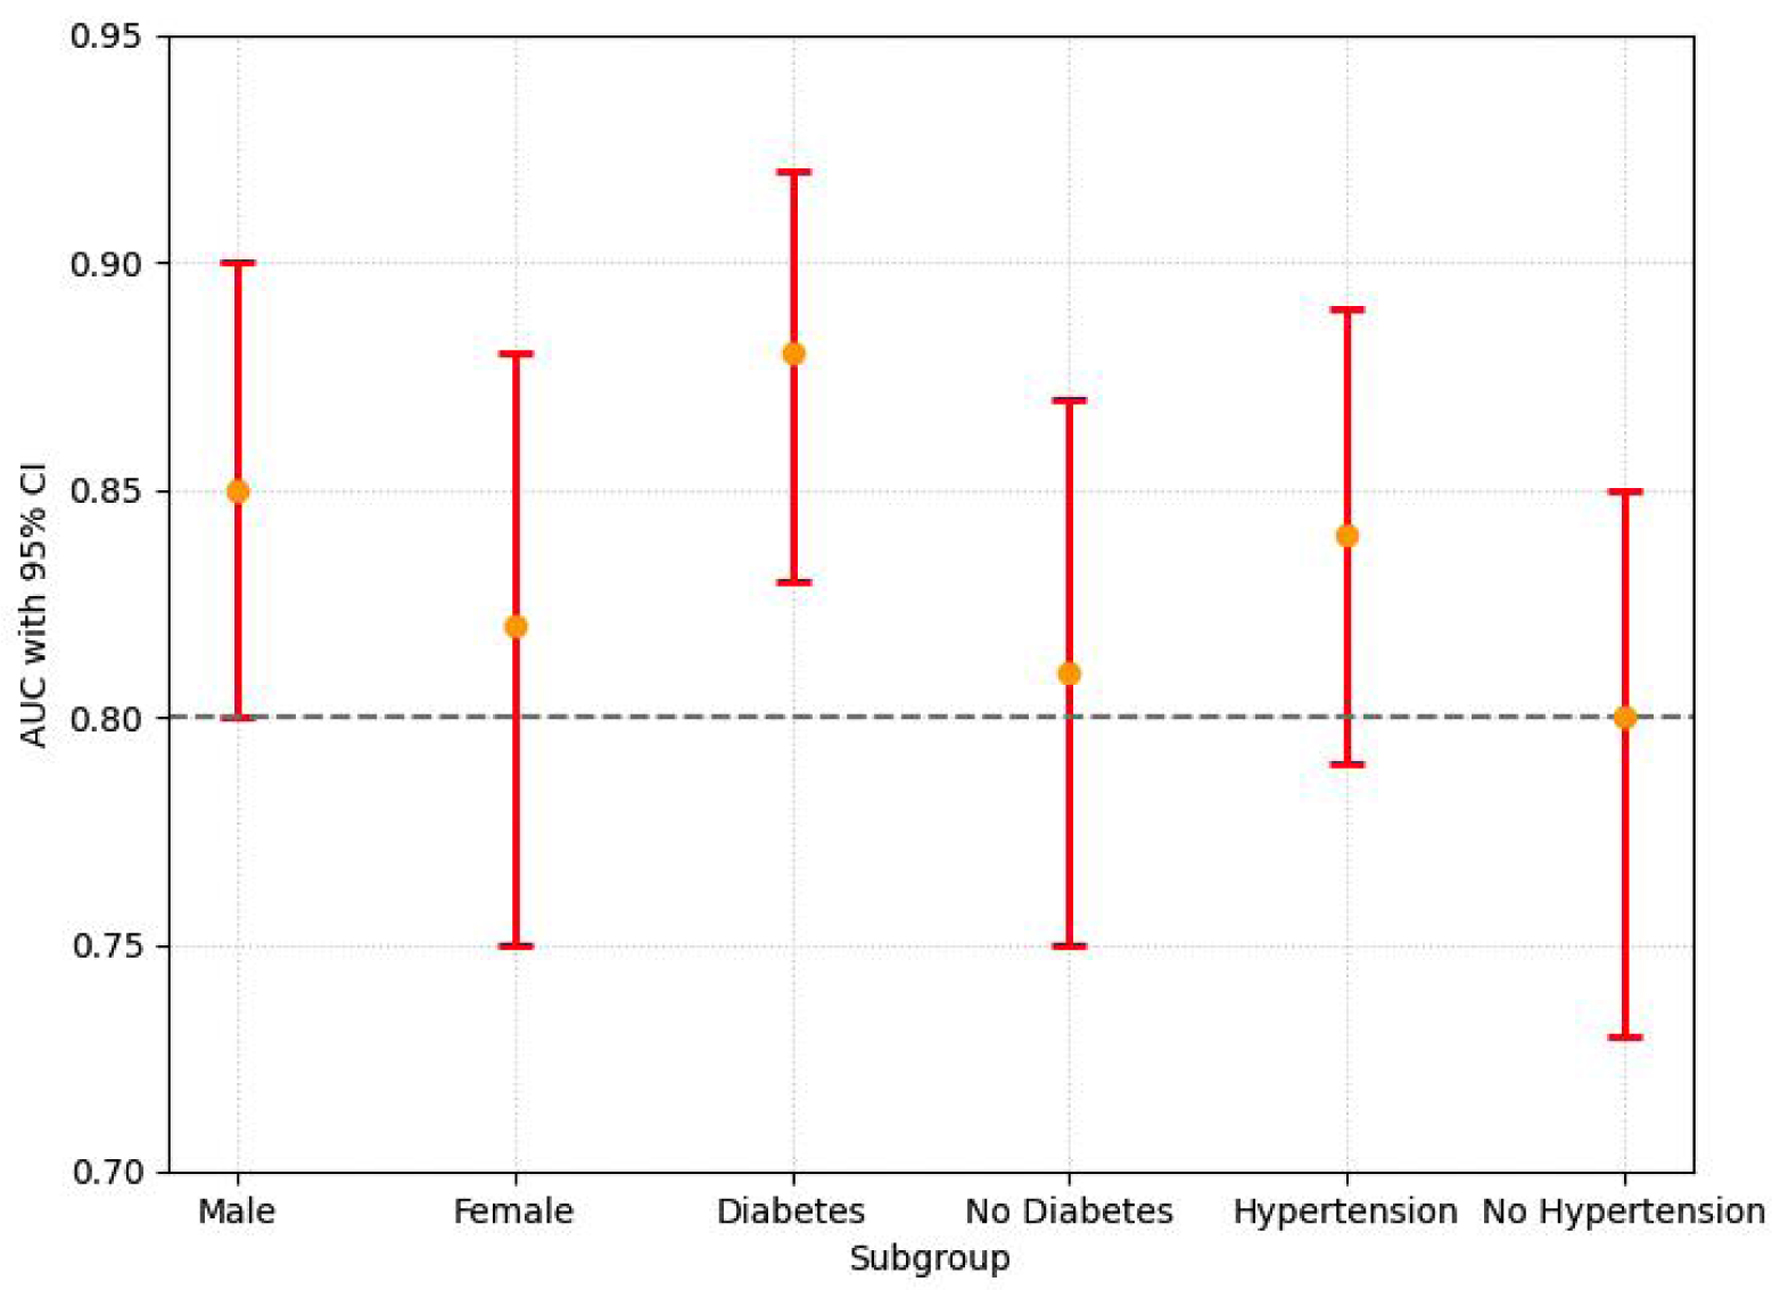
Figure 3.
Figure 3. The AUC values with 95% CI for subgroups (male, female, diabetes, no diabetes, hypertension, and no hypertension) are shown. Significant differences in AUC were observed between men and women (P < 0.05), and between diabetic and non-diabetic patients (P < 0.05). No significant differences in sensitivity and specificity were found between subgroups (not shown). Orange dots represent AUC values, and red bars represent the 95% CI. AUC: area under the curve; CI: confidence interval.

Tables

Table 1. Baseline Characteristics of the Study Population
 
VariablesControl group (n = 223)CAD group (n = 455)P value
BMI: body mass index; BUN: blood urea nitrogen; CCR: creatinine clearance rate; DM: diabetes mellitus; FPG: fasting plasma glucose; HDL: high-density lipoprotein cholesterol; HGB: hemoglobin; HT: hypertension; LDL: low-density lipoprotein cholesterol; MLR: monocyte-to-lymphocyte ratio; NLR: neutrophil-to-lymphocyte ratio; TC: total cholesterol; TG: triglycerides; TyG: triglyceride-glucose.
Age (years)55.94 ± 9.0363.33 ± 9.32< 0.01
Gender, male (%)70 (31.4%)245 (53.8%)< 0.01
BMI (kg/m2)24.79 ± 2.6724.90 ± 3.090.66
Smoking, n (%)69 (30.9%)244 (53.6%)< 0.01
DM, n (%)27 (12.1%)146 (32.1%)< 0.01
HT, n (%)109 (48.9%)343 (75.4%)< 0.01
HGB (g/L)136.3 ± 15.41135.39 ± 15.130.45
Platelet (× 109/L)223.51 ± 52.98209.07 ± 55.070.02
Leukocyte (× 109/L)5.89 (4.95 - 6.96)6.48 (5.2 - 7.63)< 0.01
Neutrophil (× 109/L)3.59 (2.83 - 4.31)4.27 (3.4 - 5.34)< 0.01
Monocyte (× 109/L)2.92 (2.36 - 3.41)4.03 (3.17 - 4.89)< 0.01
Lymphocyte (× 109/L)2.04 (1.59 - 2.50)1.78 (1.40 - 2.24)< 0.01
FPG (mmol/L)5.25 (4.63 - 5.91)6.18 (5.3 - 7.11)< 0.01
TC (mmol/L)4.84 (4.10 - 5.58)4.99 (4.23 - 4.75)0.18
TG (mmol/L)1.28 (0.99 - 1.94)1.75 (1.23 - 2.35)< 0.01
LDL (mmol/L)2.67 (2.12 - 3.24)2.74 (2.23 - 3.42)0.23
HDL (mmol/L)1.17 (1.02 - 1.37)1.13 (0.92 - 1.29)0.02
BUN (mmol/L)4.94 ± 1.025.13 ± 1.100.35
CCR (µmol/L)71.05 ± 15.3267.89 ± 16.020.13
MLR1.49 (1.22 - 1.77)2.20 (1.62 - 3.03)< 0.01
NLR1.79 (1.35 - 2.28)2.44 (1.74 - 3.37)< 0.01
TyG index4.67 (4.49 - 4.85)4.85 (4.72 - 5.04)< 0.01


Table 2. Spearman Correlation Analysis of MLR and TyG Index With CAD and Its Severity
 
Correlation indicatorMLRTyG index
rPrP
CAD: coronary artery disease; MLR: monocyte-to-lymphocyte ratio; SYNTAX: Synergy Between PCI With Taxus and Cardiac Surgery score; TyG: triglyceride-glucose.
CAD0.446<0.010.361<0.01
SYNTAX0.578<0.010.515<0.01


Table 3. Multivariate Logistic Regression Analysis of Factors Associated With CAD
 
VariableβWaldP valueOR95% CI
Multivariate logistic regression analysis. Wald test used for significance evaluation. *P < 0.05, **P < 0.01. BMI: body mass index; CAD: coronary artery disease; CI: confidence interval; DM: diabetes mellitus; FPG: fasting plasma glucose; HDL: high-density lipoprotein cholesterol; HGB: hemoglobin; HT: hypertension; LDL: low-density lipoprotein cholesterol; MLR: monocyte-to-lymphocyte ratio; NLR: neutrophil-to-lymphocyte ratio; OR: odds ratio; SYNTAX: Synergy Between PCI With Taxus and Cardiac Surgery score; TyG: triglyceride-glucose; TC: total cholesterol; TG: triglycerides; TyG: triglyceride-glucose.
Age0.0617.920.002**1.051.03 - 1.09
Male0.321.850.1741.380.87 - 2.18
BMI0.072.530.1121.080.98 - 1.19
Smoking0.636.140.013*1.861.14 - 3.05
DM1.008.540.024*2.721.35 - 5.32
HT0.373.480.0621.450.98 - 2.15
HGB-0.036.340.012*0.970.95 - 0.99
Platelet0.010.430.5101.010.99 - 1.02
Leukocyte0.154.120.042*1.161.01 - 1.33
Neutrophil0.175.350.021*1.191.03 - 1.38
Monocyte0.143.840.0501.151.00 - 1.33
Lymphocyte-0.112.900.0890.900.79 - 1.30
FPG0.8917.690.015*1.121.61 - 3.67
TC0.081.250.2641.080.95 - 1.22
TG0.3911.430.001**1.481.22 - 1.80
LDL0.060.530.4701.060.89 - 1.27
HDL-0.110.990.3200.890.70 - 1.12
NLR0.426.680.010**1.521.10 - 2.10
MLR0.7610.230.001**2.151.40 - 3.28
TyG index0.5612.560.001**1.751.30 - 2.36
SYNTAX0.8215.120.001**2.271.57 - 3.28


Table 4. Association of MLR and TyG Index With CAD Severity
 
CAD severityMLRTyG index
OR (95% CI)aPOR (95% CI)aP
aAdjustment for gender, smoking, hypertension, diabetes, TC, TG, HDL-C, LDL-C. CAD: coronary artery disease; CI: confidence interval; HDL: high-density lipoprotein cholesterol; LDL: low-density lipoprotein cholesterol; MLR: monocyte-to-lymphocyte ratio; TyG: triglyceride-glucose; OR: odds ratio; TC: total cholesterol; TG: triglycerides.
Mild CAD0.90 (0.53 - 1.28)< 0.0012.13 (1.18 - 3.09)< 0.001
Moderate CAD1.93 (1.47 - 2.38)< 0.0013.03 (1.66 - 4.39)< 0.001
Severe CAD2.68 (2.18 - 3.18)< 0.0014.30 (2.64 - 5.74)< 0.001