Figures
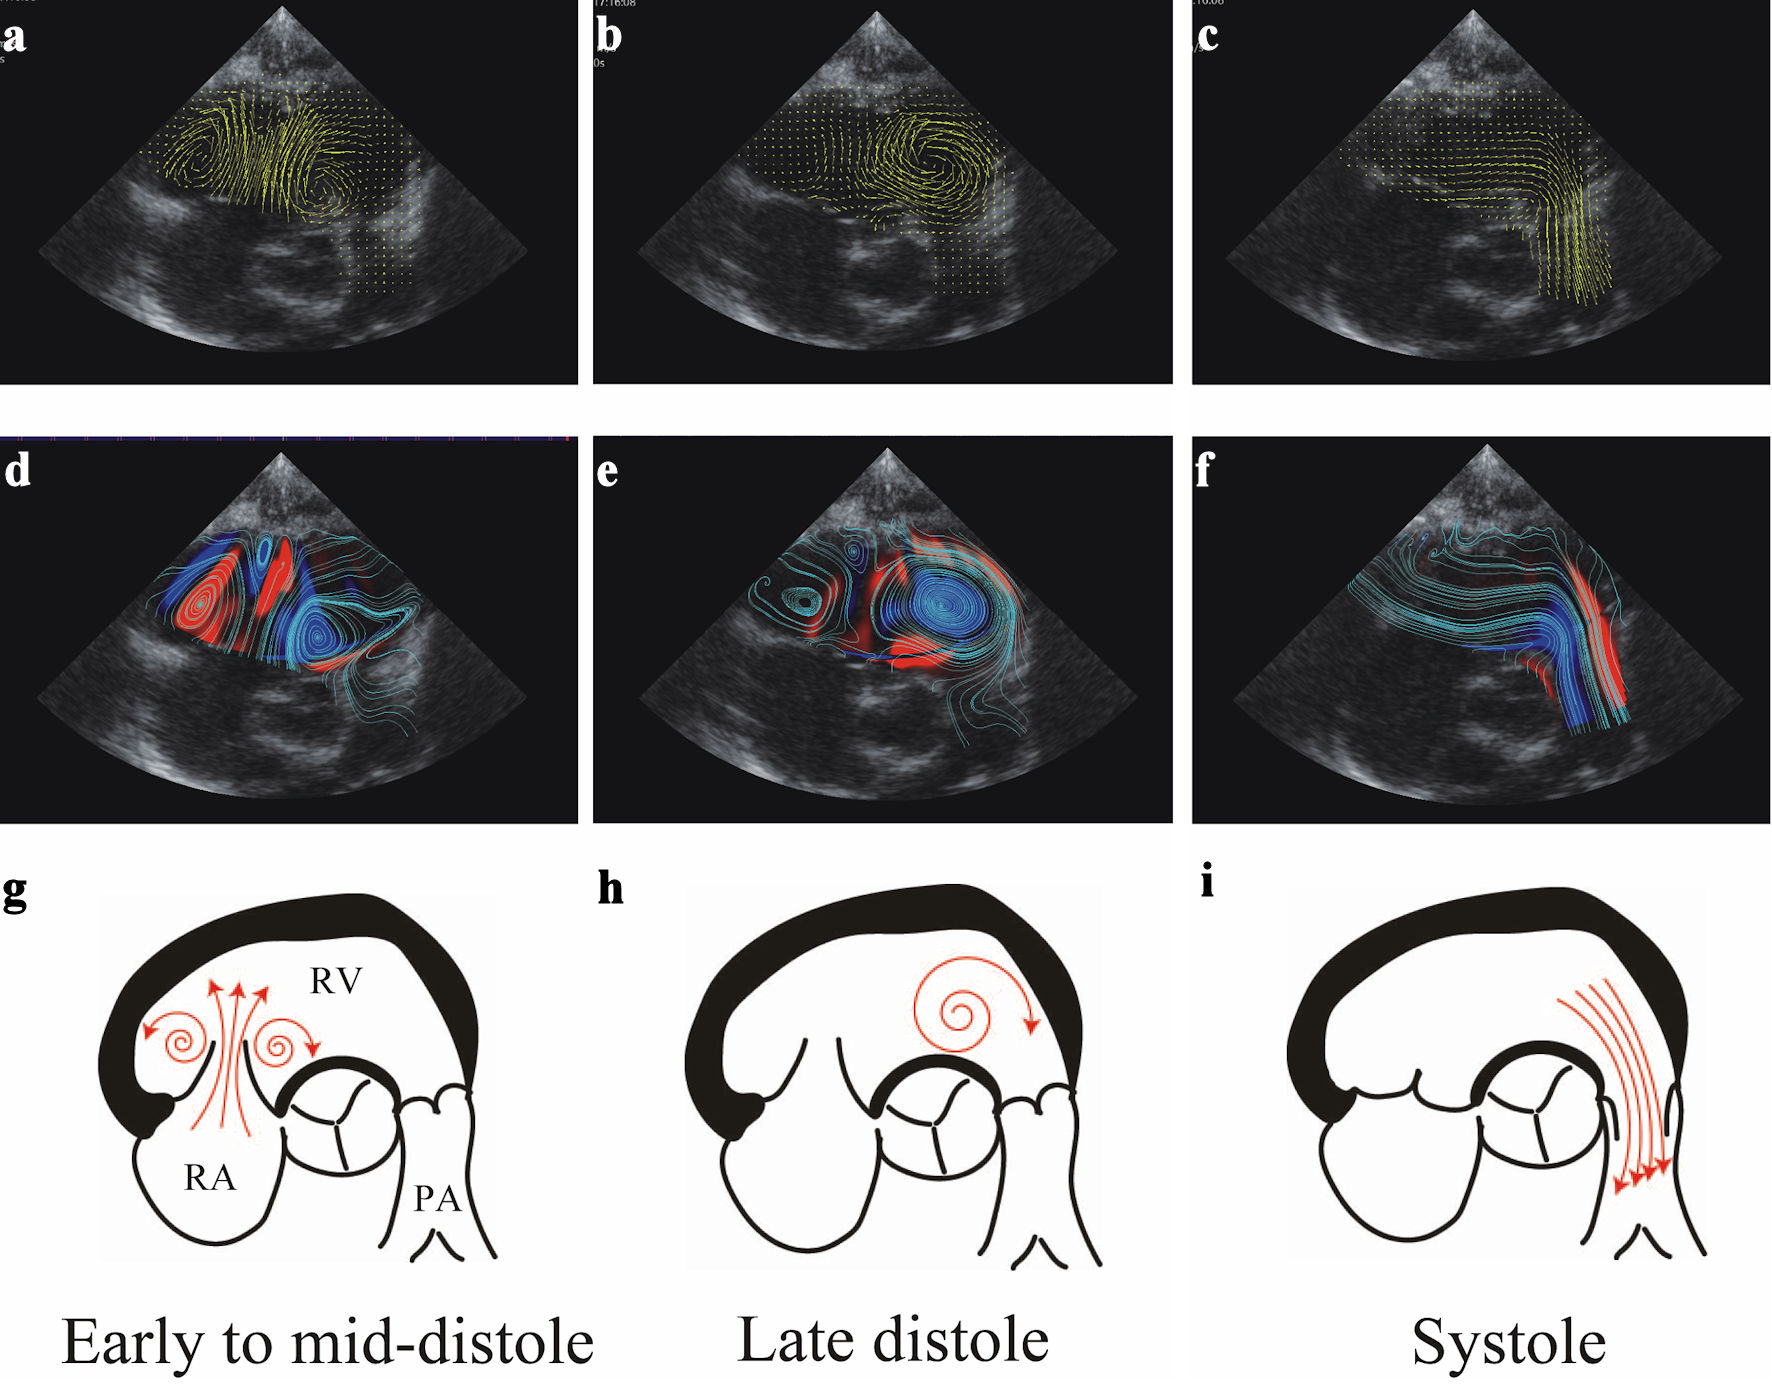
↓ Figure 1. Representative RV flow sequence during phases of cardiac cycle in a control group subject. (a-c) Visualization of VFM images in early diastole, late diastole, and systole. Yellow lines and arrows indicate the direction of flow, and line length is proportional to the velocity of flow. (d-f) Streamline and vorticity during the cardiac cycle. Clockwise (CW) vortices are shown in blue, counterclockwise (CCW) vortices in red. Note the presence of CW (blue) and CCW (red) vortices during early-diastolic filling below the septal and anterior leaflets, respectively. The CW vortex below the septal leaflet moves apically to the outflow tract region during late diastole, persisting further during isovolumic contraction. CW vortex is shown in this location. Ejection is characterized by accelerating this vortex flow towards the RV outflow tract. (g-i) Schematic diagrams of the vector flow mapping display during each phase of the cardiac cycle. RV: right ventricular; VFM: vector flow mapping.
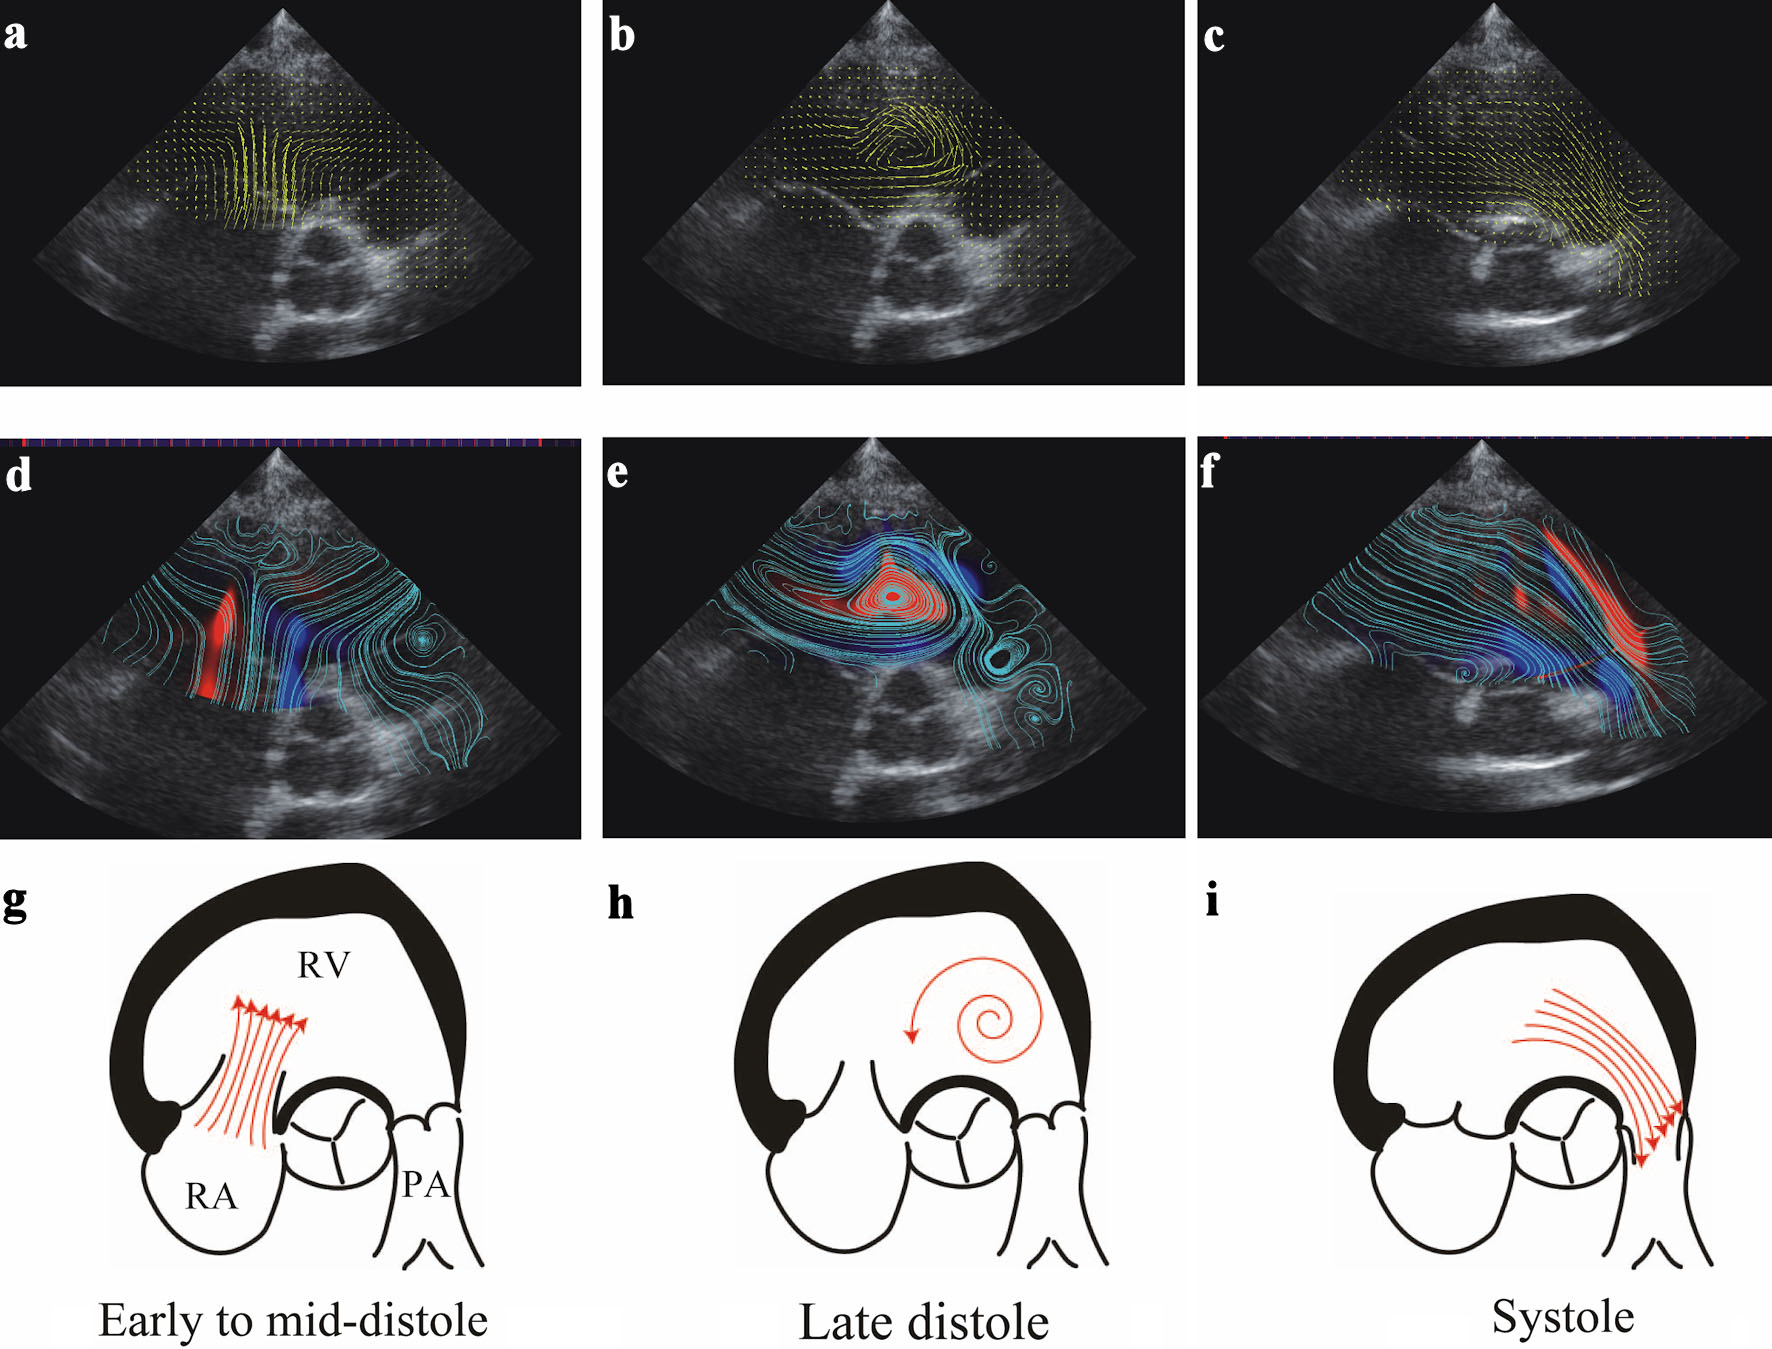
↓ Figure 2. Representative RV flow sequence during phases of the cardiac cycle in a PH group patient. (a-c) Visualization of VFM images in early diastole, late diastole, and systole. Yellow lines and arrows indicate direction of flow, and line length is proportional to the velocity of flow. (d-f) Streamline and vorticity during the cardiac cycle. Clockwise (CW) vortices are shown in blue color, counterclockwise (CCW) vortices in red. Note that no vortices are present during early-diastolic filling below the septal and anterior leaflets. A CCW vortex is shown apical to the outflow tract region during late diastole. (g-i) Schematic diagrams of vector flow mapping during each phase of the cardiac cycle. RV: right ventricular; VFM: vector flow mapping.
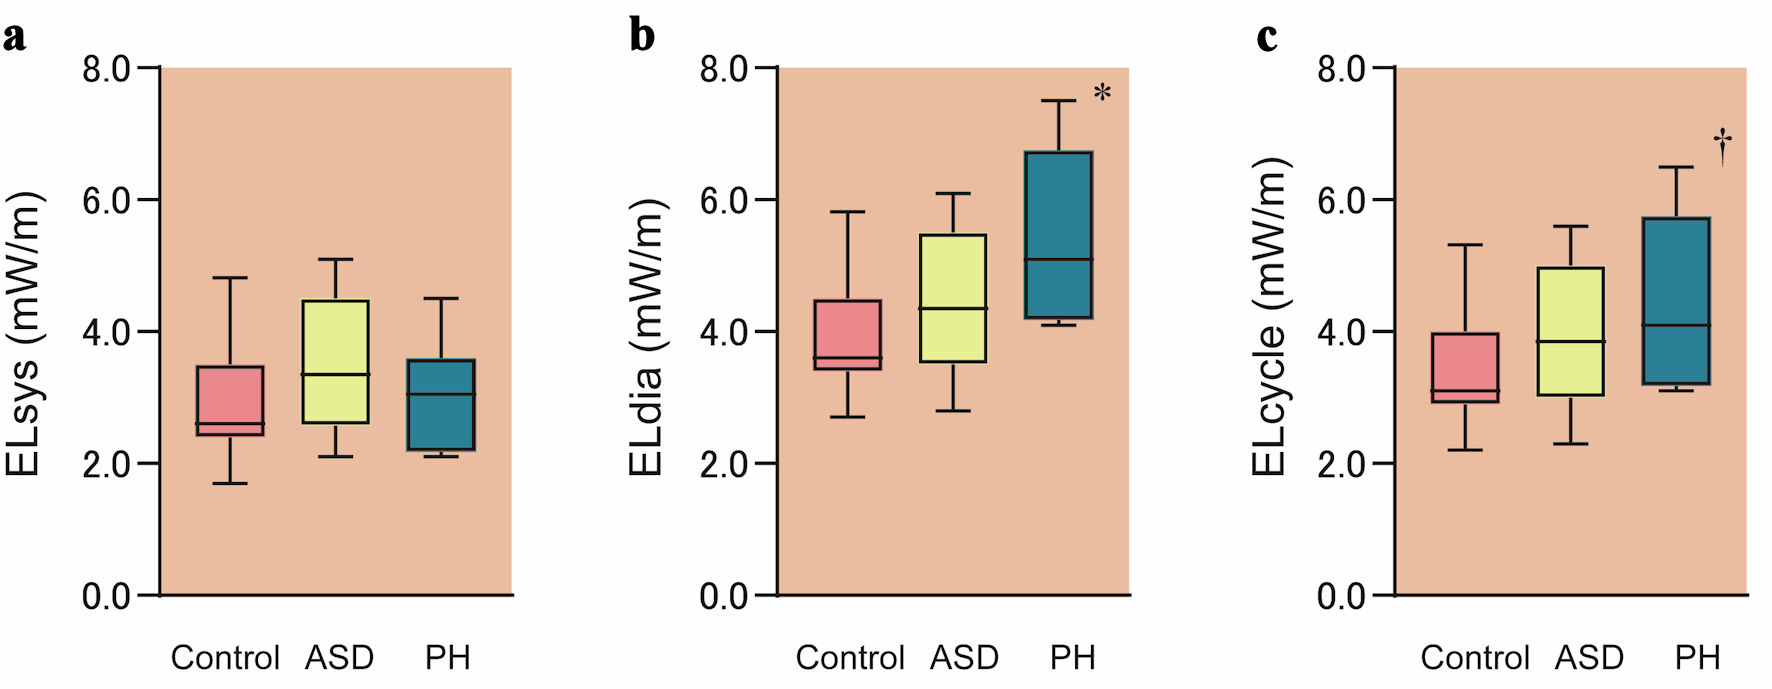
↓ Figure 3. Comparison of energy loss between groups. Mean systolic energy loss (ELsys) (a), mean diastolic energy loss (ELdia) (b) and mean energy loss over one cardiac cycle (ELcycle) (c) obtained from VFM in each group are shown. Boxes show distribution (25th and 75th percentiles; central line, median). Vertical lines represent the range between the fifth and 95th percentiles. *P = 0.0046 vs. control; †P = 0.0471 vs. control. VFM: vector flow mapping; ASD: atrial septal defect; PH: pulmonary hypertension.
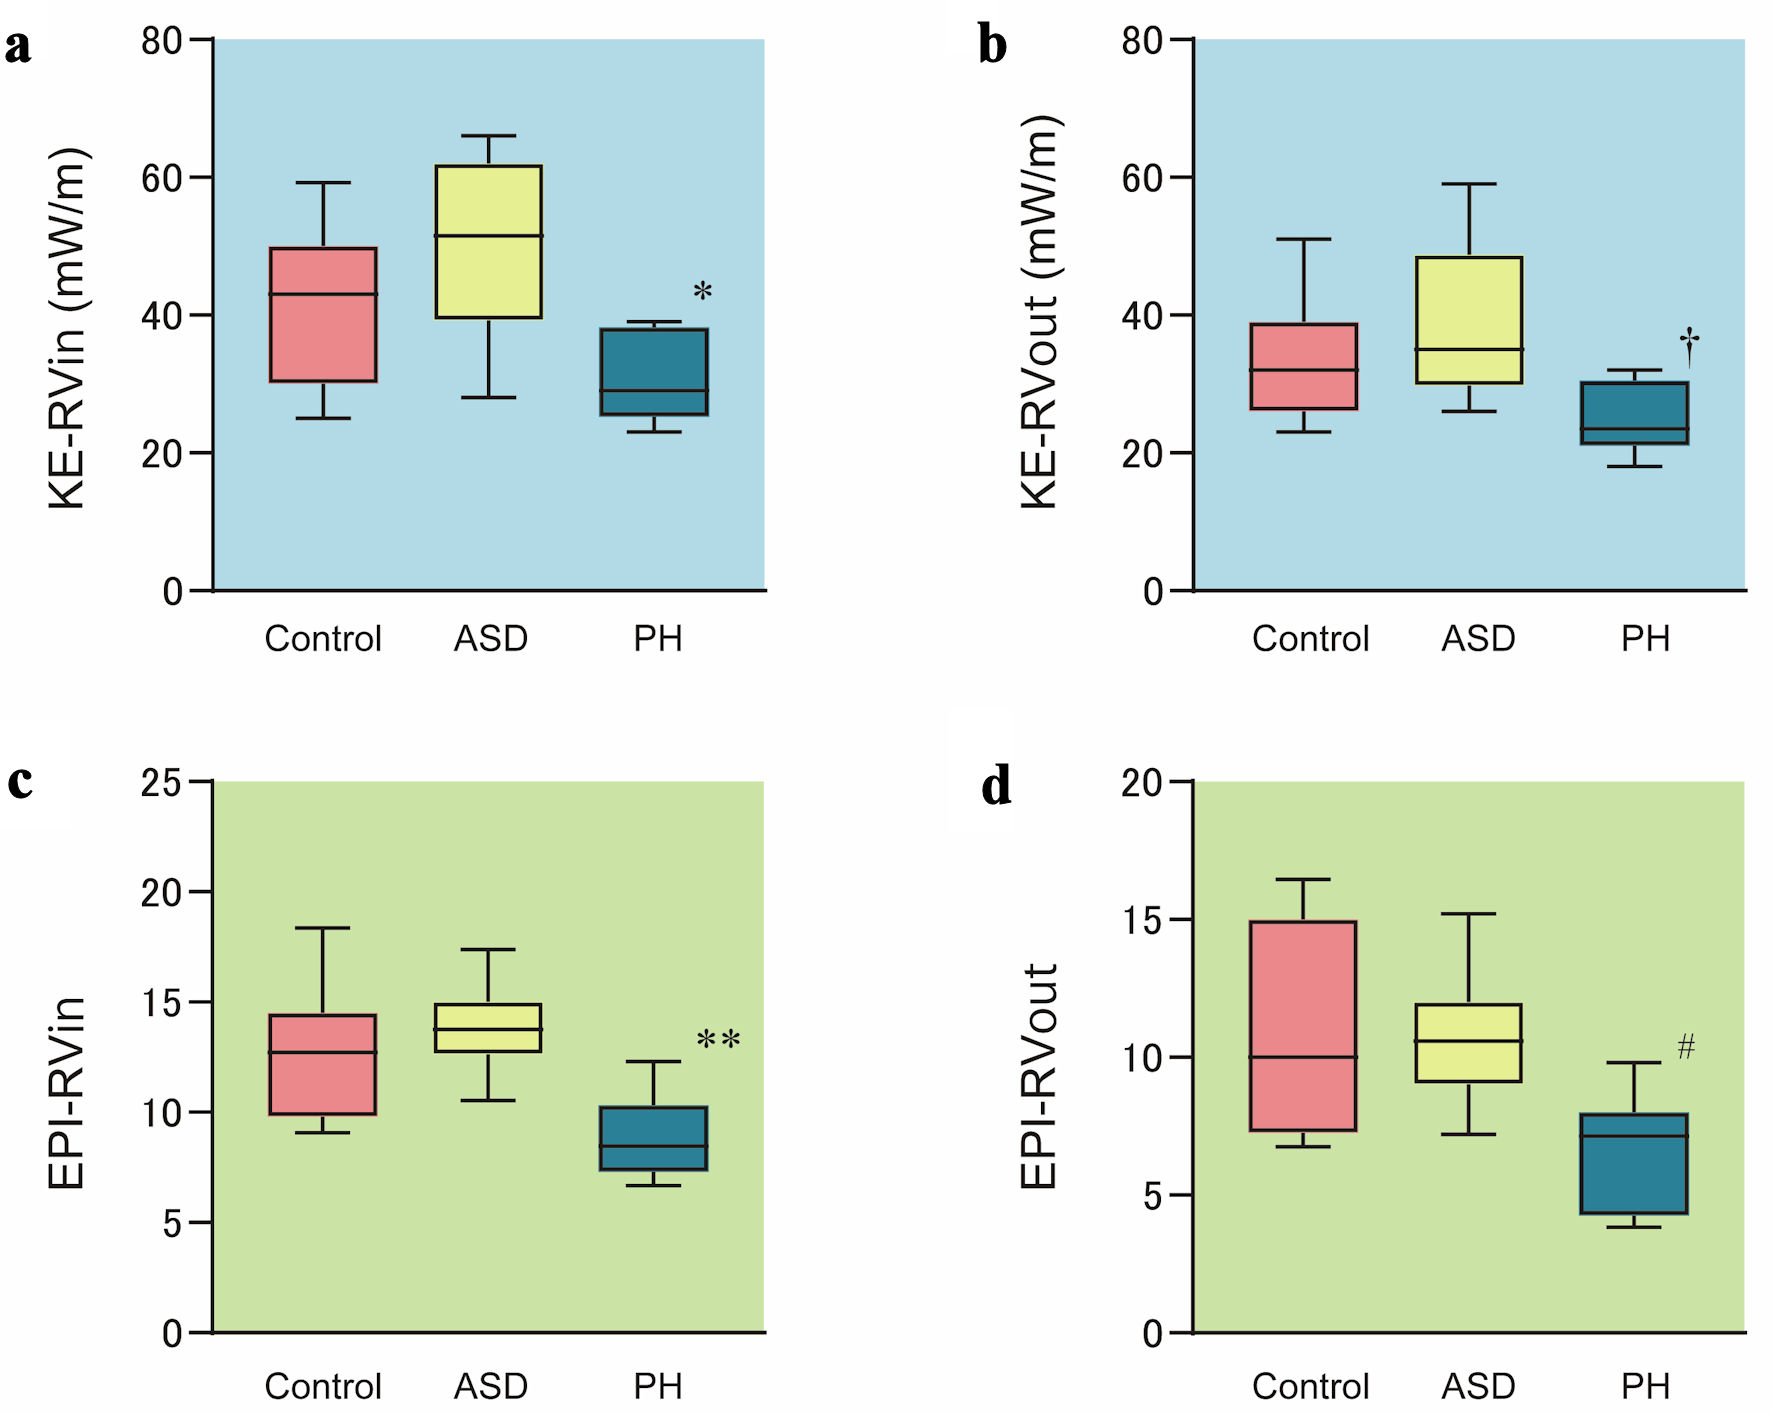
↓ Figure 4. Comparison of kinetic energy and energetic performance index between groups. Kinetic energy of the RV inflow tract (KE-RVin) (a), kinetic energy of the RV outflow tract (KE-RVout) (b), energetic performance index of the RV inflow tract (EPI-RVin) (c) and energetic performance index of the RV outflow tract (EPI-RVout) (d) obtained from VFM in each group are shown. Boxes show distribution (25th and 75th percentiles; central line, median). Vertical lines represent the range between the fifth and 95th percentiles. *P = 0.0331 vs. control and P = 0.0036 vs. ASD; †P = 0.0233 vs. control and P = 0.0069 vs. ASD; **P = 0.0088 vs. control and P = 0.0024 vs. ASD; #P = 0.0196 vs. control and P = 0.0487 vs. ASD. VFM: vector flow mapping; ASD: atrial septal defect; PH: pulmonary hypertension.
Tables
↓ Table 1. Clinical Characteristics in Each Group
| Control (n = 35) | ASD (n = 12) | PH (n = 6) | P value |
|---|
| aP < 0.05 vs. control group and ASD group; bP < 0.05 vs. control group; cP < 0.0001 vs. control group and ASD group; dP < 0.001 vs. control group. BSA: body surface area; HR: heart rate; LVEDD: left ventricular end-diastolic dimension; LVFS: left ventricular fractional shortening; LVEF: left ventricular ejection fraction; mPAP: mean pulmonary arterial pressure; Qp/Qs: pulmonary-to-systemic blood flow ratio; RVEDV: right ventricular end-diastolic volume; RVEDP: right ventricular end-diastolic pressure; RVEF: right ventricular ejection fraction; RVFAC: right ventricular fractional area change; RVSP: right ventricular systolic pressure; TAPSE: tricuspid annular plane systolic excursion; ASD: atrial septal defect; PH: pulmonary hypertension. |
| Physical data | | | | |
| Sex (male/female) | 19/16 | 5/7 | 4/2 | 0.5796 |
| Age (years) | 7.3 ± 1.6 | 6.2 ± 1.5 | 6.8 ± 2.3 | 0.1458 |
| Weight (kg) | 24.1 ± 7.2 | 21.0 ± 10.8 | 22.3 ± 15.3 | 0.5854 |
| Height (cm) | 122.1 ± 10.3 | 119.2 ± 12.3 | 120.9 ± 17.1 | 0.7546 |
| BSA (m2) | 0.92 ± 0.12 | 0.84 ± 0.25 | 0.87 ± 0.19 | 0.3283 |
| HR (beats/min) | 75 ± 13 | 74 ± 13 | 84 ± 15 | 0.2735 |
| Systolic blood pressure (mm Hg) | 88 ± 6 | 84 ± 7 | 85 ± 10 | 0.1743 |
| Diastolic blood pressure (mm Hg) | 47 ± 6 | 48 ± 8 | 44 ± 11 | 0.5291 |
| QRS duration (ms) | 88 ± 5 | 93 ± 12 | 92 ± 18 | 0.2079 |
| Echocardiographic data | | | | |
| LVEDD (mm) | 35.8 ± 3.0 | 34.9 ± 4.9 | 30.2 ± 6.0a | 0.0078 |
| LVFS (%) | 39.8 ± 5.6 | 37.3 ± 5.5 | 31.8 ± 7.7b | 0.0098 |
| LVEF (%) | 66.5 ± 5.3 | 63.6 ± 10.3 | 52.3 ± 8.1c | < 0.0001 |
| RVFAC (%) | 50.5 ± 5.3 | 46.5 ± 9.3 | 23.5 ± 8.3c | < 0.0001 |
| TAPSE | 24.1 ± 7.2 | 26.1 ± 8.2 | 18.1 ± 5.2c | < 0.0001 |
| Transmitral flow (m/s) | | | | |
| E | 0.95 ± 0.14 | 0.83 ± 0.21 | 0.66 ± 0.18d | 0.0004 |
| A | 0.41 ± 0.07 | 0.48 ± 0.13 | 0.51 ± 0.18 | 0.0273 |
| Transtricuspid flow (m/s) | | | | |
| E | 0.71 ± 0.13 | 0.68 ± 0.22 | 0.48 ± 0.18a | 0.0079 |
| A | 0.33 ± 0.06 | 0.51 ± 0.12b | 0.66 ± 0.17c | < 0.0001 |
| Catheterization data | | | | |
| Qp/Qs | - | 2.31 ± 0.53 | - | - |
| RVEDV (% of normal) | - | 187 ± 37 | - | - |
| RVEDP (mm Hg) | - | 5.9 ± 2.4 | 9.9 ± 5.9 | - |
| RVEF (%) | - | 63 ± 18 | - | - |
| RVSP (mm Hg) | - | 24.5 ± 7.6 | 57.6 ± 19.6 | - |
| mPAP (mm Hg) | - | 12.6 ± 3.6 | 39.2 ± 14.7 | - |
| Treatment | | Furosemide 7 | Epoprostenol 2 | - |
| | Spironolactone 7 | Macitentan 3 | - |
| | | Tadalafil 3 | - |
| | | Furosemide 3 | - |
| | | Spironolactone 3 | - |
↓ Table 2. Vortex Flow Appearance Rate
| Control (n = 35) | ASD (n = 12) | PH (n = 6) | P value |
|---|
| CC: clockwise rotation; CCW: counter-clockwise rotation; RV: right ventricle; RVOT: right ventricular outflow tract; ASD: atrial septal defect; PH: pulmonary hypertension. |
| Early to mid-diastole | | | | |
| Anterior leaflet | 33 (94%) | 11 (92%) | 3 (50%) | 0.0262 |
| CW | 0 (0%) | 0 (0%) | 0 (0%) | |
| CCW | 33 (94%) | 11 (92%) | 3 (50%) | |
| Septal leaflet | 35 (100%) | 9 (75%) | 2 (33%) | < 0.0001 |
| CW | 35 (100%) | 9 (75%) | 2 (33%) | |
| CCW | 0 (0%) | 0 (0%) | 0 (0%) | |
| Late diastole | | | | |
| Apex to RVOT | 31 (91%) | 8 (67%) | 3 (50%) | 0.0433 |
| CW | 31 (91%) | 6 (37%) | 0 (0%) | |
| CCW | 0 (0%) | 2 (17%) | 3 (50%) | |
| Systole | | | | |
| Entire RV | 0 (0%) | 0 (0%) | 0 (0%) | > 0.9999 |
↓ Table 3. Correlation Between Energetic Parameters and Other Hemodynamic Variables
| Variables | RVFAC | TAPSE | Tricuspid E | Tricuspid A | Tricuspid E/A |
|---|
| r | P value | r | P value | r | P value | r | P value | r | P value |
|---|
| *Statistically significant. ELcycle: mean energy loss over one cardiac cycle; ELdia: mean diastolic energy loss; ELsys: mean systolic energy loss; EPI-RVin: energetic performance index in the right ventricular inflow tract; EPI-RVout: energetic performance index in the right ventricular outflow tract; KE-RVin: kinetic energy in the right ventricular inflow tract; KE-RVout: kinetic energy in the right ventricular outflow tract; RVFAC: right ventricular fractional area change; TAPSE: tricuspid annular plane systolic excursion. |
| ELsys | 0.24 | 0.161 | 0.14 | 0.361 | 0.11 | 0.321 | 0.08 | 0.634 | 0.16 | 0.832 |
| ELdia | -0.17 | 0.663 | -0.21 | 0.556 | 0.22 | 0.116 | 0.11 | 0.543 | -0.32* | 0.041 |
| ELcycle | 0.24 | 0.561 | 0.15 | 0.761 | 0.13 | 0.312 | -0.02 | 0.809 | -0.41* | 0.029 |
| KE-RVin | 0.31 | 0.062 | 0.26 | 0.072 | 0.46* | 0.012 | 0.11 | 0.797 | -0.21 | 0.356 |
| KE-Rvout | 0.39* | 0.021 | 0.38* | 0.031 | 0.16 | 0.398 | 0.05 | 0.351 | -0.15 | 0.65 |
| EPI-Rvin | 0.41* | 0.034 | 0.39* | 0.034 | 0.39* | 0.043 | 0.19 | 0.36 | 0.16 | 0.69 |
| EPI-Rvout | 0.46* | 0.022 | 0.43* | 0.019 | 0.23 | 0.321 | 0.13 | 0.75 | -0.19 | 0.054 |
↓ Table 4. Intra- and Inter-Observer Reproducibility
| Intra-observer variation | Inter-observer variation |
|---|
| ICC (95% CI) | P value | Bland-Altman bias (95% LOA) | ICC (95% CI) | P value | Bland-Altman bias (95% LOA) |
|---|
| Data are shown as mean with range in parentheses. CI: confidence interval; ICC: intraclass correlation coefficient; LOA: limits of agreement defined as the mean difference ± 1.96 SD of the difference. ELcycle: mean energy loss over one cardiac cycle; ELdia: mean diastolic energy loss; ELsys: mean systolic energy loss; EPI-RVin: energetic performance index in the right ventricular inflow tract; EPI-RVout: energetic performance index in the right ventricular outflow tract; KE-RVin: kinetic energy in the right ventricular inflow tract; KE-RVout: kinetic energy in the right ventricular outflow tract; SD: standard deviation. |
| ELsys | 0.866 (0.558 - 0.992) | 0.0012 | 0.285 (-1.21 to 1.78) | 0.875 (0.612 - 0.977) | 0.0011 | 0.680 (-2.61 to 3.97) |
| ELdia | 0.962 (0.843 - 0.991) | < 0.0001 | 0.154 (-1.91 to 2.21) | 0.99 (0.721 - 0.983) | 0.0001 | -0.161 (-2.94 to 2.62) |
| ELcycle | 0.917 (0.571 - 0.969) | 0.0011 | 0.612 (-1.70 to 2.90) | 0.895 (0.607 - 0.975) | 0.0005 | 0.265 (-1.25 to 1.78) |
| KE-RVin | 0.976 (0.857 - 0.993) | < 0.0001 | -0.175 (-2.95 to 2.60) | 0.946 (0.782 - 0.987) | < 0.0001 | 0.281 (-2.21 to 2.77) |
| KE-RVout | 0.962 (0.843 - 0.991) | < 0.0001 | -0.452 (-2.50 to 1.60) | 0.944 (0.721 - 0.975) | < 0.0001 | 0.221 (-2.21 to 1.77) |
| EPI-RVin | 0.919 (0.590 - 0.969) | 0.0114 | 0.049 (-2.50 to 2.60) | 0.895 (0.607 - 0.975) | 0.0015 | -0.223 (-2.21 to 1.77) |
| EPI-RVout | 0.899 (0.592 - 0.959) | 0.0012 | -0.309 (-2.90 to 2.28) | 0.899 (0.617 - 0.979) | 0.0005 | -0.182 (-2.26 to 1.79) |