Cardiology Research, ISSN 1923-2829 print, 1923-2837 online, Open Access |
Article copyright, the authors; Journal compilation copyright, Cardiol Res and Elmer Press Inc |
Journal website https://cr.elmerpub.com |
Original Article
Volume 16, Number 1, February 2025, pages 44-52
Relationship Between Advanced Glycation End Products Tissue Accumulation and Frailty in Patients Undergoing Cardiac Rehabilitation
Figures
Tables
Total (n = 806) | Low SAF (n = 368) | High SAF (n = 438) | P value | |
---|---|---|---|---|
High SAF is defined as SAF levels ≥ 2.9. Frailty (1 - 20) is defined as ≥ 6 points of sub-total score of KCL. Frailty (1 - 25) is defined as ≥ 8 points of total score of KCL. Prefrailty (1 - 25) is defined as 4 - 7 points of total score of KCL. Data are shown as n (%), median (interquartile range), or mean value ± standard deviation. BMI: body mass index; CVD: cardiovascular disease; CR: cardiac rehabilitation; CHF: chronic heart failure; AMI: acute myocardial infarction; AP: angina pectoris; LVEF: left ventricle ejection fraction; eGFR: estimated glomerular filtration rate; TG: triglyceride; HDL-C: high-density lipoprotein cholesterol; LDL-C: low-density lipoprotein cholesterol; HbA1c: hemoglobin A1c; BNP: brain natriuretic peptide; SAF: skin autofluorescence; ACE-I: angiotensin converting enzyme inhibitor; ARB: angiotensin II receptor blocker; KCL: Kihon Checklist. | ||||
Basic characteristics | ||||
Age, years | 67.0 ± 12.9 | 62.4 ± 13.7 | 70.9 ± 10.6 | < 0.01 |
Male, n (%) | 570 (70.7) | 254 (69.0) | 316 (72.2) | 0.33 |
BMI, kg/m2 | 22.9 ± 3.8 | 22.7 ± 3.8 | 23.1 ± 3.7 | 0.10 |
Diabetes mellitus, n (%) | 263 (32.6) | 89 (24.2) | 174 (39.7) | < 0.01 |
Hypertension, n (%) | 505 (62.6) | 218 (59.2) | 287 (65.5) | 0.07 |
Dyslipidemia, n (%) | 400 (49.6) | 172 (46.7) | 228 (52.1) | 0.13 |
Chronic kidney disease, n (%) | 271 (33.6) | 94 (25.6) | 177 (40.4) | < 0.01 |
Atrial fibrillation, n (%) | 141 (17.5) | 81 (18.5) | 60 (16.3) | 0.42 |
Cancer, n (%) | 104 (12.9) | 43 (11.7) | 61 (13.9) | 0.34 |
Current smoking, n (%) | 82 (10.2) | 38 (10.4) | 44 (10.1) | 0.05 |
CVD at beginning of CR | ||||
CHF, n (%) | 208 (25.8) | 91 (24.7) | 117 (26.7) | 0.50 |
AMI, n (%) | 55 (6.8) | 24 (6.5) | 31 (7.1) | 0.75 |
AP, n (%) | 30 (3.7) | 11 (3.0) | 19 (4.3) | 0.31 |
Post open-heart surgery, n (%) | 444 (55.1) | 204 (55.5) | 240 (54.8) | 0.86 |
Aortic disease, n (%) | 61 (7.7) | 36 (9.8) | 25 (5.7) | 0.03 |
Peripheral artery disease, n (%) | 8 (0.9) | 2 (0.5) | 6 (1.4) | 0.23 |
Anthropometric data | ||||
Body fat percentage, % | 22.7 ± 8.8 | 21.9 ± 8.6 | 23.4 ± 9.0 | 0.03 |
Lean body mass, kg | 46.6 ± 9.6 | 47.1 ± 10.2 | 46.1 ± 9.1 | 0.13 |
Grip strength, kg | 28.9 ± 9.0 | 29.8 ± 9.5 | 28.1 ± 8.4 | 0.06 |
Cardiac function indicator | ||||
LVEF, % | 63 (52 - 70) | 63 (53 - 70) | 63 (52 - 69) | 0.56 |
Laboratory data | ||||
Hemoglobin, g/dL | 13.0 ± 1.9 | 13.4 ± 1.9 | 12.7 ± 1.9 | < 0.01 |
Albumin, g/dL | 3.9 ± 0.5 | 3.9 ± 0.5 | 3.8 ± 0.5 | < 0.01 |
Creatinine, mg/dL | 0.8 (0.7 - 1.0) | 0.8 (0.6 - 0.9) | 0.9 (0.7 - 1.1) | < 0.01 |
eGFR, mL/min/1.73m2 | 69.1 ± 26.9 | 75.3 ± 23.9 | 64.0 ± 28.2 | < 0.01 |
TG, mg/dL | 102 (74 - 139) | 103 (73 - 145) | 100 (76 - 132) | 0.32 |
HDL-C, mg/dL | 49.4 ± 15.5 | 49.5 ± 15.4 | 49.3 ± 15.6 | 0.85 |
LDL-C, mg/dL | 99.9 ± 30.9 | 101.7 ± 31.9 | 98.4 ± 30.1 | 0.13 |
HbA1c, % | 6.0 ± 0.9 | 5.9 ± 0.8 | 6.1 ± 1.0 | < 0.01 |
BNP, pg/mL | 88.2 (34.1 - 227.7) | 71.6 (27.7 - 177.2) | 100.1 (42.2 - 286.0) | < 0.01 |
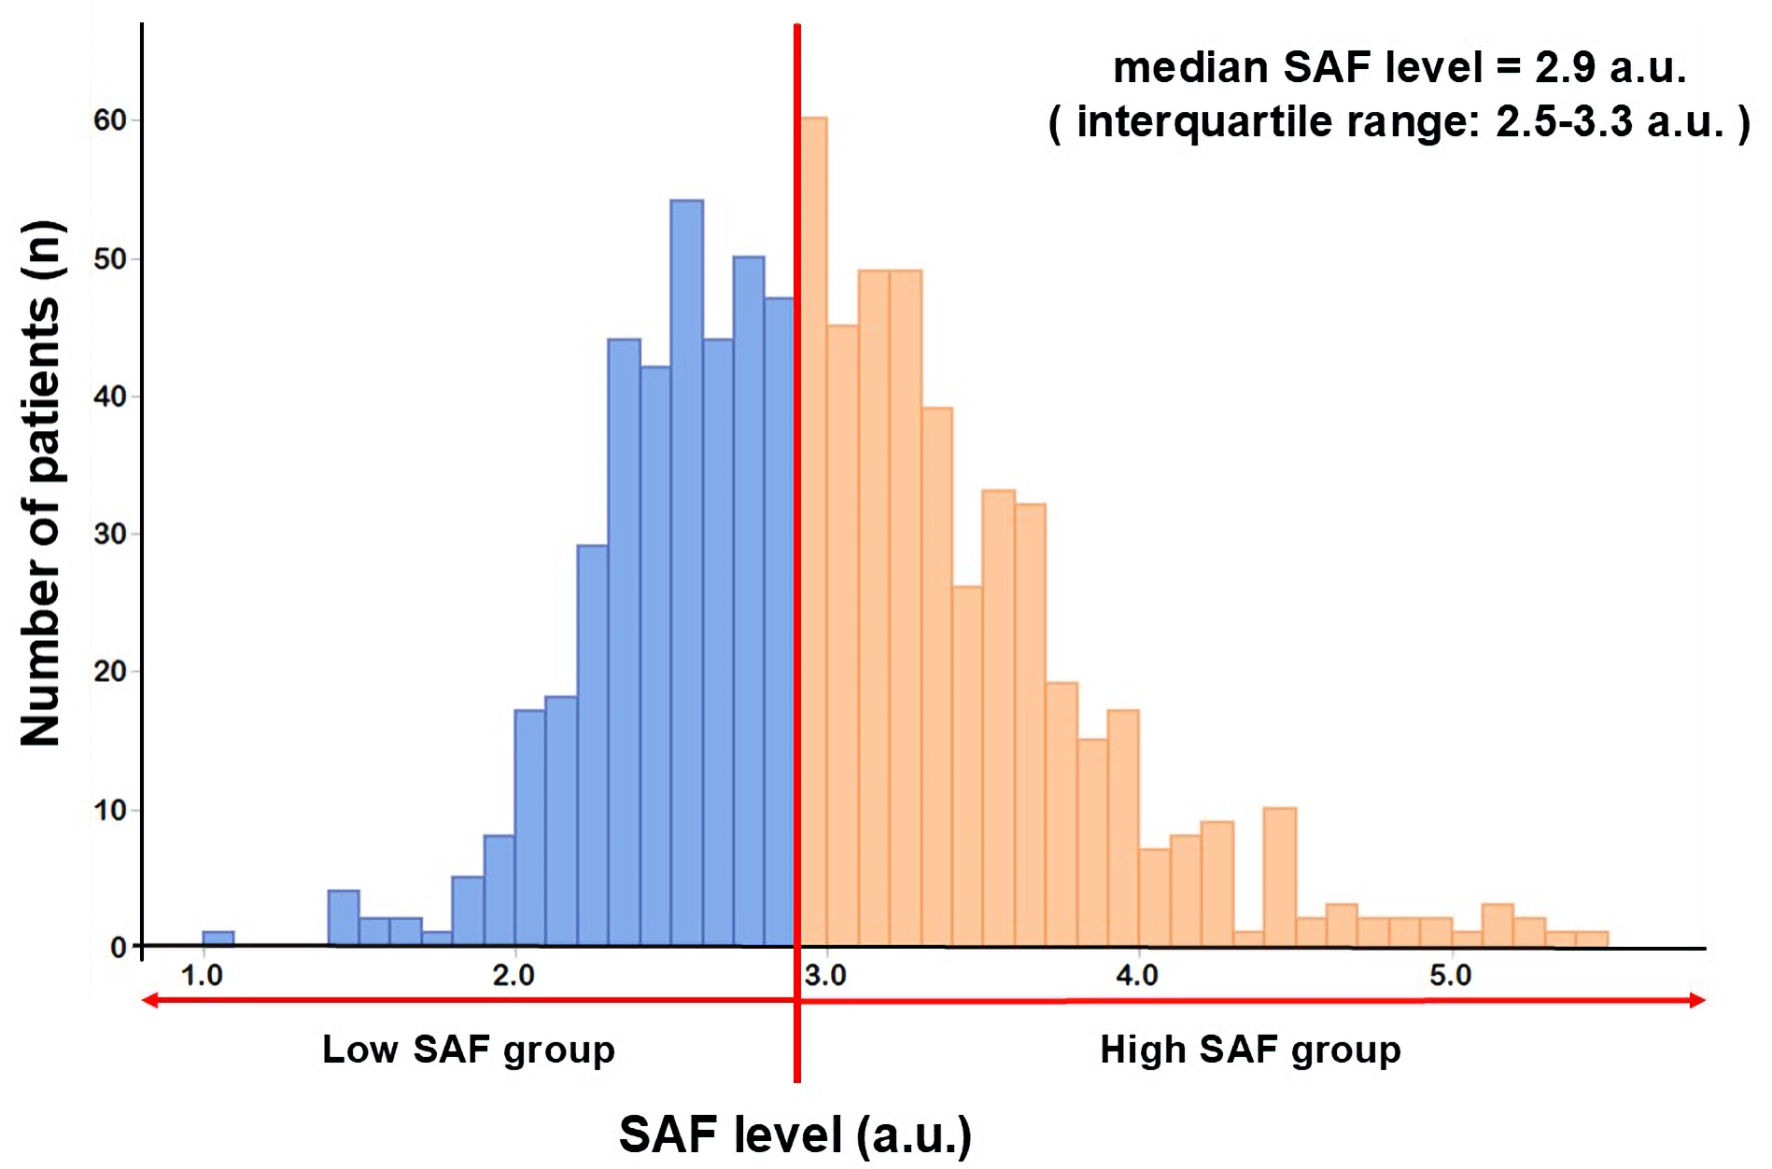
SAF, a.u. | 3.0 ± 0.6 | 2.4 ± 0.3 | 3.4 ± 0.5 | < 0.01 |
Medication | ||||
Aspirin, n (%) | 645 (80.2) | 293 (79.8) | 352 (80.6) | 0.80 |
ACE-I/ARB, n (%) | 267 (33.2) | 115 (31.3) | 152 (34.8) | 0.30 |
β-blocker, n (%) | 579 (72.0) | 254 (69.2) | 325 (74.4) | 0.10 |
Calcium antagonist, n (%) | 153 (19.0) | 63 (17.2) | 90 (20.6) | 0.22 |
Loop diuretics, n (%) | 601 (74.8) | 277 (75.5) | 324 (74.1) | 0.66 |
Statin, n (%) | 425 (52.9) | 168 (45.8) | 257 (58.8) | < 0.01 |
Oral hypoglycemic agent, n (%) | 129 (16.0) | 34 (9.3) | 95 (21.7) | < 0.01 |
Insulin, n (%) | 51 (6.3) | 6 (1.6) | 45 (10.3) | < 0.01 |
Frailty | ||||
Sub-total KCL score (1 - 20) | 4.4 ± 3.3 | 4.2 ± 3.2 | 4.6 ± 3.3 | 0.05 |
Frailty (1 - 20), n (%) | 260 (32.3) | 108 (29.3) | 152 (34.7) | 0.11 |
Total KCL score (1 - 25) | 5.9 ± 4.2 | 5.5 ± 4.1 | 6.2 ± 4.3 | 0.02 |
Frailty (1 - 25), n (%) | 260 (32.3) | 109 (29.6) | 151 (34.5) | 0.14 |
Prefrailty + frailty (1 - 25), n (%) | 525 (65.1) | 235 (63.9) | 290 (66.2) | 0.49 |
Total (n = 806) | Low SAF (n = 368) | High SAF (n = 438) | ||||
---|---|---|---|---|---|---|
r | P value | r | P value | r | P value | |
High SAF is defined as SAF levels ≥ 2.9. Frailty (1 - 20) is defined as ≥ 6 points of sub-total score of KCL. Frailty (1 - 25) is defined as ≥ 8 points of total score of KCL. Prefrailty (1 - 25) is defined as 4 - 7 points of total score of KCL. BMI: body mass index; LVEF: left ventricle ejection fraction; eGFR: estimated glomerular filtration rate; TG: triglyceride; HDL-C: high-density lipoprotein cholesterol; LDL-C: low-density lipoprotein cholesterol; HbA1c: hemoglobin A1c; BNP: brain natriuretic peptide; KCL: Kihon Checklist. | ||||||
Basic characteristics | ||||||
Age | 0.34 | < 0.01 | 0.21 | < 0.01 | 0.10 | 0.04 |
Male | -0.07 | 0.04 | -0.05 | 0.39 | -0.09 | 0.06 |
BMI | 0.08 | 0.02 | 0.03 | 0.57 | 0.08 | 0.10 |
Anthropometric data | ||||||
Body fat percentage | 0.07 | 0.05 | -0.01 | 0.90 | 0.03 | 0.56 |
Lean body mass | -0.02 | 0.60 | 0.03 | 0.56 | -0.04 | 0.41 |
Grip strength | -0.10 | 0.06 | 0.03 | 0.66 | 0.09 | 0.23 |
Cardiac function indicator | ||||||
LVEF | -0.03 | 0.35 | 0.03 | 0.63 | -0.06 | 0.25 |
Laboratory data | ||||||
Hemoglobin | -0.21 | < 0.01 | -0.04 | 0.49 | -0.57 | < 0.01 |
Albumin | -0.20 | < 0.01 | -0.16 | < 0.01 | -0.15 | < 0.01 |
Creatinine | 0.32 | < 0.01 | 0.06 | 0.27 | 0.36 | < 0.01 |
eGFR | -0.33 | < 0.01 | -0.12 | 0.02 | -0.34 | < 0.01 |
TG | -0.01 | 0.74 | -0.02 | 0.76 | 0.05 | 0.30 |
HDL-C | -0.09 | 0.01 | -0.03 | 0.59 | -0.20 | < 0.01 |
LDL-C | -0.09 | 0.01 | < 0.01 | 0.94 | -0.11 | 0.02 |
HbA1c | 0.21 | < 0.01 | 0.07 | 0.17 | 0.14 | < 0.01 |
BNP | 0.25 | < 0.01 | 0.06 | 0.23 | 0.30 | < 0.01 |
Frailty | ||||||
Sub-total KCL score (1 - 20) | 0.14 | < 0.01 | 0.04 | 0.41 | 0.20 | < 0.01 |
Frailty (1 - 20) | 0.12 | < 0.01 | 0.03 | 0.51 | 0.17 | < 0.01 |
Total KCL score (1 - 25) | 0.14 | < 0.01 | 0.03 | 0.54 | 0.16 | < 0.01 |
Frailty (1 - 25) | 0.10 | < 0.01 | 0.05 | 0.36 | 0.12 | 0.01 |
Prefrailty + frailty (1 - 25) | 0.07 | 0.04 | 0.02 | 0.67 | 0.12 | 0.01 |
β | P value | β | P value | β | P value | |
---|---|---|---|---|---|---|
SAF: skin autofluorescence; BMI: body mass index; HbA1c: hemoglobin A1c; BNP: brain natriuretic peptide; KCL: Kihon Checklist. | ||||||
Multivariate analysis for all SAF group | ||||||
Age | 0.54 | < 0.01 | 0.06 | < 0.01 | 0.06 | < 0.01 |
BMI | 0.19 | 0.01 | 0.07 | 0.01 | 0.07 | < 0.01 |
Creatinine | 0.80 | < 0.01 | 0.12 | < 0.01 | 0.12 | < 0.01 |
HbA1c | 0.45 | < 0.01 | 0.10 | < 0.01 | 0.10 | < 0.01 |
BNP | 0.51 | < 0.01 | 0.17 | < 0.01 | 0.17 | < 0.01 |
Sub-total KCL score (1 - 20) | 0.06 | 0.29 | ||||
Total KCL score (1 - 25) | 0.06 | 0.26 | ||||
Adjusted R2 | 0.24 | 0.24 | 0.24 | |||
Multivariate analysis for low SAF group | ||||||
Age | 0.16 | < 0.01 | 0.16 | < 0.01 | 0.16 | < 0.01 |
Sub-total KCL score (1 - 20) | < 0.01 | 0.97 | ||||
Total KCL score (1 - 25) | < 0.01 | 0.95 | ||||
Adjusted R2 | 0.04 | 0.04 | 0.04 | |||
Multivariate analysis for high SAF group | ||||||
Creatinine | 0.57 | < 0.01 | 0.56 | < 0.01 | 0.56 | < 0.01 |
HbA1c | 0.36 | < 0.01 | 0.35 | < 0.01 | 0.35 | < 0.01 |
BNP | 0.52 | < 0.01 | 0.48 | < 0.01 | 0.50 | < 0.01 |
Sub-total KCL score (1 - 20) | 0.15 | 0.01 | ||||
Total KCL score (1 - 25) | 0.11 | 0.07 | ||||
Adjusted R2 | 0.18 | 0.19 | 0.18 |