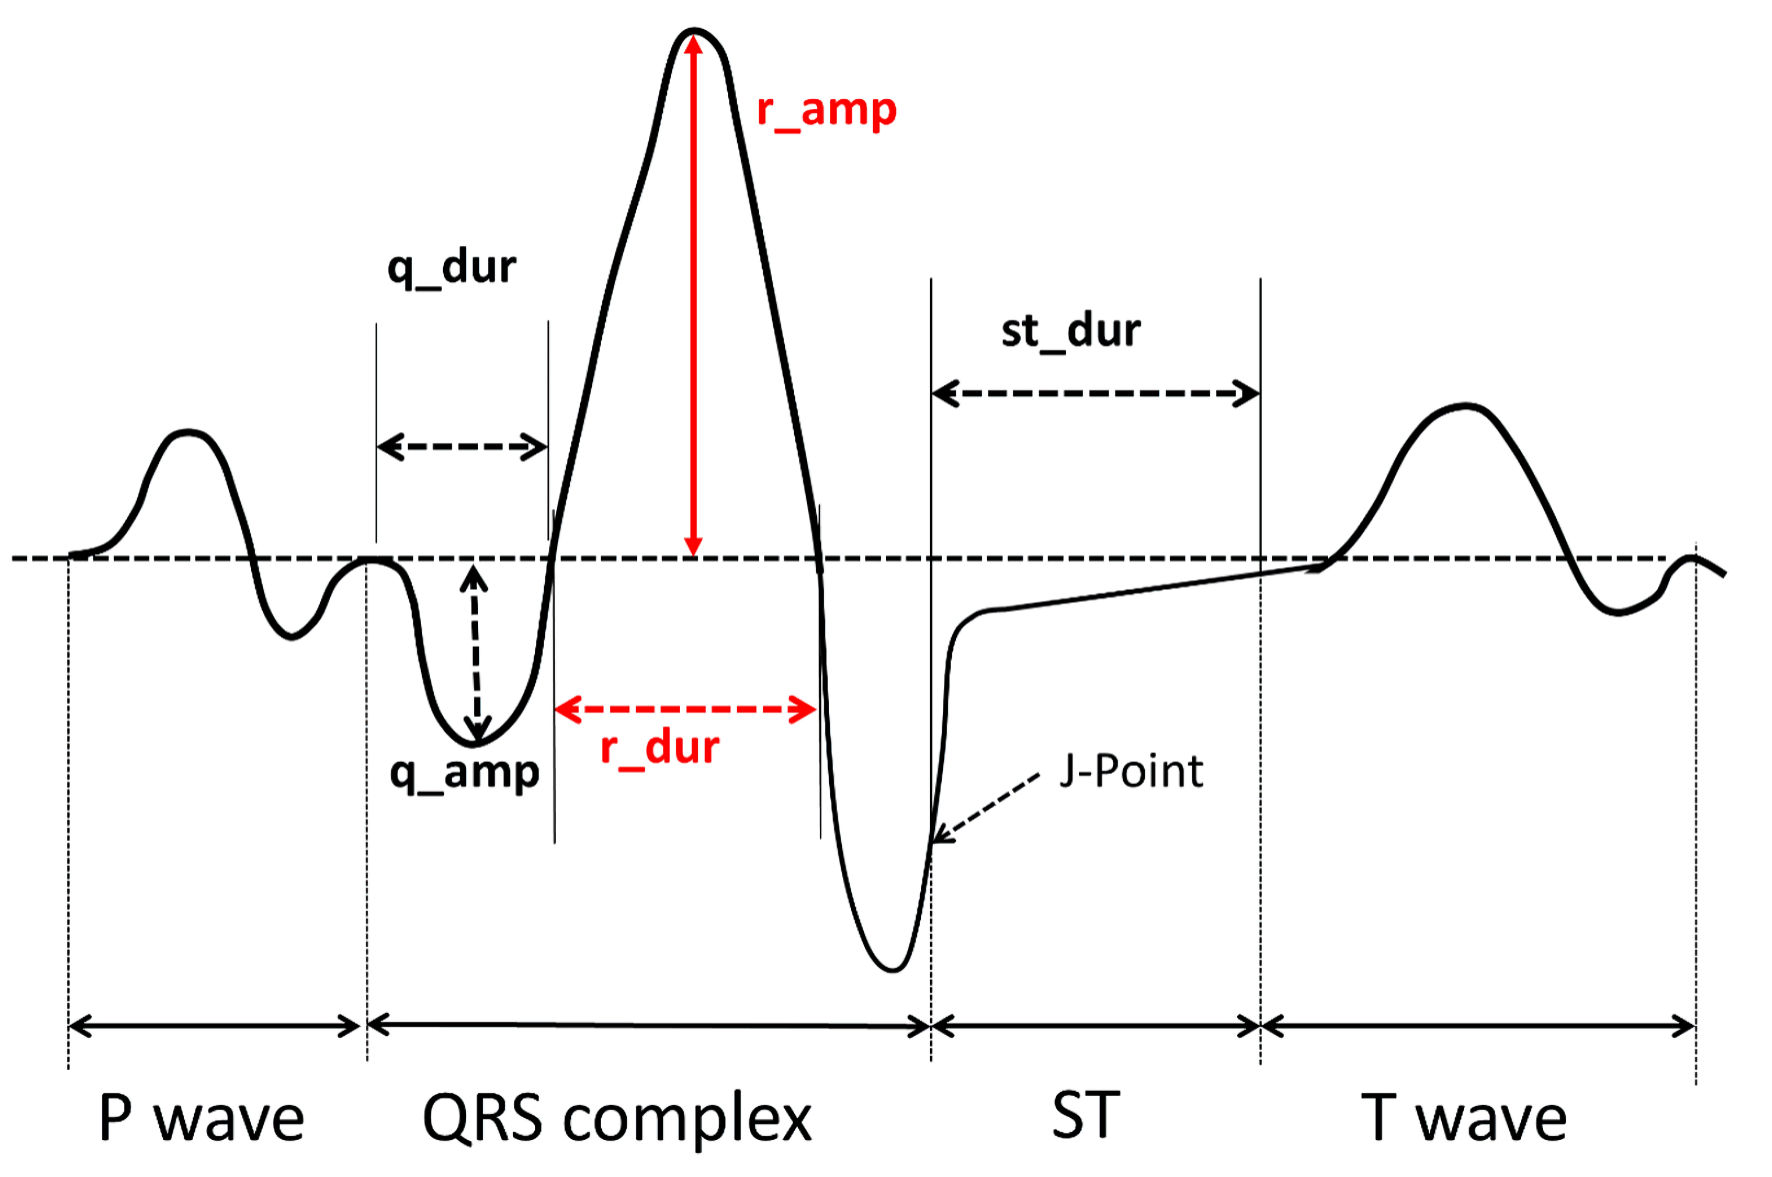
↓ Figure 1. Graphic example of some of the relevant ECG variables quantified by the Philips algorithm. ECG: electrocardiogram.
| Cardiology Research, ISSN 1923-2829 print, 1923-2837 online, Open Access |
| Article copyright, the authors; Journal compilation copyright, Cardiol Res and Elmer Press Inc |
| Journal website https://cr.elmerpub.com |
Original Article
Volume 16, Number 2, April 2025, pages 120-129
Computer-Assisted Electrocardiogram Analysis Improves Risk Assessment of Underlying Atrial Fibrillation in Cryptogenic Stroke
Figures
Tables
| All patients (n = 67) | No AF (n = 46) | AF (n = 21) | P value | |
|---|---|---|---|---|
| Quantitative variables are displayed as median (1Q; 3Q). BMI: body mass index; CAD: coronary artery disease; TNT: troponin T; NT-proBNP: N-terminal B-type natriuretic peptide; LADV: left atrium diastolic volume; iLADV: indexed LADV; LASV: left atrium systolic volume; LASr: left atrial reservoir strain; LAEF: left atrial ejection fraction; LVEF: left ventricular ejection fraction (calculated by Simpson biplane method); RBBB: right bundle branch block; LBBB: left bundle branch block; TIA: transitory ischemic attack. | ||||
| Age (years) | 80.0 (73.0; 84.0) | 78.5 (71.0; 82.8) | 83.0 (78.0; 86.0) | 0.010 |
| BMI (kg/m2) | 25.7 (23.6; 28.0) | 25.9 (23.6; 28.5) | 24.8 (23.3; 26.8) | 0.154 |
| Sex | 0.780 | |||
| Female | 35 (52.2%) | 23 (50.0%) | 12 (57.1%) | |
| Hypertension | 39 (58.2%) | 22 (47.8%) | 17 (81.0%) | 0.022 |
| Diabetes mellitus | 16 (23.9%) | 11 (23.9%) | 5 (23.8%) | 1.000 |
| Dyslipidemia | 39 (58.2%) | 28 (60.9%) | 11 (52.4%) | 0.699 |
| Tobacco | 0.674 | |||
| Never | 51 (76.1%) | 34 (73.9%) | 17 (81.0%) | |
| Current | 7 (10.4%) | 6 (13.0%) | 1 (4.76%) | |
| Former | 9 (13.4%) | 6 (13.0%) | 3 (14.3%) | |
| CAD | 10 (14.9%) | 6 (13.0%) | 4 (19.0%) | 0.713 |
| TNT (ng/L) | 14.0 (10.1; 24.1) | 12.9 (9.87; 21.7) | 17.1 (12.0; 29.0) | 0.036 |
| NT-proBNP (pg/mL) | 245 (113; 463) | 152 (66.0; 372) | 420 (305; 1704) | < 0.001 |
| LADV (mL) | 51.0 (39.0; 68.2) | 47.8 (36.8; 55.8) | 65.0 (47.0; 77.0) | 0.014 |
| iLADV (mL/m2) | 29.5 (22.8; 40.0) | 27.5 (21.2; 33.8) | 37.8 (27.7; 42.0) | 0.014 |
| LASV (mL) | 25.0 (18.0; 37.0) | 20.9 (16.2; 29.8) | 33.0 (22.0; 38.0) | 0.020 |
| LASr (%) | 27.1 (18.5; 34.1) | 31.1 (26.9; 37.6) | 16.9 (13.9; 21.8) | < 0.001 |
| LAEF (%) | 51.6 (37.2; 59.7) | 52.6 (38.5; 64.0) | 45.9 (37.0; 53.3) | 0.105 |
| Septal thickness (mm) | 11.0 (10.0; 12.0) | 11.0 (10.0; 12.0) | 11.0 (10.0; 12.0) | 0.606 |
| LVEF (%) | 63.0 (59.5; 73.0) | 63.0 (59.0; 68.6) | 66.0 (60.0; 75.0) | 0.276 |
| LVEDV (mL) | 66.0 (51.0; 86.0) | 69.5 (54.0; 87.0) | 61.0 (46.0; 70.0) | 0.229 |
| LVESV (mL) | 20.0 (15.5; 31.0) | 22.5 (16.0; 33.0) | 19.0 (15.0; 26.0) | 0.433 |
| Interatrial block | 0.42 | |||
| Type 1 | 4 (5.97%) | 2 (4.35%) | 2 (9.52%) | |
| Type 2 | 6 (8.95%) | 5 (10.9%) | 1 (4.76%) | |
| PR (ms) | 177 (160; 190) | 172 (160; 190) | 180 (160; 190) | 0.533 |
| QRS morphology | 0.258 | |||
| RBBB | 4 (5.97%) | 2 (4.35%) | 2 (9.52%) | |
| LBBB | 5 (7.46%) | 5 (10.9%) | 0 (0.00%) | |
| QRS (ms) | 100 (90.0; 110) | 100 (90.0; 110) | 98.0 (95.0; 110) | 0.635 |
| QTc (ms) | 442 (430; 455) | 440 (429; 457) | 445 (440; 450) | 0.583 |
| TIA | 17 (25.4%) | 13 (28.3%) | 4 (19.0%) | 0.616 |
| Variable (range) | OR | CI (2.5% - 97.5%) | P value |
|---|---|---|---|
| OR: odds ratio; CI: confidence interval; NT-proBNP: N-terminal B-type natriuretic peptide; LASr: left atrial reservoir strain. | |||
| Age (> 76 years) | 4.69 | 0.59 - 51.50 | 0.163 |
| NT-proBNP (> 203.5 pg/mL) | 8.21 | 1.56 - 58.55 | 0.020 |
| LASr (≤ 23.3%) | 36.07 | 7.26 - 301.83 | < 0.001 |
| Variable (range) | OR | CI (2.5% - 97.5%) | P value |
|---|---|---|---|
| ECG: electrocardiogram; NT-proBNP: N-terminal B-type natriuretic peptide; LASr: left atrial reservoir strain; V1_ramp: amplitude of the R wave in lead V1. | |||
| Age (> 76 years) | 12.51 | 0.47 - 845.03 | 0.17 |
| NT-proBNP (> 203.5 pg/mL) | 23.61 | 2.65 - 665.99 | 0.016 |
| LASr (≤ 23.3%) | 145.91 | 13.94 - 6,223.62 | < 0.001 |
| V1_ramp (> 137 µV) | 33.04 | 3.38 - 1,167.86 | 0.013 |