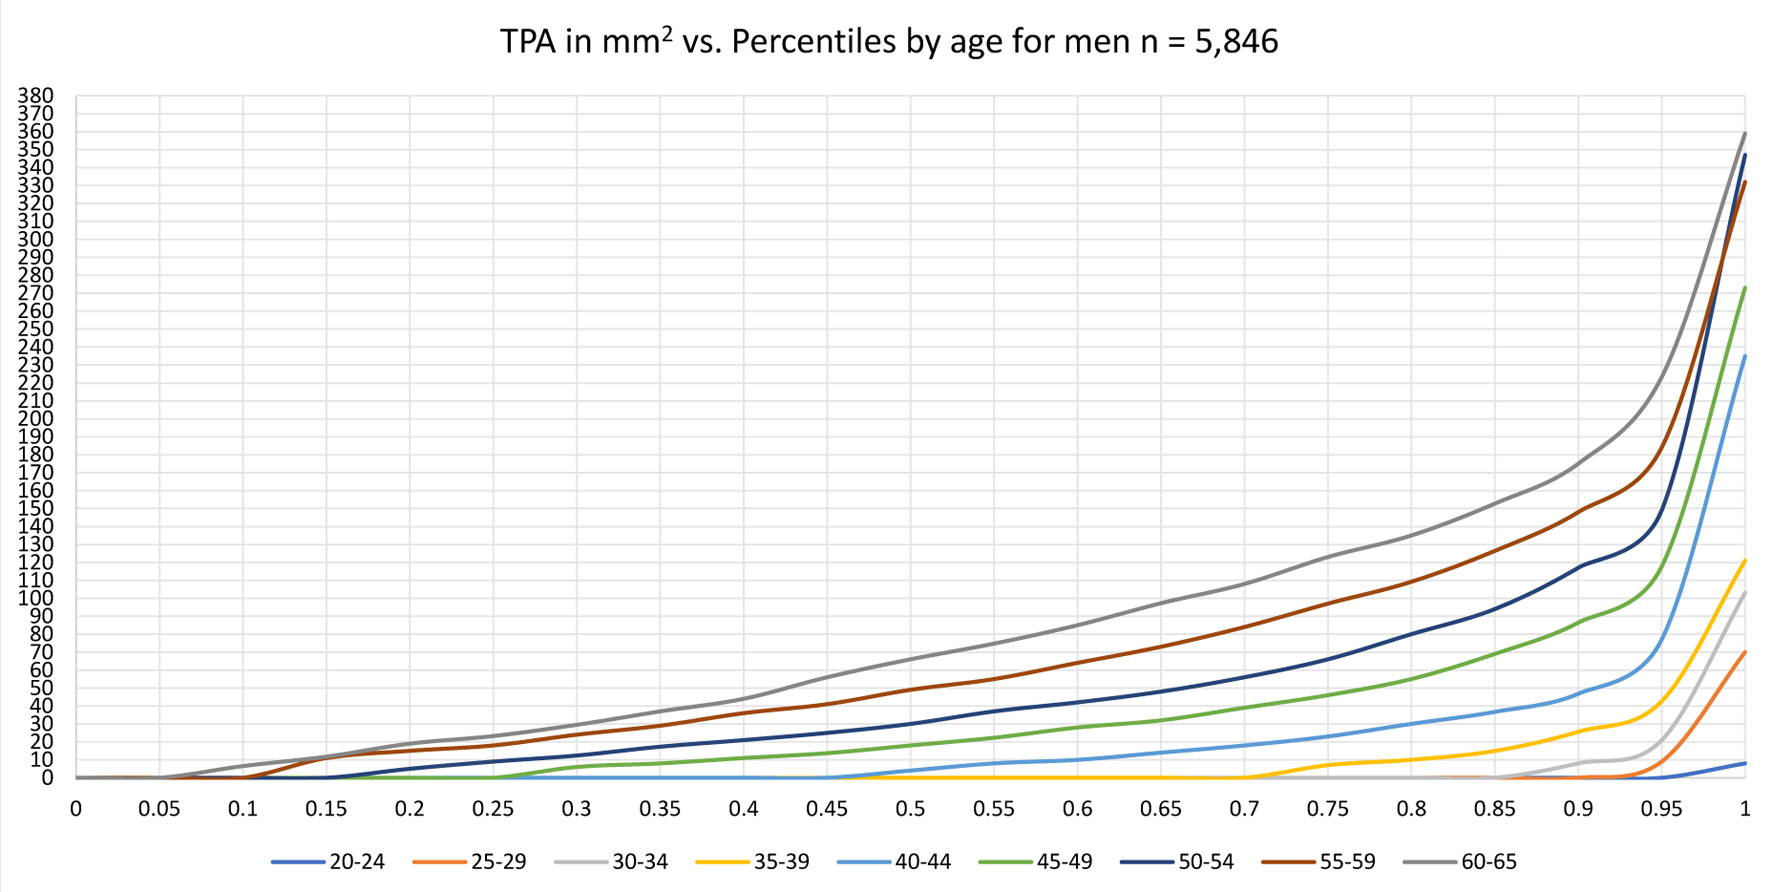
↓ Figure 1. TPA percentiles by age for men. TPA: total plaque area.
| Cardiology Research, ISSN 1923-2829 print, 1923-2837 online, Open Access |
| Article copyright, the authors; Journal compilation copyright, Cardiol Res and Elmer Press Inc |
| Journal website https://cr.elmerpub.com |
Original Article
Volume 16, Number 3, June 2025, pages 202-211
Progression of Atherosclerosis and Hypothesis on the Relationship Between Microvascular Dysfunction, Cardiovascular Risk, and Cancer
Figures
Tables
| Characteristics | Male, type I, IIa, IIb, IVa | Male, type III, IVb | P value | Female, type I, IIa, IIb, IVa | Female type, III, IVb | P value |
|---|---|---|---|---|---|---|
| The mean values with the standard deviations or the percentages are shown. BMI: body mass index; CABG: coronary artery bypass grafting; CVD: cardiovascular disease; DBP: diastolic blood pressure; HDL: high-density lipoprotein; LDL: low-density lipoprotein; MACE: major adverse cardiovascular event; PROCAM: Prospective Cardiovascular Munster Study; PTCA: percutaneous transluminal coronary angioplasty; SBP: systolic blood pressure; TPA: total plaque area. | ||||||
| N | 2,052 | 540 | 1,761 | 167 | ||
| Age | 50 ± 7 | 54 ± 6 | < 0.0001 | 50 ± 7 | 55 ± 6 | < 0.0001 |
| BMI, kg/m2 | 27.47 ± 4.08 | 27.94 ± 4.20 | 0.002 | 25.40 ± 4.68 | 26.02 ± 4.72 | 0.101 |
| Current smoker | 458 (22.3%) | 238 (43.5%) | < 0.0001 | 339 (19.3%) | 79 (47.3%) | < 0.0001 |
| LDL-cholesterol, mg/dL | 150 ± 33 | 159 ± 40 | < 0.0001 | 143 ± 33 | 160 ± 40 | 0.002 |
| HDL-cholesterol, mg/dL | 51 ± 12 | 48 ± 11 | 0.001 | 65 ± 15 | 63 ± 14 | 0.116 |
| Triglycerides, mg/dL | 170 ± 117 | 188 ± 123 | 0.001 | 112 ± 58 | 143 ± 71 | 0.005 |
| SBP, mm Hg | 126 ± 15 | 135 ± 19 | < 0.0001 | 122 ± 16 | 131 ± 19 | 0.0002 |
| DBP, mm Hg | 82 ± 8 | 84 ± 10 | < 0.0001 | 78 ± 9 | 86 ± 12 | 0.143 |
| Diabetes mellitus | 76 (3.7%) | 47 (8.6%) | < 0.0001 | 25 (1.4%) | 11 (6.6%) | 0.009 |
| Antihypertensive therapy | 440 (21.4%) | 206 (37.7%) | < 0.0001 | 318 (18.1%) | 80 (47.9%) | < 0.0001 |
| Positive family history | 450 (21.9%) | 159 (29.1%) | 0.034 | 485 (27.5%) | 65 (38.9%) | < 0.0001 |
| PROCAM risk | 6.5±6.5% | 14.4±11.1% | < 0.0001 | 1.5±2.4% | 5.1±5.4% | < 0.0001 |
| TPA, mm2 | 32 ± 33 | 150 ± 64 | < 0.0001 | 16 ± 24 | 123 ± 63 | < 0.0001 |
| Max. plaque thickness, mm | 1.7 ± 0.5 | 2.9 ± 0.8 | < 0.0001 | 1.6 ± 0.4 | 3.1 ± 0.6 | < 0.0001 |
| Event (MACE, CABG, PTCA, stenosis) | 60 (2.9%) | 128 (23.4%) | < 0.0001 | 4 (0.2%) | 13 (7.8%) | < 0.0001 |
| Carcinoma | 21 (1.0%) | 34 (6.2%) | < 0.0001 | 12 (0.7%) | 3 (1.8%) | 0.289 |
| Follow-up, months (min. - max.) | 73 (3 - 156) | 74 (3 - 145) | 0.032 | 74 (2 - 155) | 75 (2 - 139) | 0.836 |
| Death of all causes | 14 (0.7%) | 42 (7.7%) | < 0.0001 | 6 (0.3%) | 0 | < 0.0001 |
| Death of CVD | 5 (0.2%) | 17 (3.1%) | 0.0004 | 2 (0.1%) | 0 | < 0.0001 |
| Death of carcinoma | 4 (0.2%) | 20 (4.4%) | < 0.0001 | 1 (0.06%) | 0 | < 0.0001 |
| Men, type I, IIa, IIb, IVa | Progression in type III, IVb | P value (t-test) | |
|---|---|---|---|
| The mean values with the standard deviations or the percentages are shown. BMI: body mass index; DBP: diastolic blood pressure; HDL: high-density lipoprotein; LDL: low-density lipoprotein; PROCAM: Prospective Cardiovascular Munster Study; SBP: systolic blood pressure; TPA: total plaque area. | |||
| N | 1,913 | 139 | |
| Age | 50 ± 6 | 50 ± 5 | 0.5042 |
| BMI, kg/m2 | 27.47 ± 4.08 | 27.80 ± 4.48 | 0.4030 |
| Current smoker | 423 (22.1%) | 40 (28.8%) | 0.0954 |
| LDL-cholesterol, mg/dL | 150 ± 33 | 153 ± 32 | 0.2661 |
| HDL-cholesterol, mg/dL | 51 ± 11 | 52 ± 13 | 0.4186 |
| Triglycerides, mg/dL | 169 ± 116 | 174 ± 133 | 0.6990 |
| SBP, mm Hg | 127 ± 16 | 130 ± 17 | 0.0047 |
| DBP, mm Hg | 81 ± 8 | 83 ± 10 | 0.0763 |
| Diabetes mellitus | 67 (3.5%) | 9 (6.5%) | 0.1662 |
| Antihypertensive therapy | 409 (21.4%) | 34 (24.5%) | 0.4240 |
| Positive family history | 423 (22.1%) | 27 (19.4%) | 0.4436 |
| PROCAM risk | 6.5±6.4% | 8.1±7.5% | 0.0360 |
| TPA, mm2 | 30 ± 33 | 53 ± 30 | < 0.00001 |
| Max. plaque thickness, mm | 1.7 ± 0.5 | 1.79 ± 0.5 | 0.000017 |
| Women, type I, IIa, IIb, IVa | Progression in type III, IVb | P value (t-test) | |
|---|---|---|---|
| The mean values with the standard deviations or the percentages are shown. BMI: body mass index; DBP: diastolic blood pressure; HDL: high-density lipoprotein; LDL: low-density lipoprotein; PROCAM: Prospective Cardiovascular Munster Study; SBP: systolic blood pressure; TPA: total plaque area. | |||
| N | 1,722 | 39 | |
| Age | 50 ± 6 | 51 ± 6 | 0.1942 |
| BMI, kg/m2 | 25.41 ± 4.80 | 24.03 ± 5.92 | 0.0186 |
| Current smoker | 351 (20.4%) | 12 (30.8%) | 0.1767 |
| LDL-cholesterol, mg/dL | 143 ± 32 | 146 ± 35 | 0.6567 |
| HDL-cholesterol, mg/dL | 65 ± 15 | 65 ± 13 | 0.9377 |
| Triglycerides, mg/dL | 112 ± 59 | 118 ± 60 | 0.5433 |
| SBP, mm Hg | 121 ± 16 | 126 ± 18 | 0.1116 |
| DBP, mm Hg | 78 ± 9 | 78 ± 9 | 0.9849 |
| Diabetes mellitus | 27 (1.6%) | 0 (0%) | < 0.0001 |
| Antihypertensive therapy | 308 (17.9%) | 8 (20.5%) | 0.6998 |
| Positive family history | 475 (27.6%) | 10 (25.6%) | 0.7876 |
| PROCAM risk | 1.5±2.5% | 1.8±2.4% | 0.5312 |
| TPA, mm2 | 17 ± 24 | 48 ± 34 | < 0.0001 |
| Max. plaque thickness, mm | 1.6 ± 0.4 | 2.1 ± 0.5 | < 0.0001 |
| 25 - 29 | 30 - 34 | 35 - 39 | 40 - 44 | 45 - 49 | 50 - 54 | 55 - 59 | 60 - 65 | |
|---|---|---|---|---|---|---|---|---|
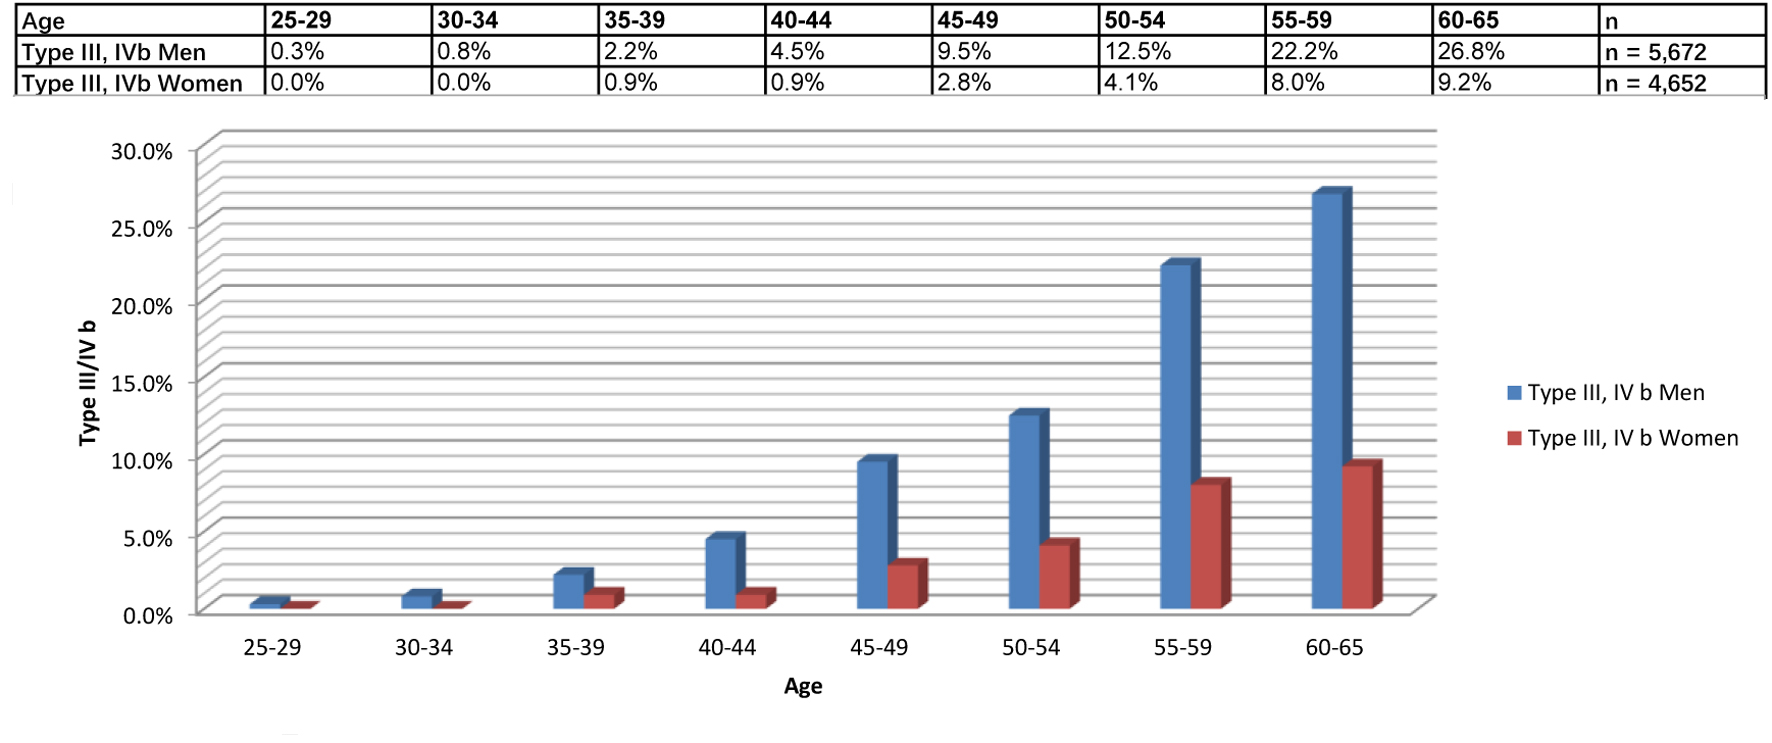
| Type III, IVb, men | 0.3% | 0.8% | 2.2% | 4.5% | 9.5% | 12.5% | 22.2% | 26.8% |
| No. of men examined with follow-up | 477 | 584 | 499 | 335 | 147 | |||
| No. of which change in type III/IVb, men | 24 | 40 | 46 | 26 | 2 | |||
| Change with follow-up, men | 5.0% | 6.8% | 9.2% | 7.8% | 1.4% | |||
| Type III, IVb, women | 0.0% | 0.0% | 0.9% | 0.9% | 2.8% | 4.1% | 8.0% | 9.2% |
| No. of women examined with follow-up | 348 | 486 | 480 | 324 | 125 | |||
| No. of which change in type III/IVb, women | 7 | 5 | 15 | 10 | 2 | |||
| Change with follow-up, women | 2.0% | 1.0% | 3.1% | 3.1% | 1.6% |
| Men without cancer, CVD | Men with cancer | P value (t-test) | |
|---|---|---|---|
| The mean values with the standard deviations or the percentages are shown. BMI: body mass index; CVD: cardiovascular disease; DBP: diastolic blood pressure; HDL: high-density lipoprotein; LDL: low-density lipoprotein; PROCAM: Prospective Cardiovascular Munster Study; SBP: systolic blood pressure; TPA: total plaque area. | |||
| N | 2,397 | 55 | |
| Age | 50 ± 6 | 55 ± 5 | 0.00003 |
| BMI, kg/m2 | 27.48 ± 4.08 | 27.18 ± 4.48 | 0.53300 |
| Current smoker | 603 (25.2%) | 23 (41.8%) | 0.01738 |
| LDL-cholesterol, mg/dL | 151 ± 33 | 151 ± 32 | 0.94355 |
| HDL-cholesterol, mg/dL | 50 ± 11 | 52 ± 13 | 0.52725 |
| Triglycerides, mg/dL | 172 ± 116 | 198 ± 133 | 0.26128 |
| SBP, mm Hg | 128 ± 16 | 135 ± 17 | 0.02165 |
| DBP, mm Hg | 82 ± 8 | 84 ± 10 | 0.05588 |
| Diabetes mellitus | 103 (4.3%) | 2 (3.6%) | 0.79888 |
| Antihypertensive therapy | 572 (23.9%) | 19 (34.5%) | 0.10744 |
| Positive family history | 549 (22.9%) | 13 (23.6%) | 0.90068 |
| PROCAM risk | 7.5±6.4% | 12.8±7.5% | 0.03379 |
| TPA, mm2 | 49 ± 33 | 103 ± 30 | < 0.00001 |
| Max. plaque thickness, mm | 2.1 ± 0.5 | 2.6 ± 0.5 | 0.00037 |
| Men without cancer, CVD | Men with CVD | P value (t-test) | |
|---|---|---|---|
| The mean values with the standard deviations or the percentages are shown. BMI: body mass index; CVD: cardiovascular disease; DBP: diastolic blood pressure; HDL: high-density lipoprotein; LDL: low-density lipoprotein; PROCAM: Prospective Cardiovascular Munster Study; SBP: systolic blood pressure; TPA: total plaque area. | |||
| N | 2,397 | 188 | |
| Age | 50 ± 6 | 54 ± 6 | < 0.00001 |
| BMI, kg/m2 | 27.48 ± 4.08 | 28.10 ± 4.08 | 0.0161 |
| Current smoker | 603 (25.2%) | 85 (45.2%) | < 0.00001 |
| LDL-cholesterol, mg/dL | 151 ± 33 | 161 ± 33 | 0.00065 |
| HDL-cholesterol, mg/dL | 50 ± 11 | 48 ± 11 | 0.00275 |
| Triglycerides, mg/dL | 172 ± 116 | 194 ± 116 | 0.01691 |
| SBP, mm Hg | 128 ± 16 | 133 ± 16 | 0.00153 |
| DBP, mm Hg | 82 ± 8 | 83 ± 8 | 0.12071 |
| Diabetes mellitus | 103 (4.3%) | 20 (10.6%) | 0.00620 |
| Antihypertensive therapy | 572 (23.9%) | 68 (36.2%) | 0.00081 |
| Positive family history | 549 (22.9%) | 58 (30.9%) | 0.02357 |
| PROCAM risk | 7.5±6.4% | 14.9±6.4% | < 0.00001 |
| TPA, mm2 | 49 ± 33 | 133 ± 33 | < 0.00001 |
| Max. plaque thickness, mm | 2.1 ± 0.5 | 2.7 ± 0.5 | < 0.00001 |
| Men with CVD | Men with cancer | P value (t-test) | |
|---|---|---|---|
| The mean values with the standard deviations or the percentages are shown. BMI: body mass index; CVD: cardiovascular disease; DBP: diastolic blood pressure; HDL: high-density lipoprotein; LDL: low-density lipoprotein; PROCAM: Prospective Cardiovascular Munster Study; SBP: systolic blood pressure; TPA: total plaque area. | |||
| N | 188 | 55 | |
| Age | 54 ± 6 | 55 ± 5 | 0.9690 |
| BMI, kg/m2 | 28.10 ± 4.08 | 27.18 ± 4.48 | 0.0650 |
| Current smoker | 85 (45.2%) | 23 (41.8%) | 0.6857 |
| LDL-cholesterol, mg/dL | 161 ± 33 | 151 ± 32 | 0.0677 |
| HDL-cholesterol, mg/dL | 48 ± 11 | 52 ± 13 | 0.0731 |
| Triglycerides, mg/dL | 194 ± 116 | 198 ± 133 | 0.8708 |
| SBP, mm Hg | 133 ± 16 | 135 ± 17 | 0.4497 |
| DBP, mm Hg | 83 ± 8 | 84 ± 10 | 0.4753 |
| Diabetes mellitus | 20 (10.6%) | 2 (3.6%) | 0.0413 |
| Antihypertensive therapy | 68 (36.2%) | 19 (34.5%) | 0.8620 |
| Positive family history | 58 (30.9%) | 13 (23.6%) | 0.3092 |
| PROCAM risk | 14.9±6.4% | 12.8±7.5% | 0.4608 |
| TPA, mm2 | 133 ± 33 | 103 ± 30 | 0.0153 |
| Max. plaque thickness, mm | 2.7 ± 0.5 | 2.6 ± 0.5 | 0.5322 |
| Male, type I, IIa, IIb, IVa follow-up | Male without follow-up | P value | Female, type I, IIa, IIb, IVa follow-up | Female without follow-up | P value | |
|---|---|---|---|---|---|---|
| The mean values with the standard deviations or the percentages are shown. BMI: body mass index; DBP: diastolic blood pressure; HDL: high-density lipoprotein; LDL: low-density lipoprotein; PROCAM: Prospective Cardiovascular Munster Study; SBP: systolic blood pressure; TPA: total plaque area. | ||||||
| N | 2,052 | 1,494 | 1,761 | 1,684 | ||
| Age | 50 ± 7 | 50 ± 8 | 0.122 | 50 ± 7 | 50 ± 4 | 0.158 |
| BMI, kg/m2 | 27.47 ± 4.08 | 27.60 ± 4.08 | 0.375 | 25.40 ± 4.68 | 25.63 ± 4.98 | 0.174 |
| Current smoker | 458 (22.3%) | 335 (22.4%) | 0.966 | 339 (19.3%) | 337 (20.0%) | 0.778 |
| LDL-cholesterol, mg/dL | 150 ± 33 | 150 ± 40 | 0.719 | 143 ± 33 | 145 ± 35 | 0.361 |
| HDL-cholesterol, mg/dL | 51 ± 12 | 50 ± 20 | 0.072 | 65 ± 15 | 64 ± 12 | 0.487 |
| Triglycerides, mg/dL | 170 ± 117 | 171 ± 122 | 0.896 | 112 ± 58 | 119 ± 64 | 0.123 |
| SBP, mm Hg | 126 ± 15 | 128 ± 16 | 0.181 | 122 ± 16 | 123 ± 19 | 0.095 |
| DBP, mm Hg | 82 ± 8 | 82 ± 11 | 0.066 | 78 ± 9 | 79 ± 10 | 0.067 |
| Diabetes mellitus | 76 (3.7%) | 56 (3.7%) | 0.985 | 25 (1.4%) | 33 (1.9%) | 0.205 |
| Antihypertensive therapy | 440 (21.4%) | 363 (24.3%) | 0.058 | 318 (18.1%) | 333 (19.8%) | 0.151 |
| Positive family history | 450 (21.9%) | 307 (20.5%) | 0.305 | 485 (27.5%) | 448 (26.6%) | 0.639 |
| PROCAM risk | 6.5±6.5% | 6.5±9.46% | 0.693 | 1.5±2.4% | 1.8±2.7% | 0.058 |
| TPA, mm2 | 32 ± 33 | 30 ± 26 | 0.068 | 16 ± 24 | 15 ± 27 | 0.052 |
| Max. plaque thickness, mm | 1.7 ± 0.5 | 1.6 ± 0.4 | 0.713 | 1.6 ± 0.4 | 1.6 ± 0.5 | 0.072 |