Figures
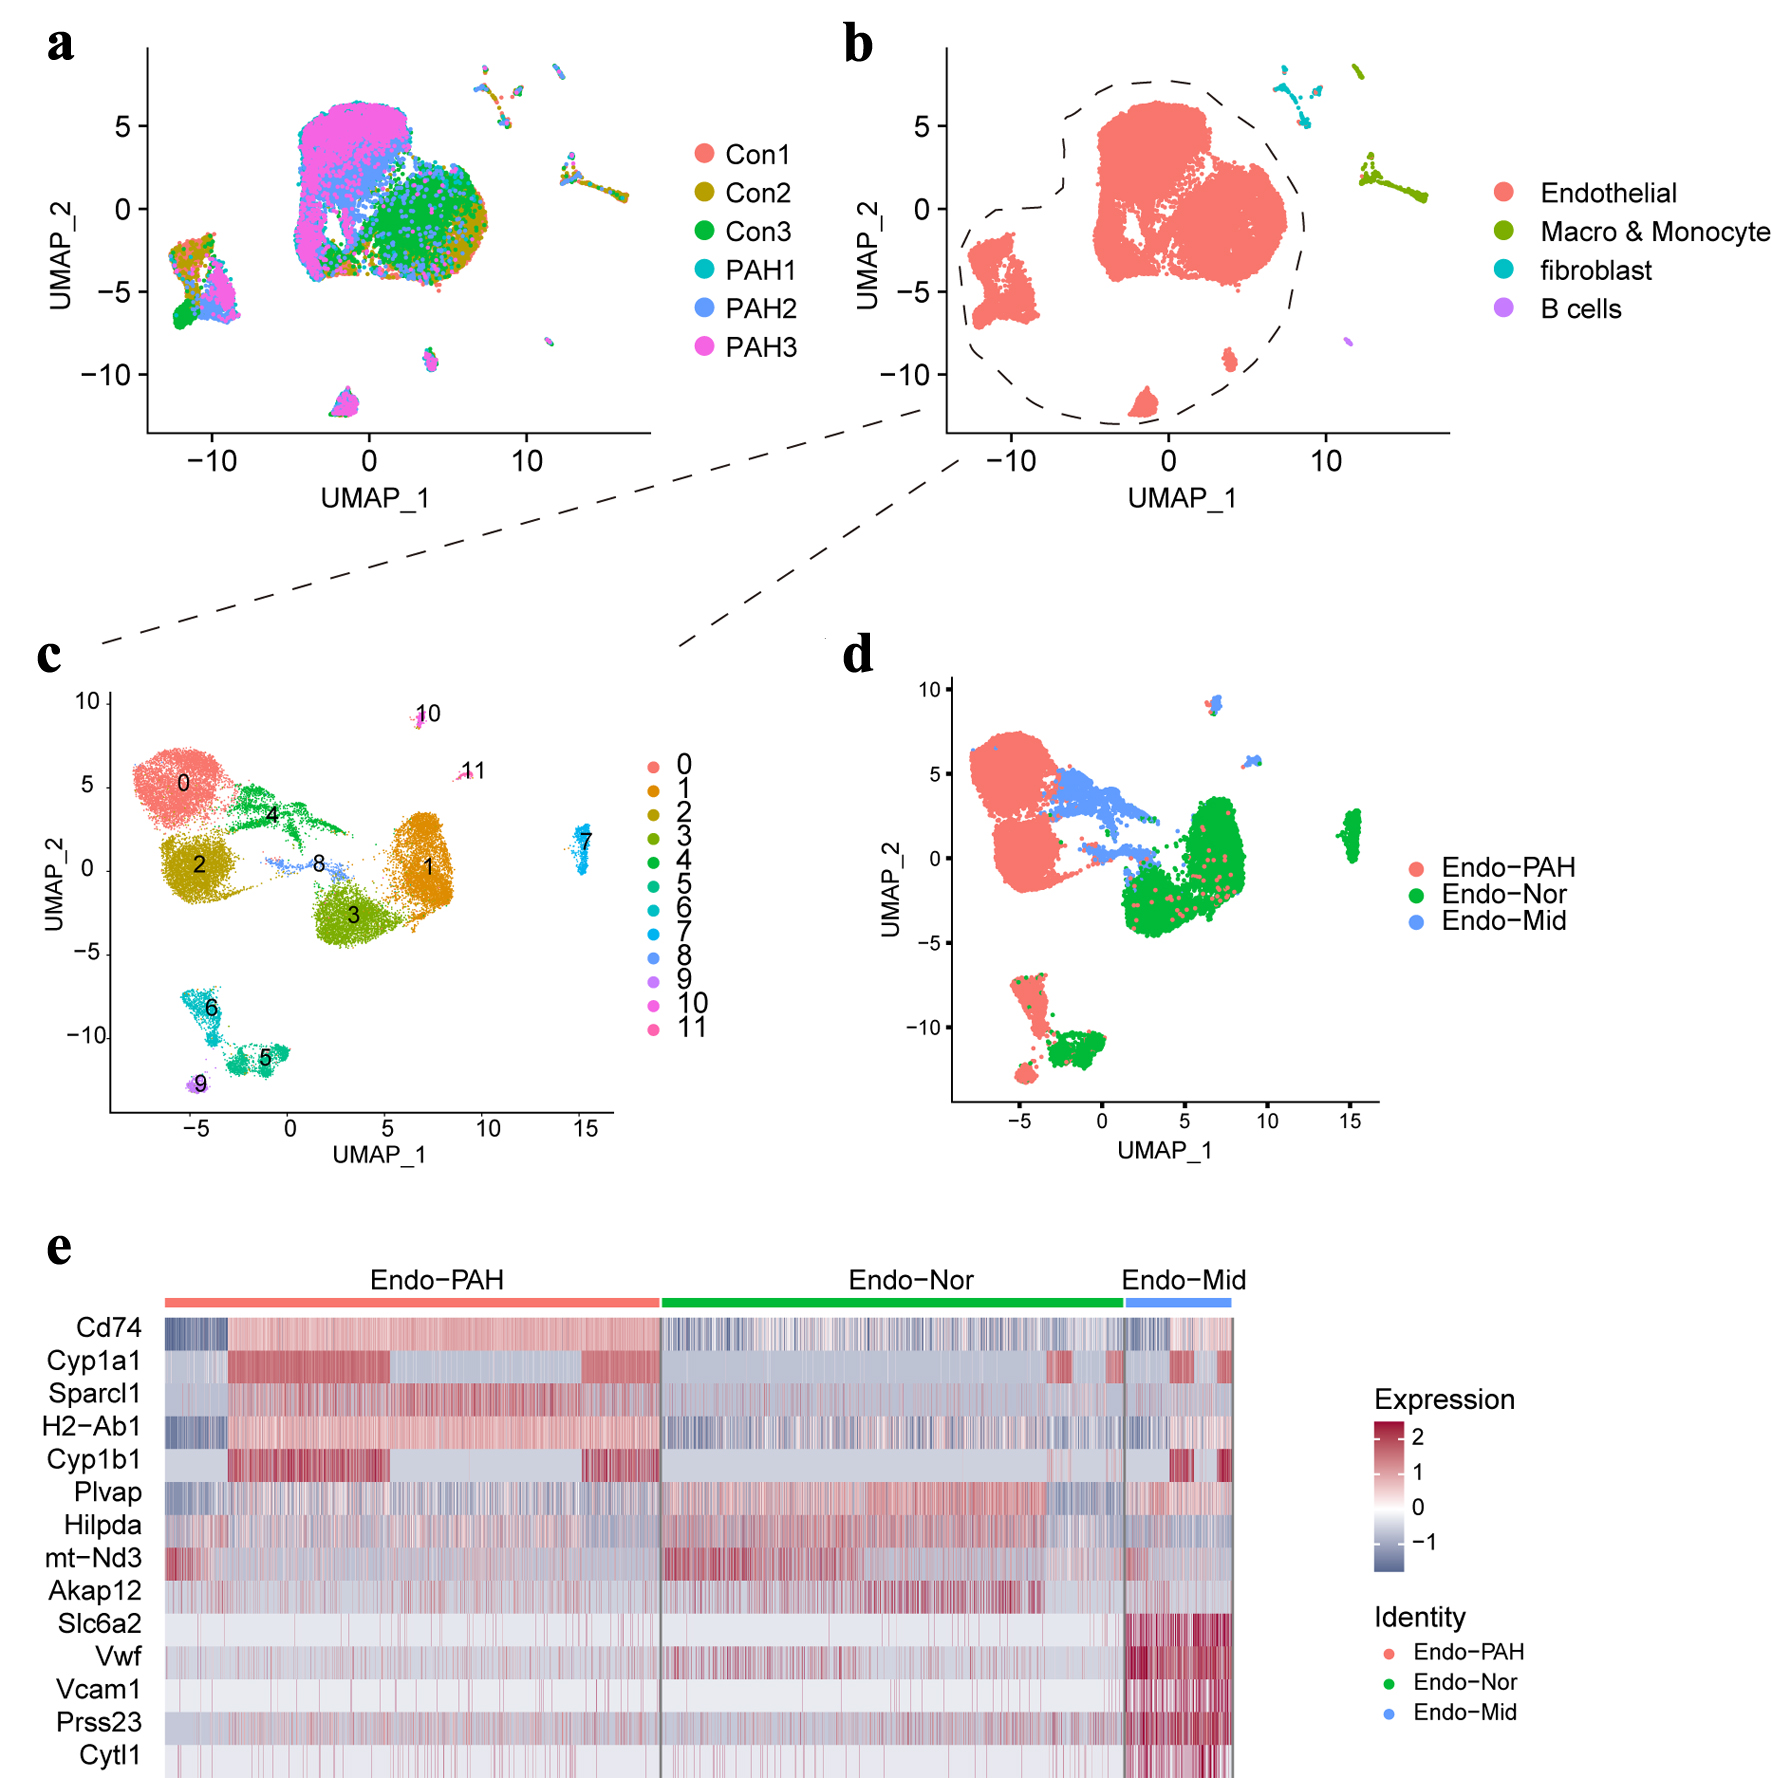
↓ Figure 1. The single-cell landscape in this study. (a) The UMAP plot showing the merged data in this study. (b) The UMAP plot showing the main cell types. (c) The UMAP plot showing the different clusters of endothelial cells. (d) Display of sub-cell types of endothelial cell. (e) The heatmap showing the top five genes in different sub- cell types. UMAP: uniform manifold approximation and projection.
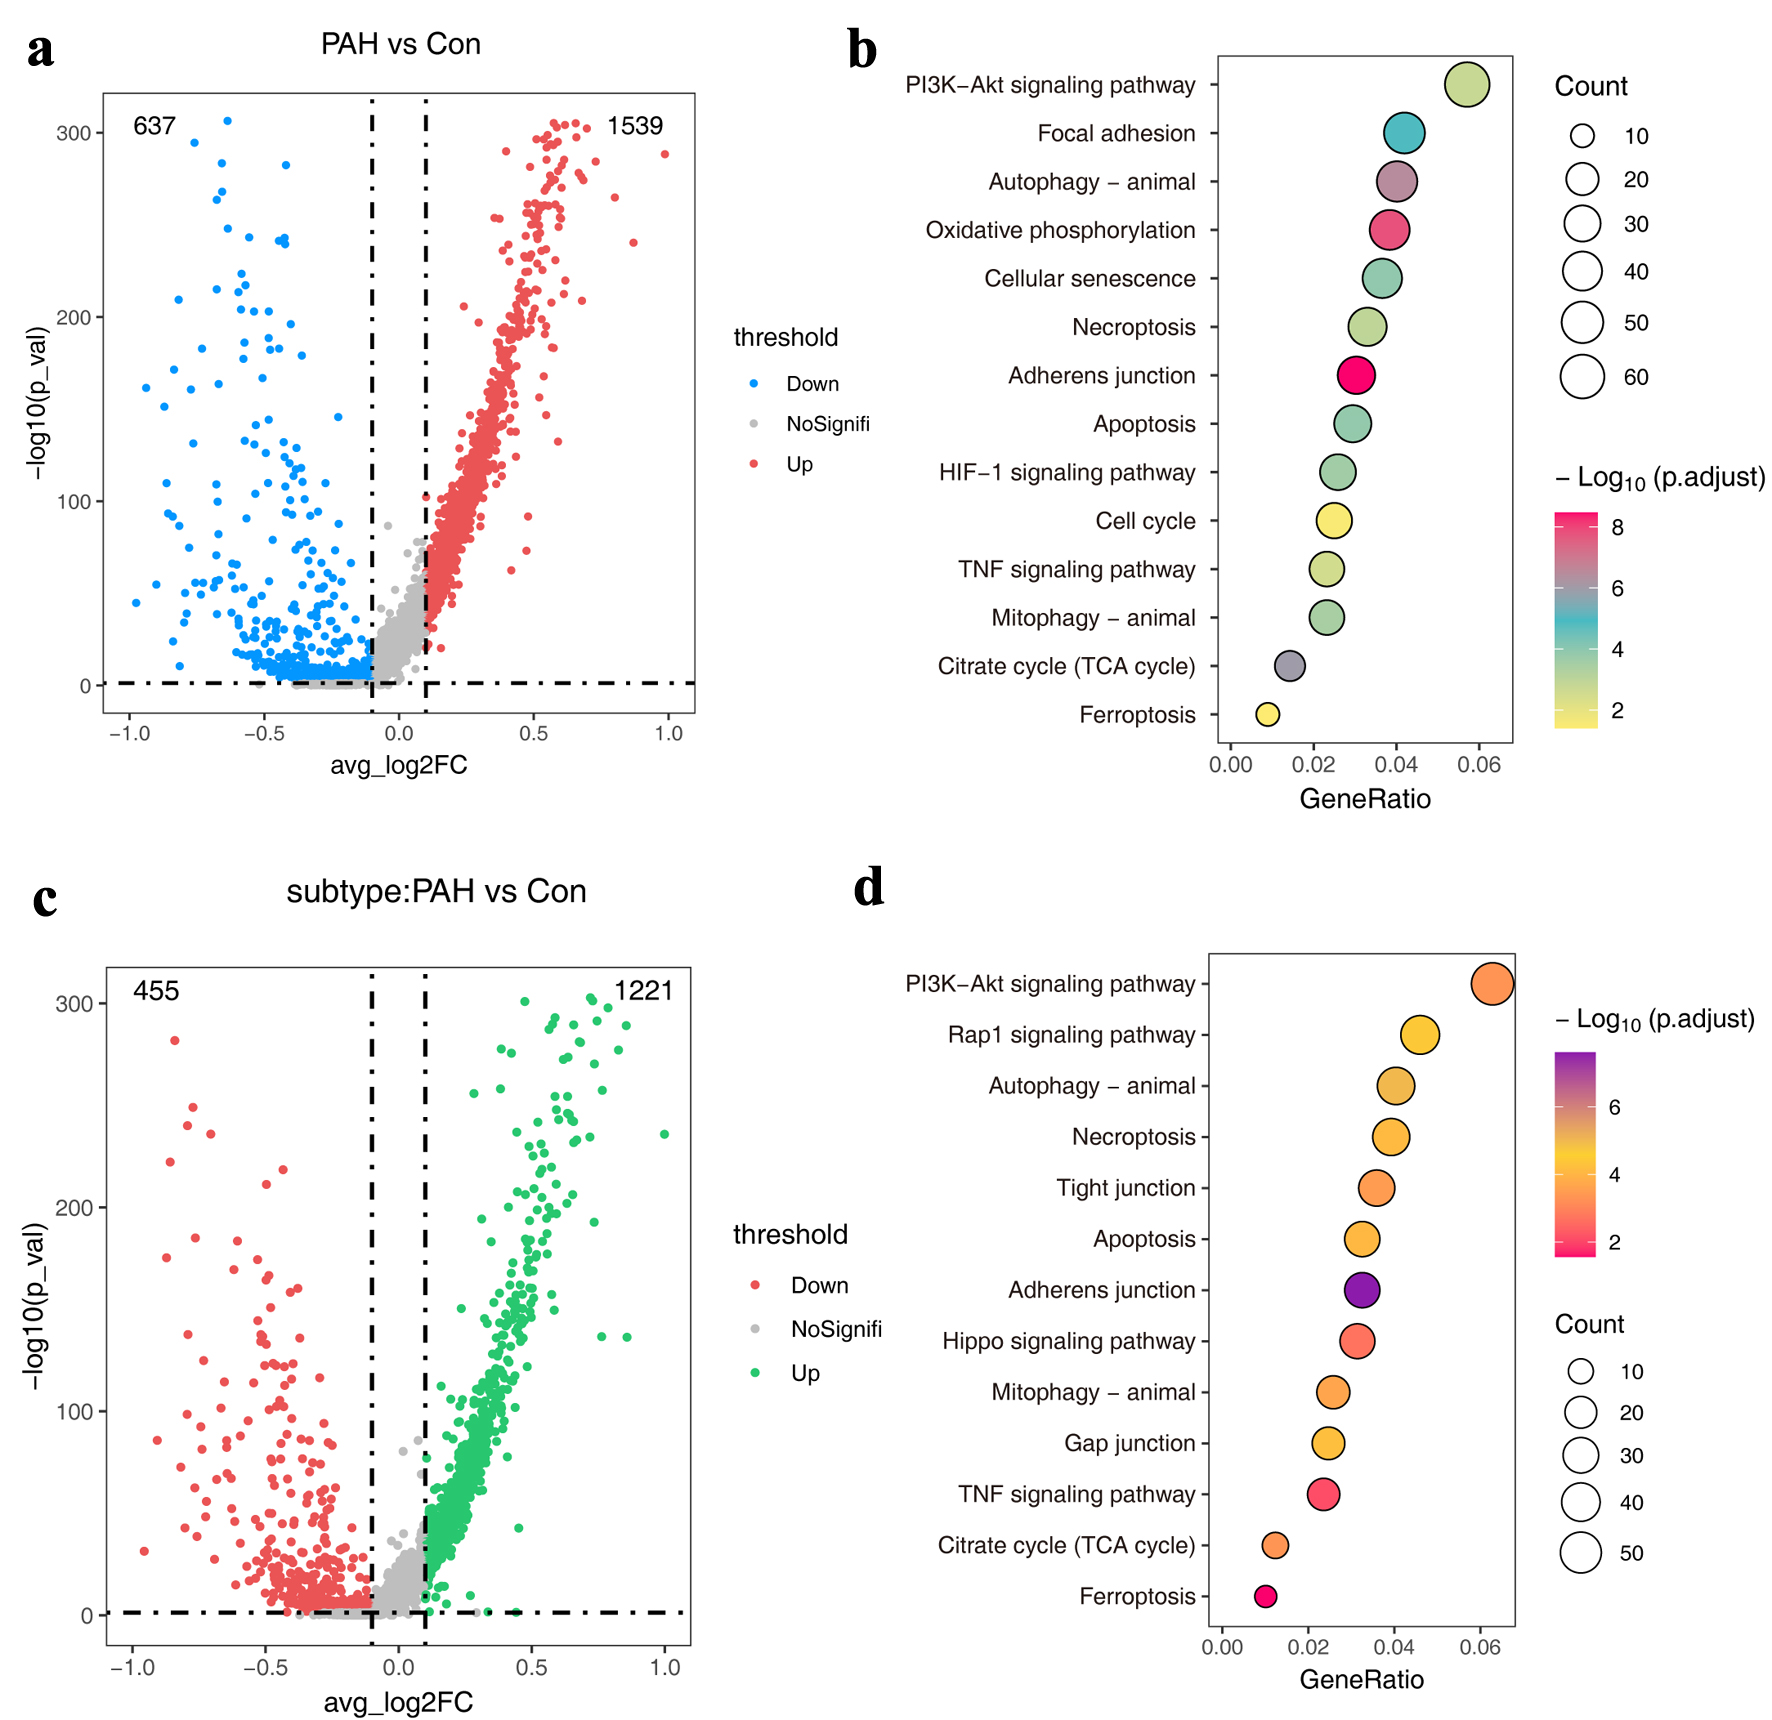
↓ Figure 2. The atlas of molecular features of ECs. (a) Volcano plots showing DEGs in the PAH group compared to the normal group. (b) The KEGG pathways of DEGs in (a). (d) Volcano plots showing DEGs in the Endo-PAH group compared to the Endo-Nor group. (d) The KEGG pathways of DEGs in (c). DEGs: differentially expressed genes; ECs: endothelial cells; Endo-PAH: PAH disease group; Endo-Nor: normal state; KEGG: Kyoto Encyclopedia of Genes and Genomes; PAH: pulmonary arterial hypertension.
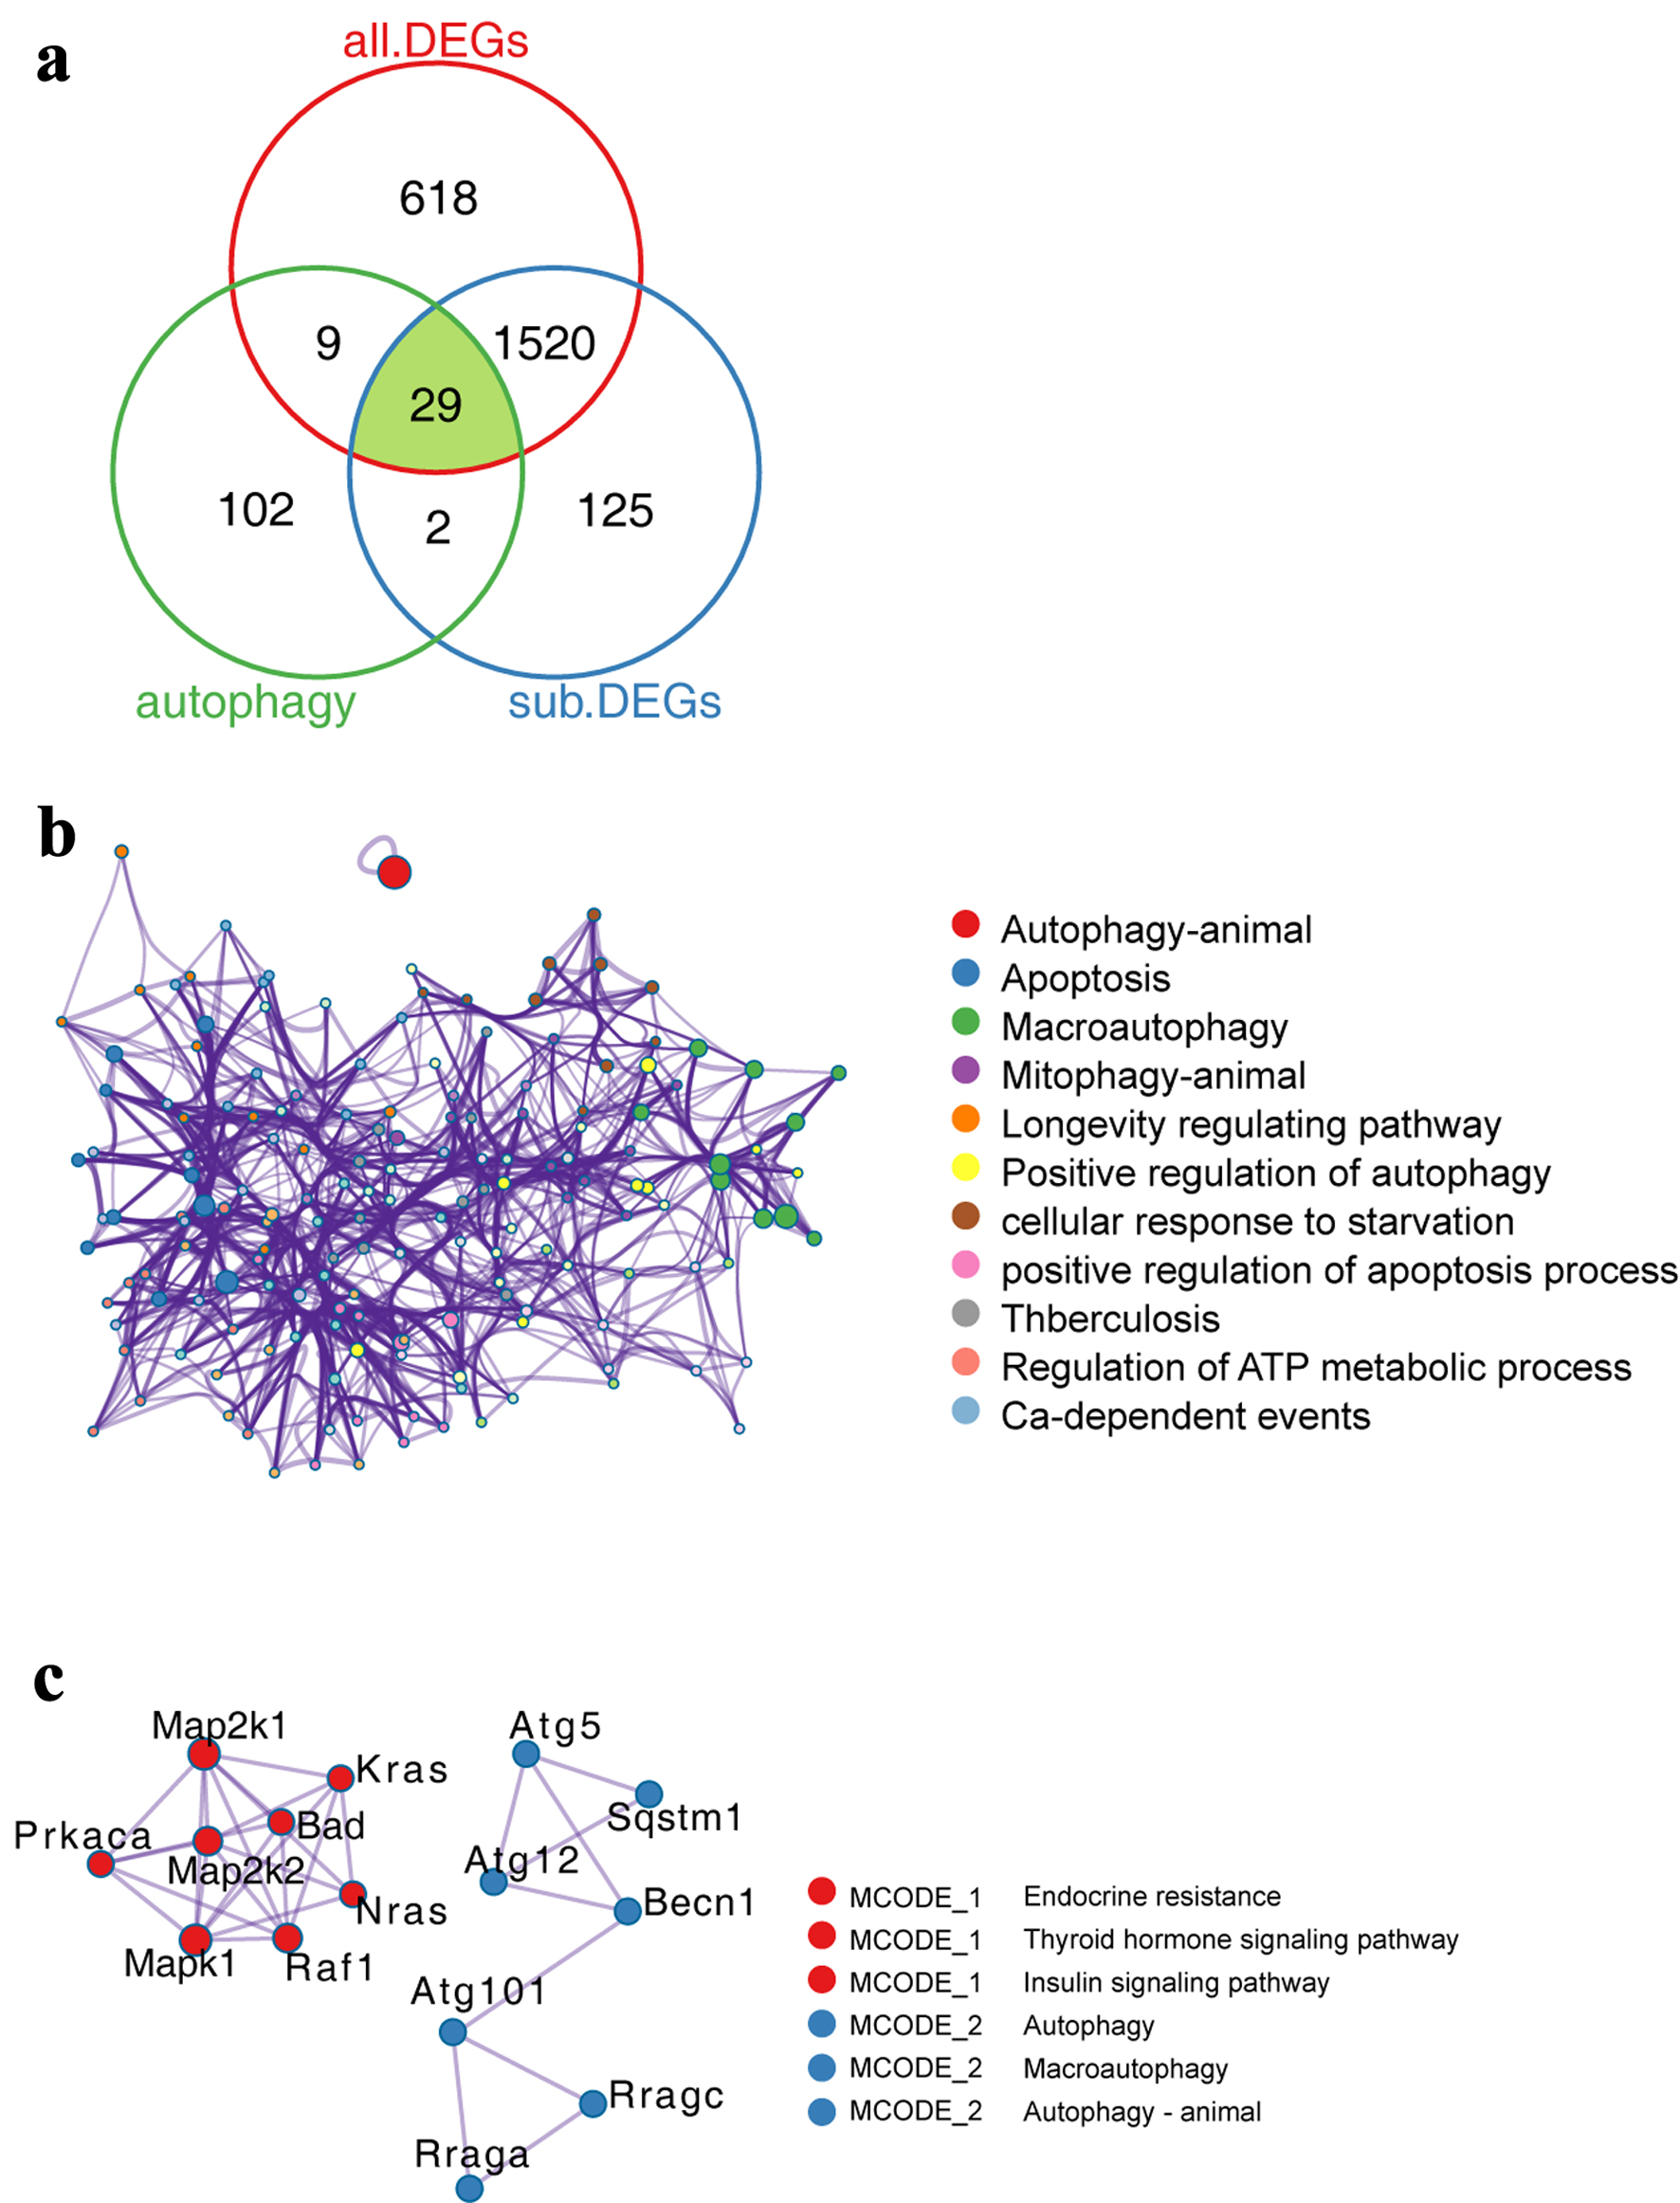
↓ Figure 3. Expression characteristics of autophagy-related genes in PAH model. (a) Venn diagram showing the comparative analysis of autophagy-related genes and genes related to PAH process. (b) Functionally enriched network of autophagy-related genes. The size of the dots represents the number of genes enriched by the term, while the lines represent the interconnections between different terms. (c) PPI network of autophagy-related genes. Dots of the same color represent that they belong to the same type, while lines represent the interconnections between different proteins. PAH: pulmonary arterial hypertension; PPI: protein-protein interaction.
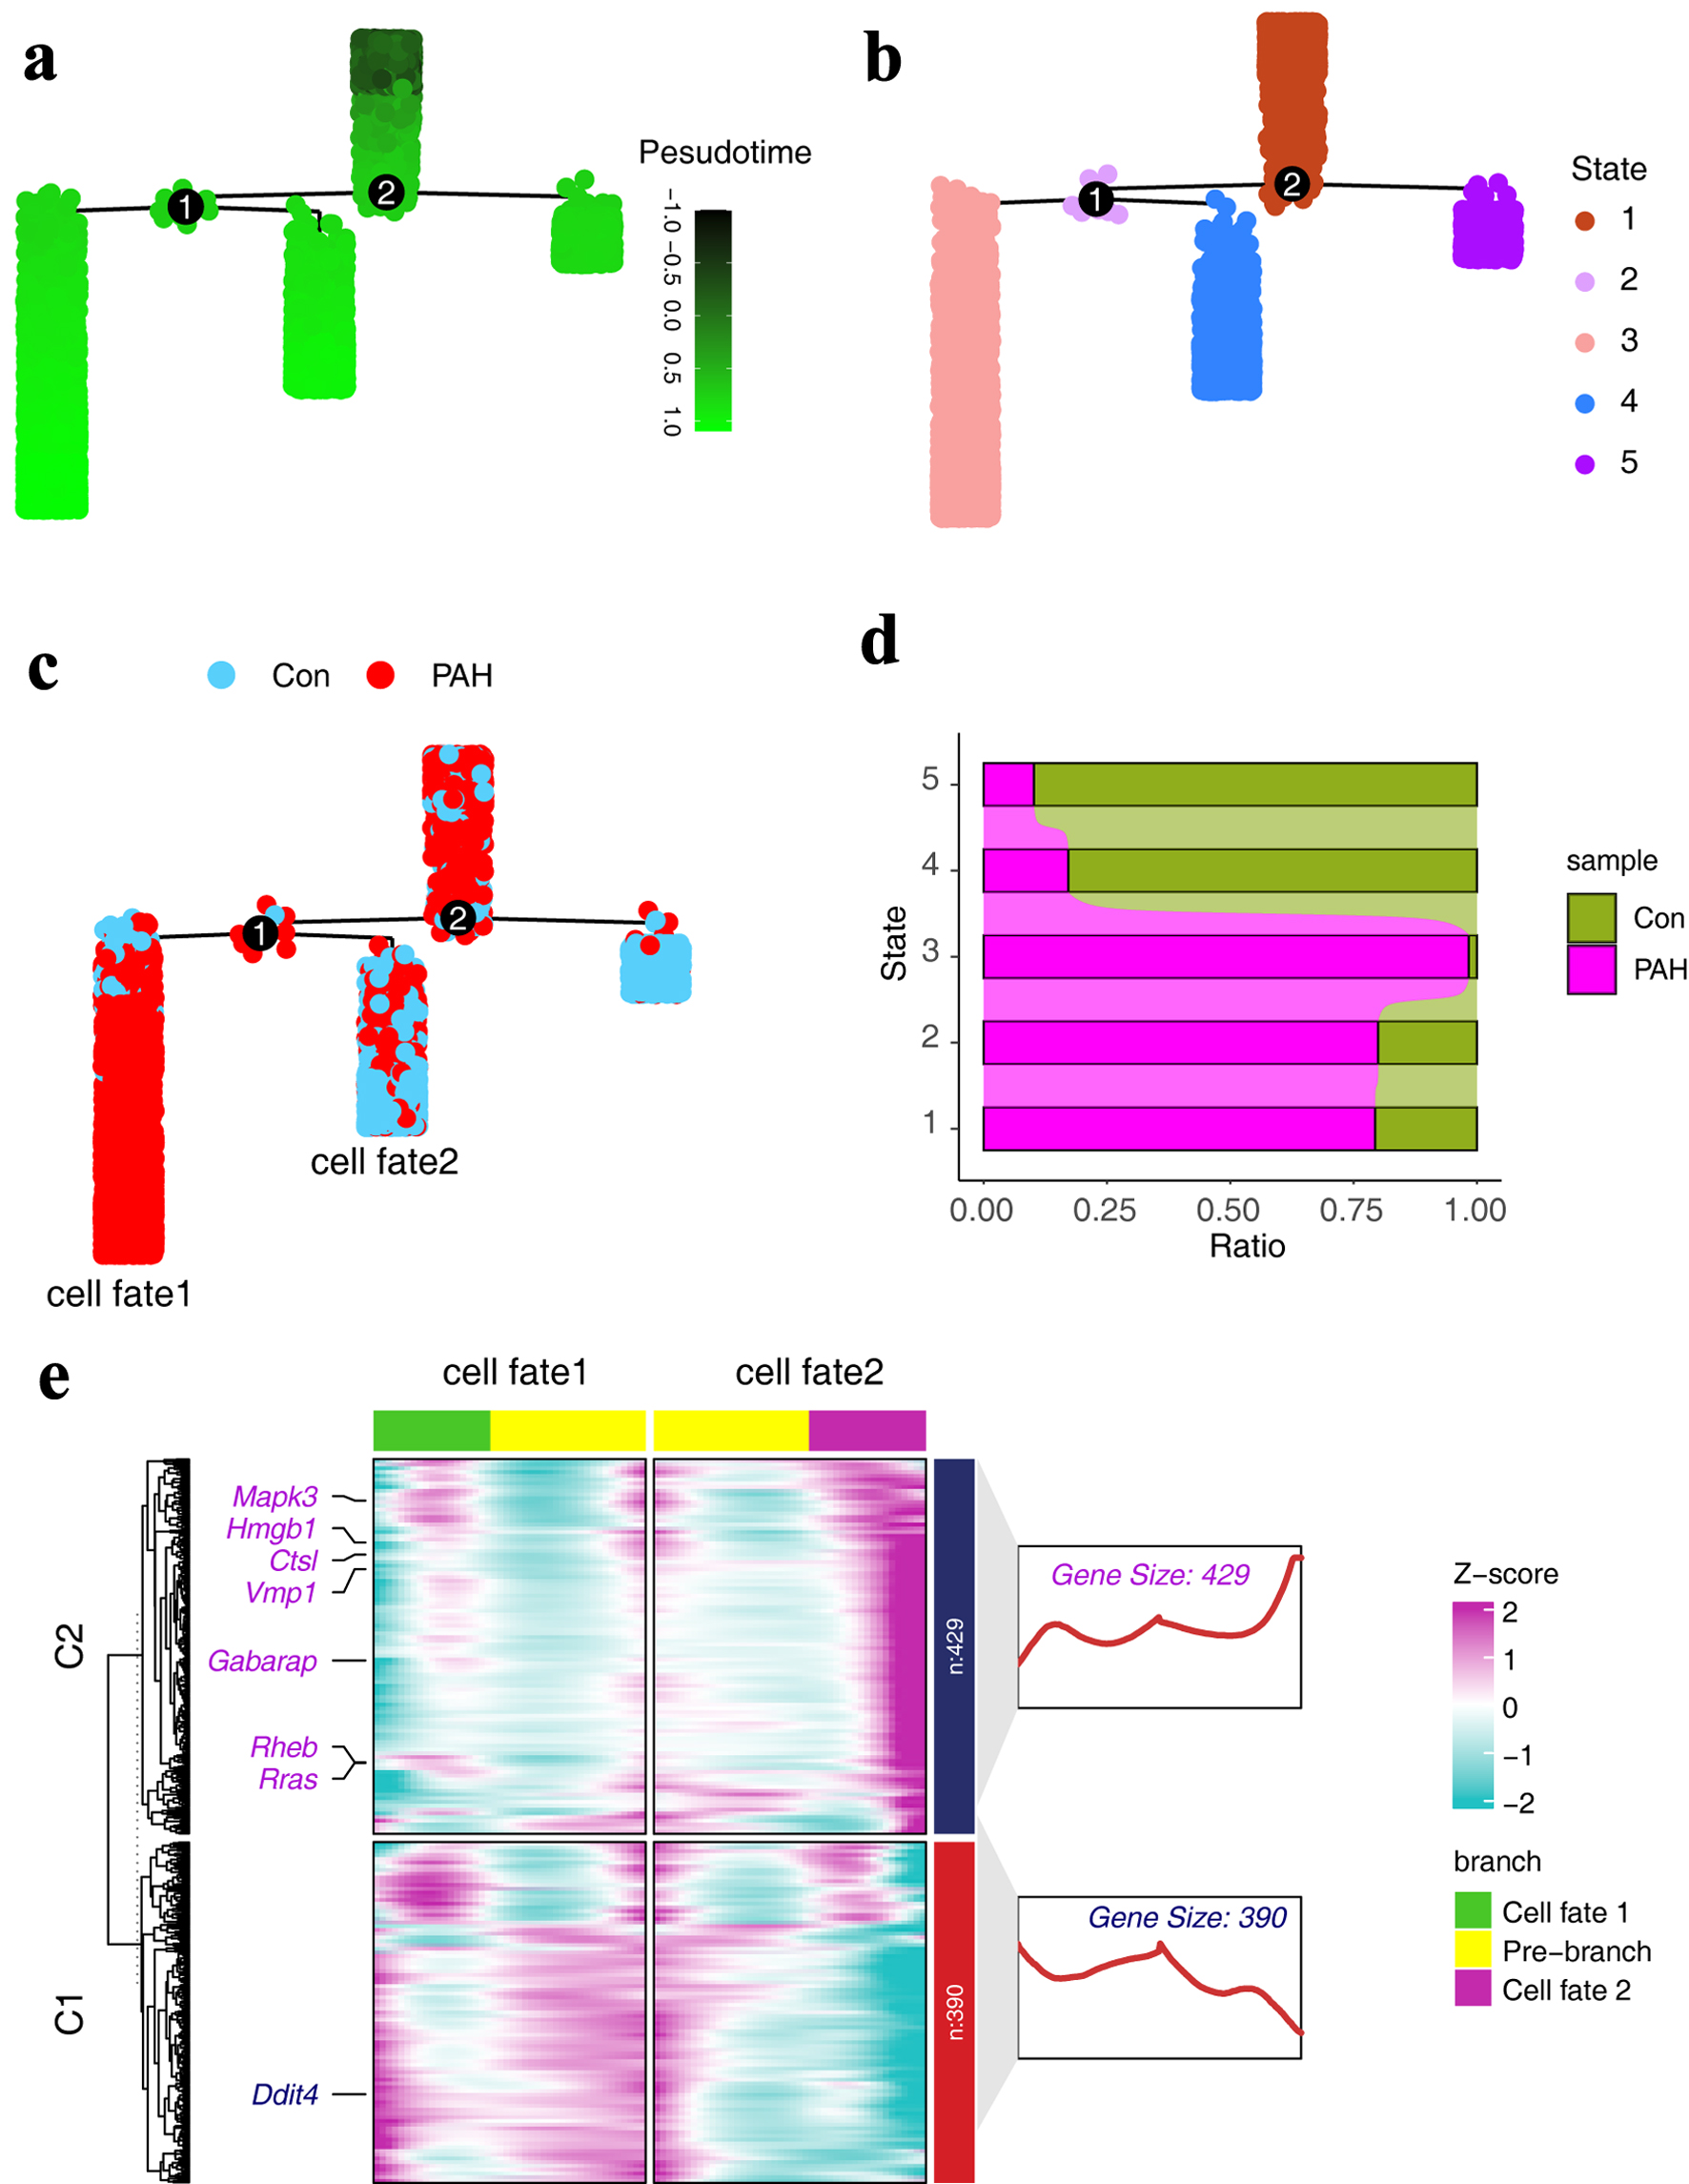
↓ Figure 4. Expression characteristics of autophagy-related genes in pseudo-time trajectories. (a) Pseudo-time trajectories of ECs, with colors representing developmental trajectory states. (b) Fate states of ECs in pseudo-time trajectories. (c) Distribution of different groups in the pseudo-time series trajectory. (d) The distribution of different groups in different states of the pseudo-time trajectory. (e) Heat map showing the expression characteristics of autophagy-related genes in pseudo-time trajectory. ECs: endothelial cells.
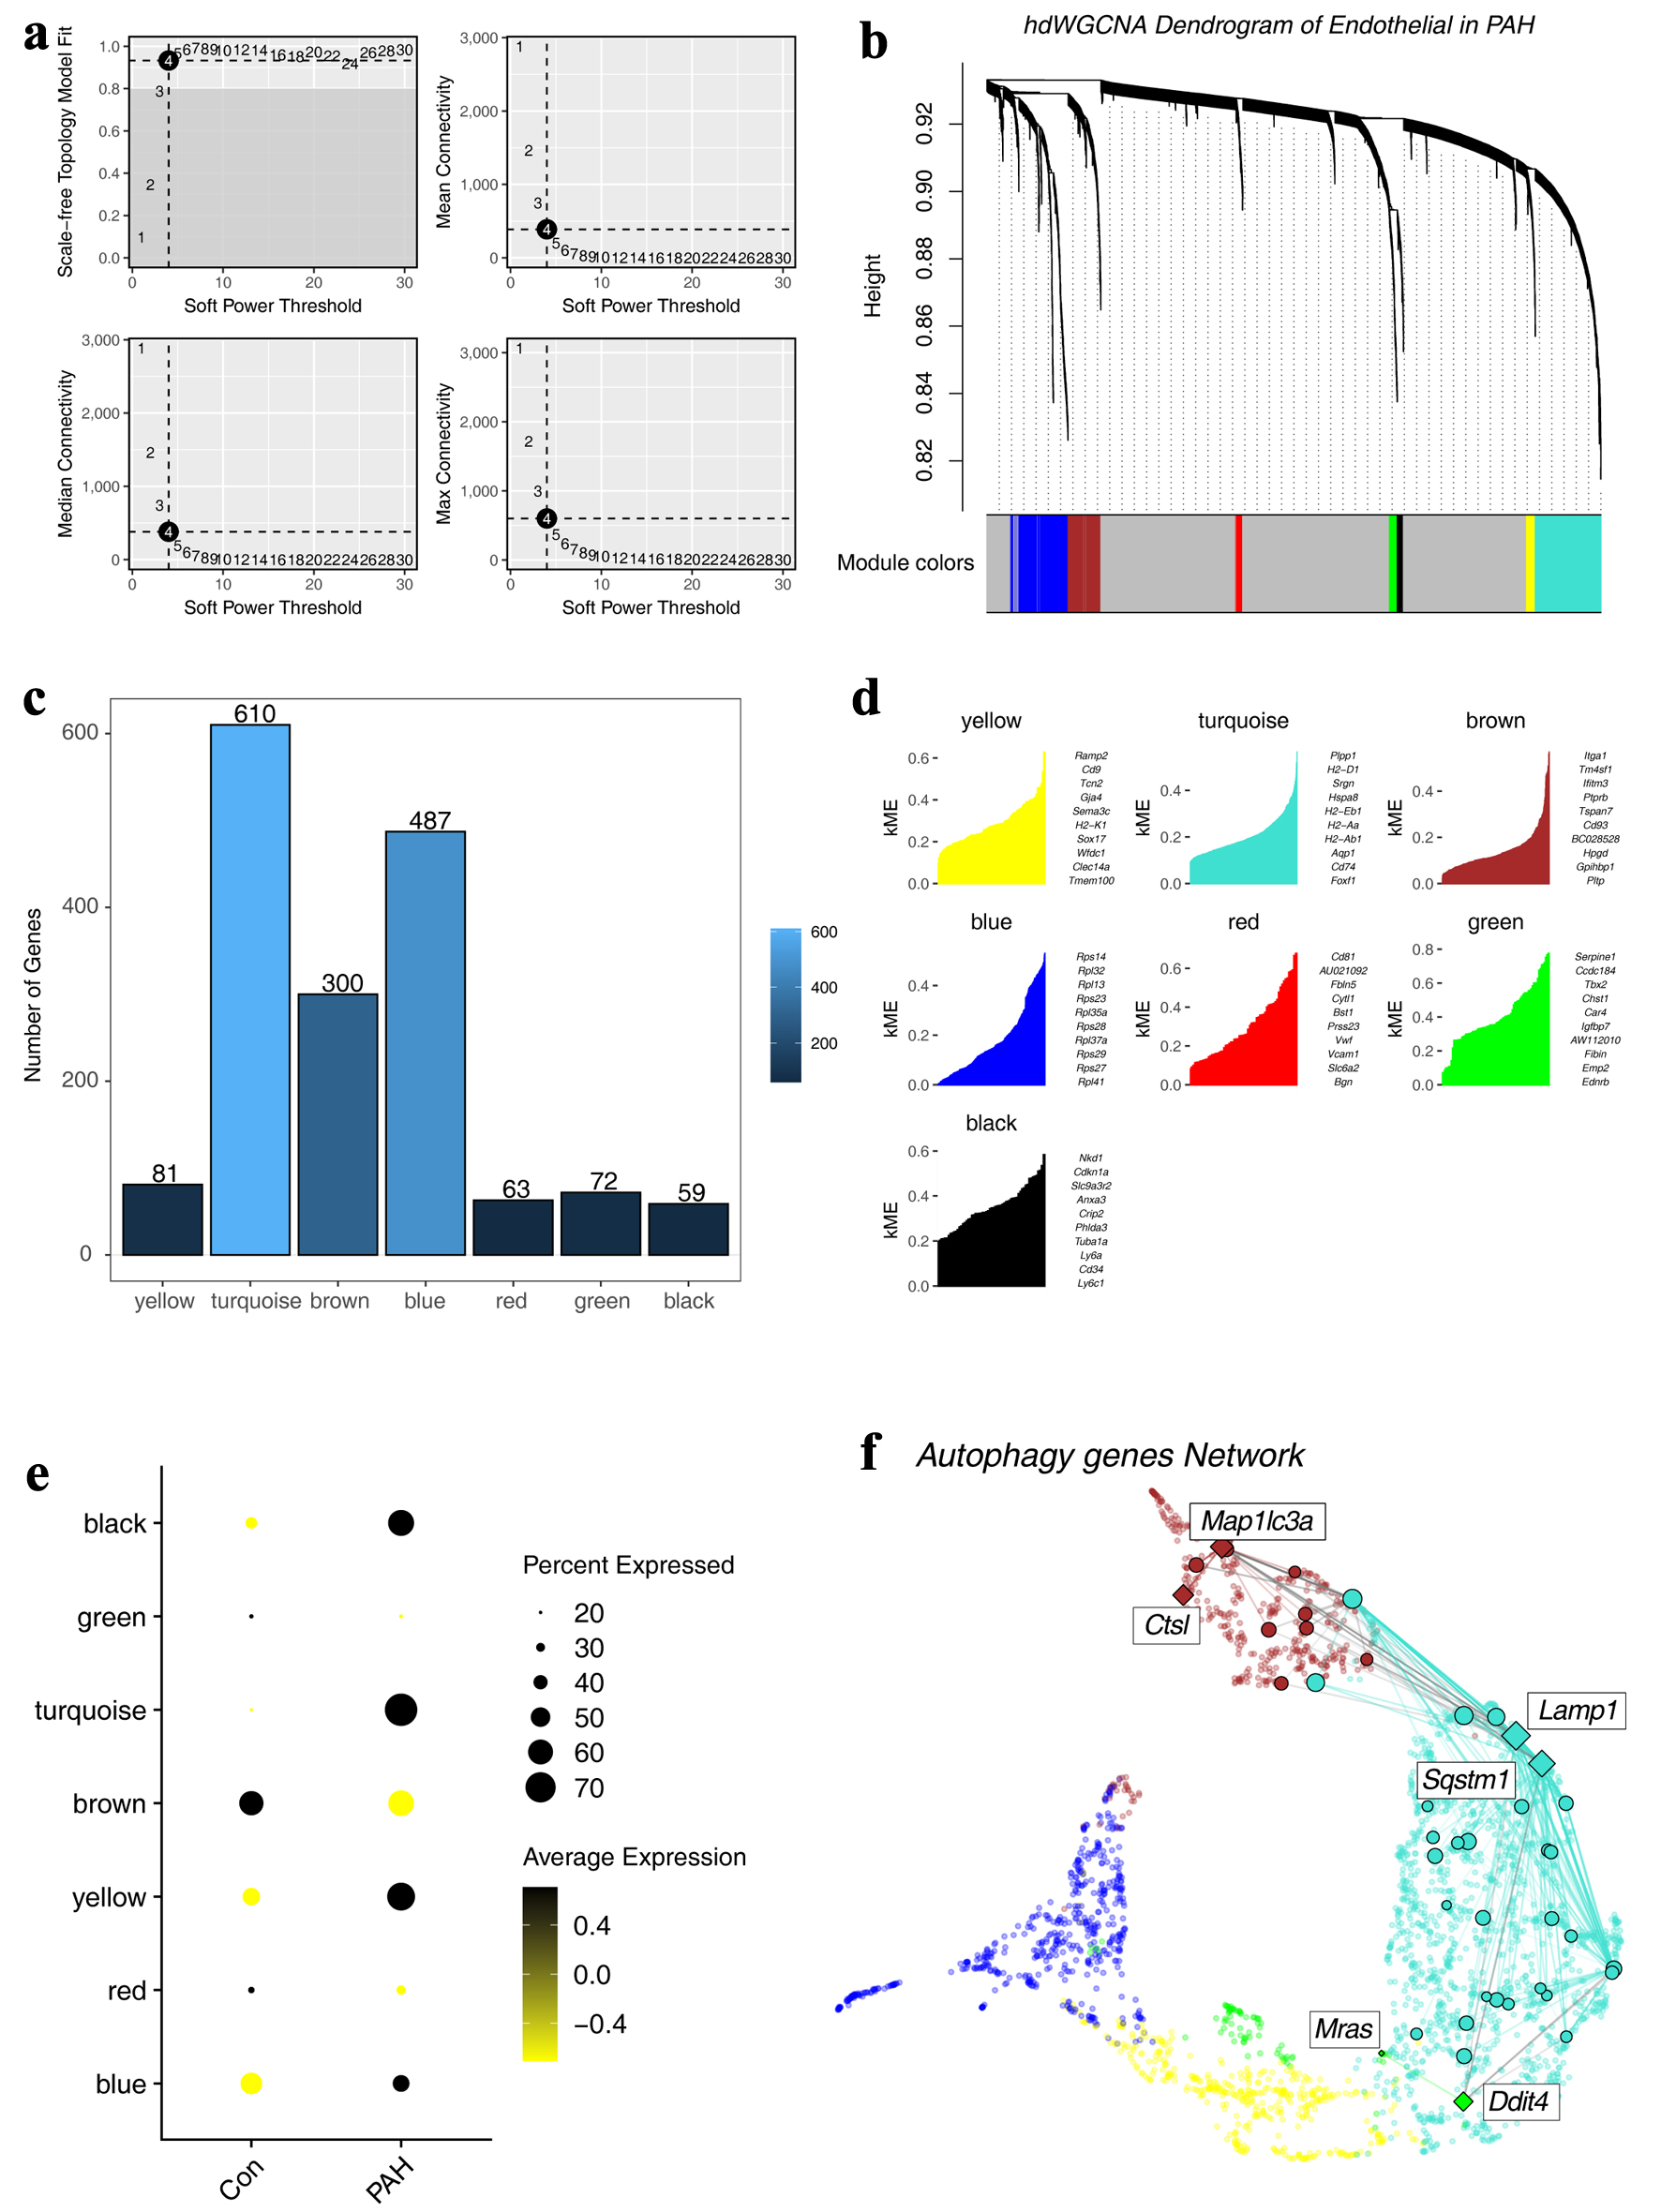
↓ Figure 5. Construction of a regulatory network of autophagy-related genes. (a) Distribution of scale-free networks under different thresholds. (b) Hierarchical clustering shows the module divisions to which different genes belong. (c) The bar graph shows the number of genes in different modules. (d) Top 10 genes in different modules. (e) Expression characteristics of different modules in different groups. (f) The regulatory network of autophagy-related genes.
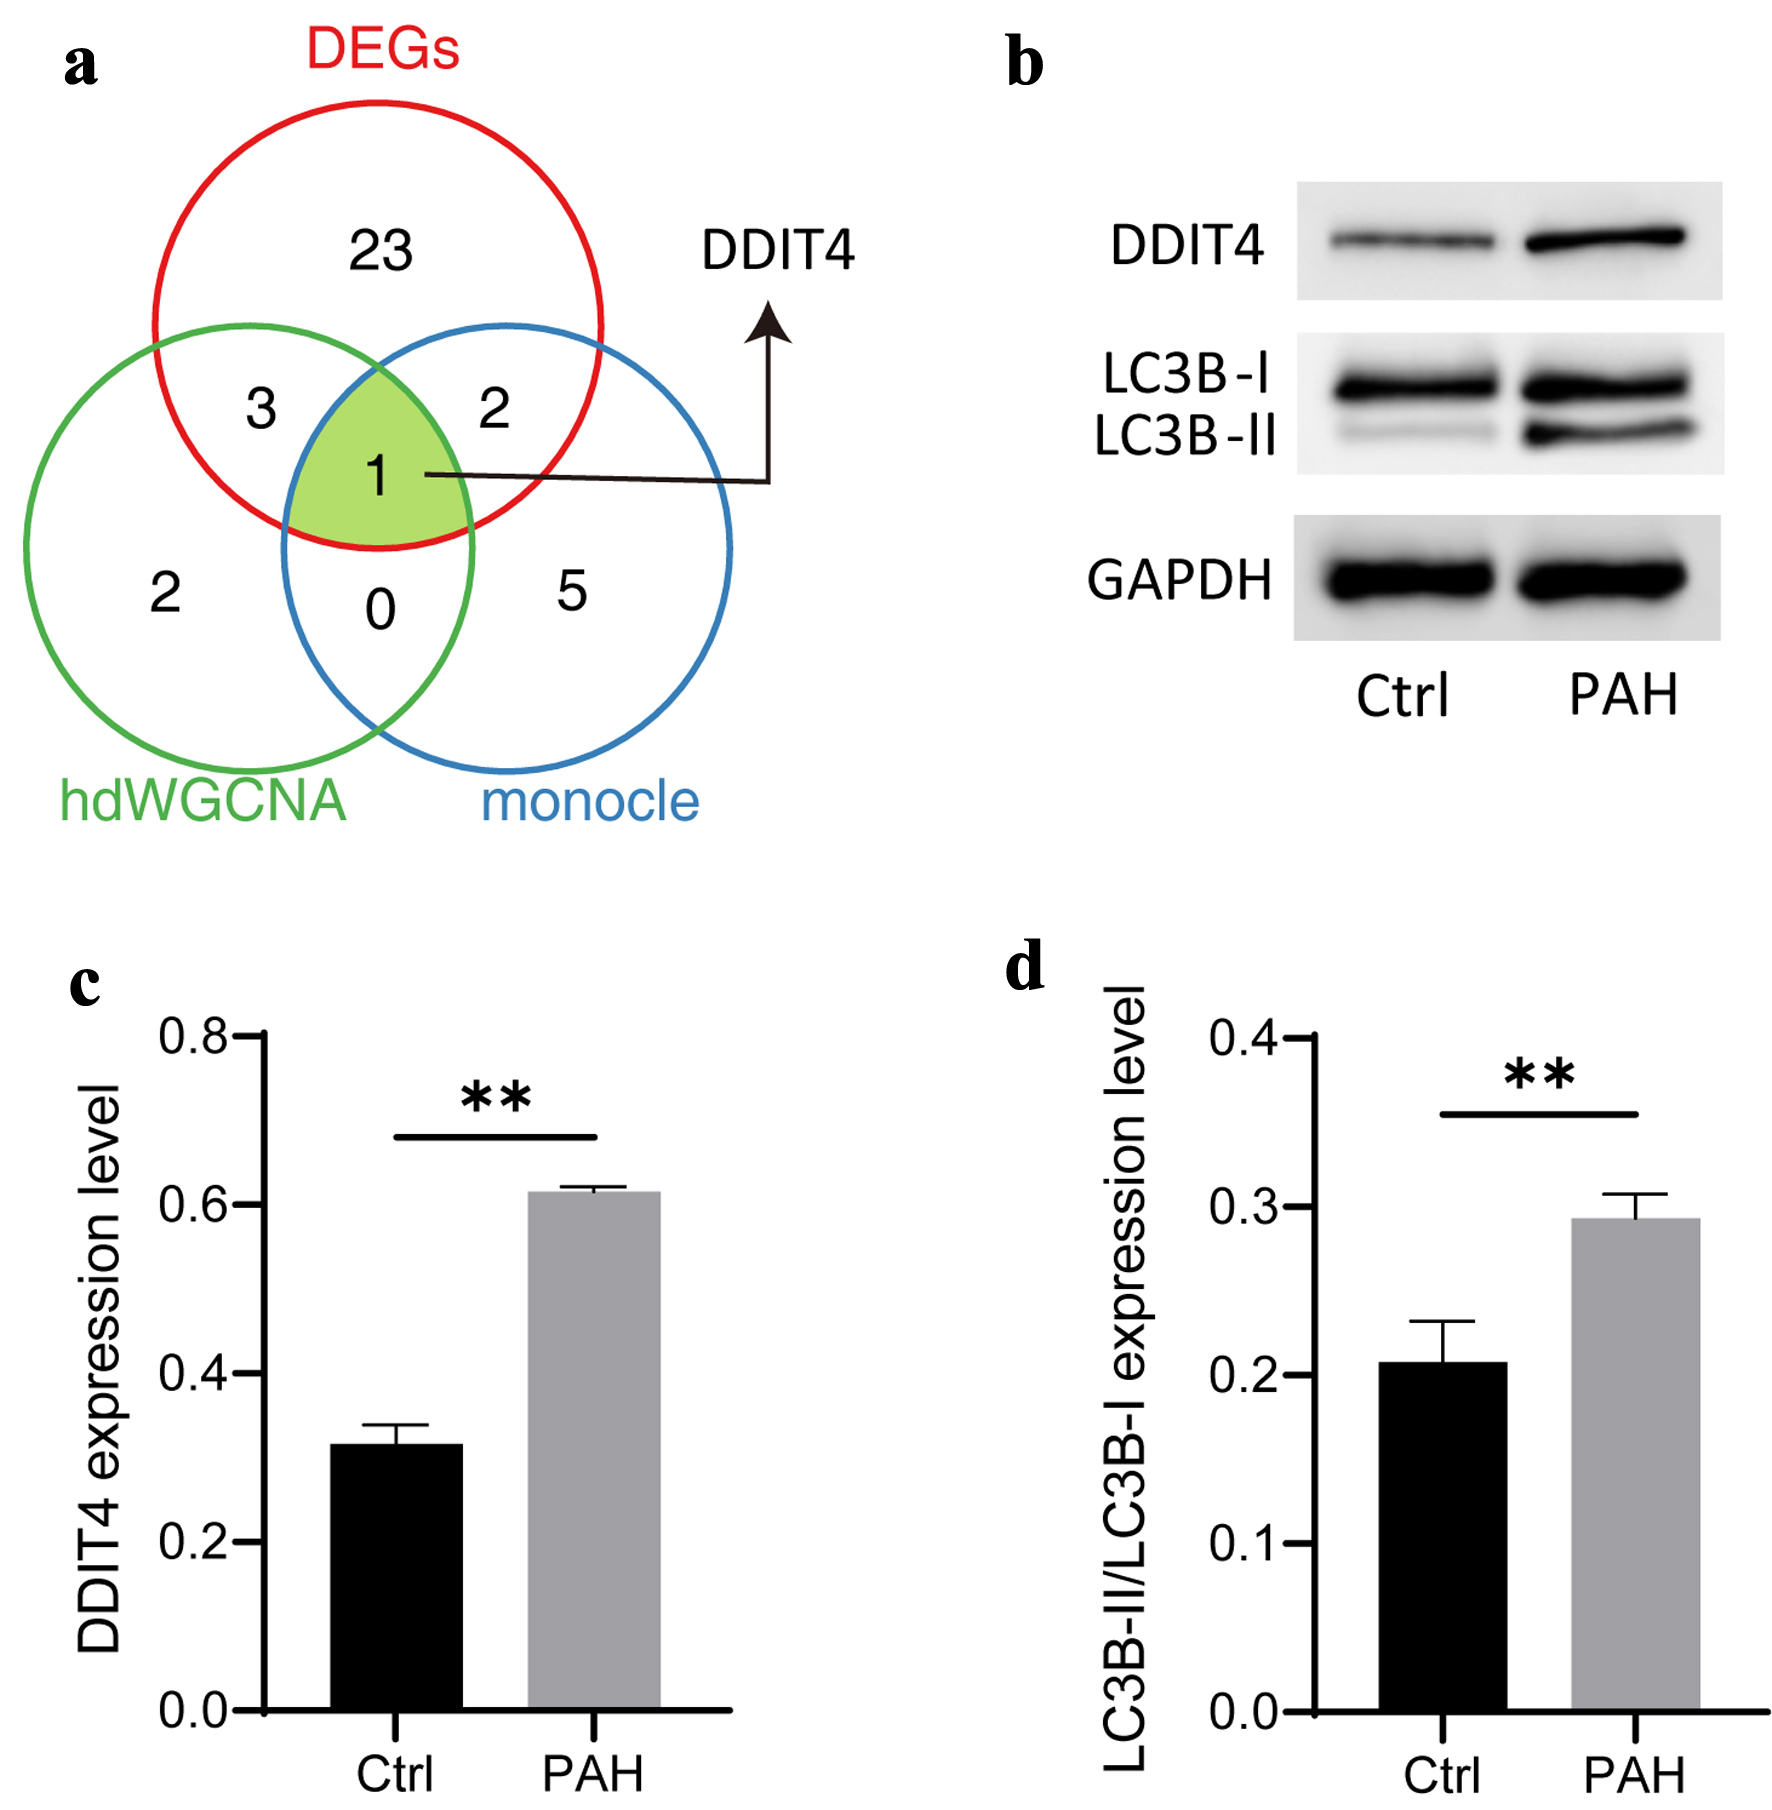
↓ Figure 6. Identification of candidate biomarkers associated autophagy-related genes. (a) Venn diagram showing the comparative analysis of different bioinformatic analysis. (b) Typical diagram of autophagy-related proteins, including DDIT4, LC3B-I, and LC3B-II. (c, d) The histogram shows the expression of autophagy-related proteins, followed by DDIT4, LC3B-II/LC3B-I. N = 3. Student’s t-test was used to identify difference. Compared to the control group, **P < 0.01.