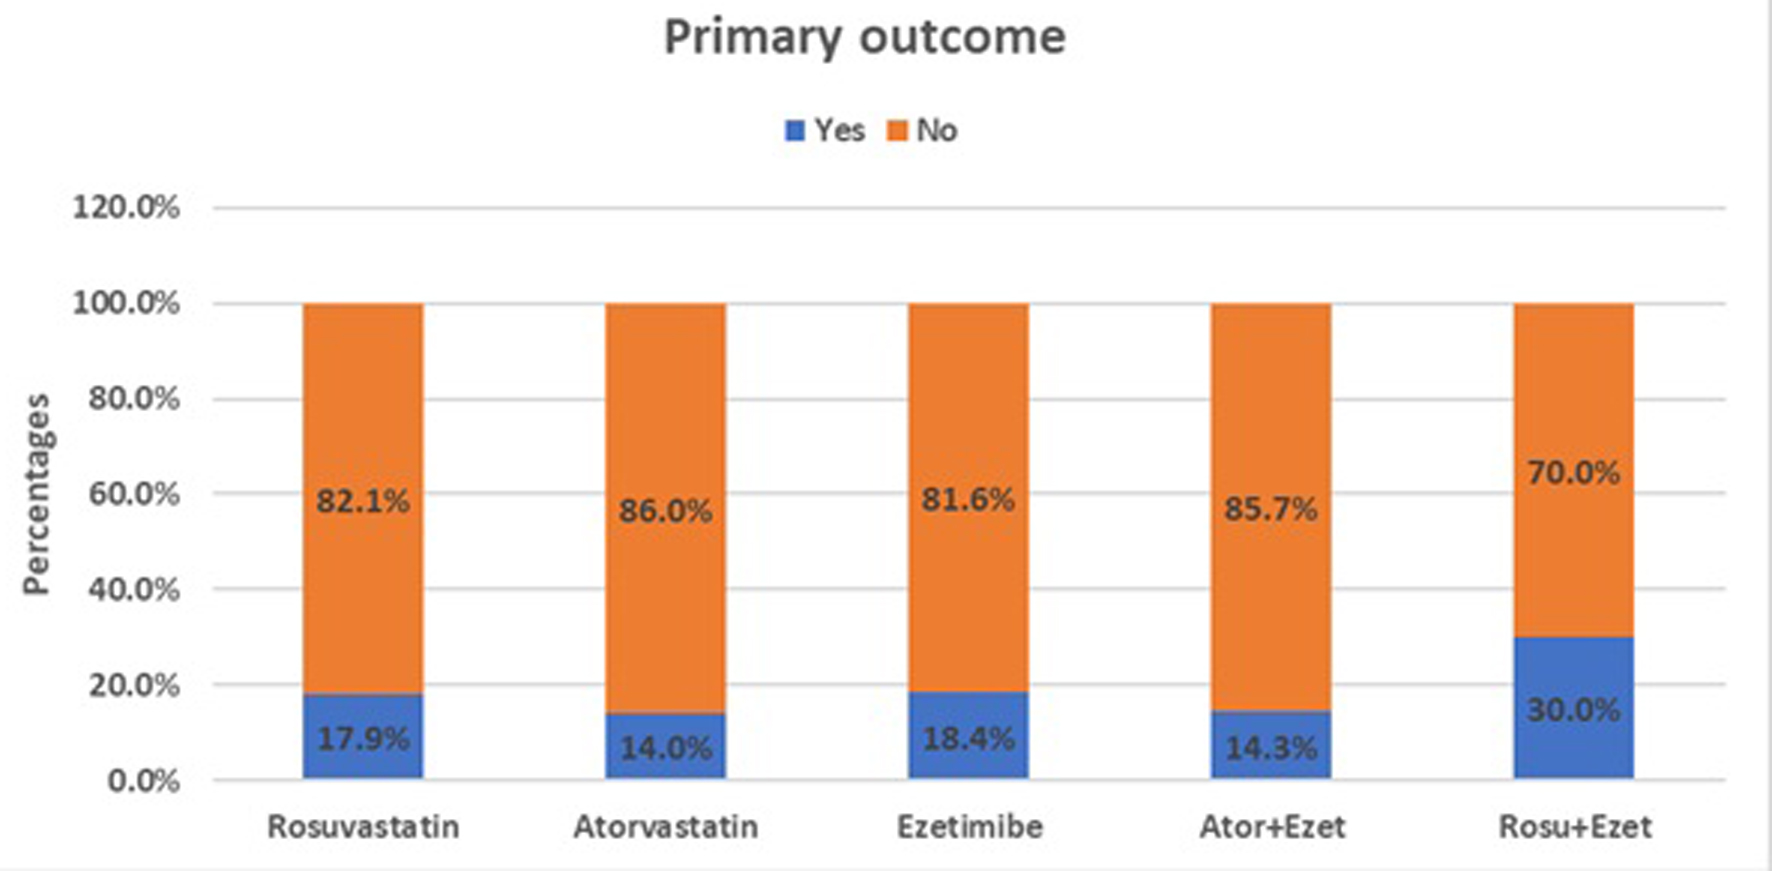
↓ Figure 1. Proportion of patients achieving the primary LDL-C target (LDL-C < 55 mg/dL and ≥ 50% reduction from baseline) across lipid-lowering therapy groups at 6 months. LDL-C: low-density lipoprotein-cholesterol.
| Cardiology Research, ISSN 1923-2829 print, 1923-2837 online, Open Access |
| Article copyright, the authors; Journal compilation copyright, Cardiol Res and Elmer Press Inc |
| Journal website https://cr.elmerpub.com |
Original Article
Volume 16, Number 3, June 2025, pages 250-258
Lipid-Lowering Therapy in Post-Acute Coronary Syndrome Patients: An Observational Study
Figure
Tables
| Demographics | N | Min | Max | Mean | SD |
|---|---|---|---|---|---|
| SD: standard deviation. | |||||
| Age | 122 | 30 | 91 | 63.48 | 10.9 |
| N | % | ||||
| Total | 122 | 100.0 | |||
| Age | |||||
| ≤ 50 years | 10 | 8.2 | |||
| 51 - 60 years | 43 | 35.2 | |||
| 61 - 70 years | 43 | 35.2 | |||
| > 70 years | 26 | 21.3 | |||
| Gender | |||||
| Male | 90 | 73.8 | |||
| Female | 32 | 26.2 | |||
| Comorbid | |||||
| Diabetes | 15 | 12.3 | |||
| Hypertension | 23 | 18.9 | |||
| Both | 73 | 59.8 | |||
| None | 11 | 9.0 | |||
| Variables | N | % |
|---|---|---|
| Rosuvastatin | 54 | 68.4 |
| Atorvastatin | 68 | 72.3 |
| Ezetimibe | 57 | 63.3 |
| Evolocumab | 0 | 0.0 |
| Alirocumab | 1 | 2.0 |
| Inclisiran | 0 | 0.0 |
| Rosuvastatin + atorvastatin | 0 | 0.0 |
| Atorvastatin + ezetimibe | 43 | 41.3 |
| Rosuvastatin + ezetimibe | 14 | 12.7 |
| Variables | N | Min | Max | Mean | SD |
|---|---|---|---|---|---|
| LDL-C: low-density lipoprotein-cholesterol; SD: standard deviation. | |||||
| Baseline LDL | 122 | 57.00 | 228.00 | 117.21 | 41.3 |
| 6-week LDL | 29 | 38.00 | 205.00 | 90.82 | 47.1 |
| 6-month LDL | 82 | 24.00 | 210.00 | 84.48 | 39.6 |
| 1-year LDL | 74 | 19.00 | 246.00 | 83.73 | 43.7 |
| N | % | ||||
| Total | 82 | 100.0 | |||
| Primary outcome (if baseline 50% reduction and less than 55 final LDL (6 months)) | |||||
| Yes | 13 | 15.9 | |||
| No | 69 | 84.1 | |||
| Variables | Total | Primary outcome | P-value | |
|---|---|---|---|---|
| Yes | No | |||
| LDL-C: low-density lipoprotein-cholesterol. | ||||
| Rosuvastatin | 39 | 7 (17.9%) | 32 (82.1%) | 0.684 |
| Atorvastatin | 43 | 6 (14.0%) | 37 (86.0%) | 0.541 |
| Ezetimibe | 38 | 7 (18.4%) | 31 (81.6%) | 0.860 |
| Atorvastatin + ezetimibe | 28 | 4 (14.3%) | 24 (85.7%) | 0.605 |
| Rosuvastatin + ezetimibe | 10 | 3 (30.0%) | 7 (70.0%) | 0.204 |
| Age | Total | Primary outcome | P-value | |
|---|---|---|---|---|
| Yes | No | |||
| aSignificant using Chi-square test at < 0.05 level. bNo statistics are computed because variable is a constant. LDL-C: low-density lipoprotein-cholesterol. | ||||
| Rosuvastatin | ||||
| ≤ 50 years | 2 | 1 (50.0%) | 1 (50.0%) | 0.386 |
| 51 - 60 years | 14 | 2 (14.3%) | 12 (85.7%) | 0.372 |
| 61 - 70 years | 17 | 2 (11.8%) | 15 (88.2%) | 0.335 |
| > 70 years | 6 | 2 (33.3%) | 4 (66.7%) | 0.505 |
| Atorvastatin | ||||
| ≤ 50 years | 5 | 1 (20.0%) | 4 (80.0%) | 0.427 |
| 51 - 60 years | 18 | 1 (5.6%) | 17 (94.4%) | 0.236 |
| 61 - 70 years | 11 | 2 (18.2%) | 9 (81.8%) | 0.308 |
| > 70 years | 9 | 2 (22.2%) | 7 (77.8%) | 0.700 |
| Ezetimibe | ||||
| ≤ 50 years | 5 | 1 (20.0%) | 4 (80.0%) | 0.427 |
| 51 - 60 years | 15 | 1 (6.7%) | 14 (93.3%) | 0.411 |
| 61 - 70 years | 12 | 3 (25.0%) | 9 (75.0%) | 0.688 |
| > 70 years | 6 | 2 (33.3%) | 4 (66.7%) | 0.197 |
| Atorvastatin + ezetimibe | ||||
| ≤ 50 years | 5 | 1 (20.0%) | 4 (80.0%) | 0.427 |
| 51 - 60 years | 11 | 1 (9.1%) | 10 (90.9%) | 0.935 |
| 61 - 70 years | 8 | 1 (12.5%) | 7 (87.5%) | 0.435 |
| > 70 years | 4 | 1 (25.0%) | 3 (75.0%) | 0.913 |
| Rosuvastatin + ezetimibe | ||||
| ≤ 50 years | 0 | 0 (0.0%) | 0 (0.0%) | N/Ab |
| 51 - 60 years | 4 | 0 (0.0%) | 4 (100.0%) | 0.454 |
| 61 - 70 years | 4 | 2 (50.0%) | 2 (50.0%) | 0.032a |
| > 70 years | 2 | 1 (50.0%) | 1 (50.0%) | 0.371 |
| Gender | Total | Primary outcome | P-value | |
|---|---|---|---|---|
| Yes | No | |||
| LDL-C: low-density lipoprotein-cholesterol. | ||||
| Rosuvastatin | ||||
| Male | 30 | 6 (20.0%) | 24 (80.0%) | 0.804 |
| Female | 9 | 1 (11.1%) | 8 (88.9%) | 0.546 |
| Atorvastatin | ||||
| Male | 31 | 5 (16.1%) | 26 (83.9%) | 0.334 |
| Female | 12 | 1 (8.3%) | 11 (91.7%) | 0.467 |
| Ezetimibe | ||||
| Male | 28 | 6 (21.4%) | 22 (78.6%) | 0.949 |
| Female | 10 | 1 (10.0%) | 9 (90.0%) | 0.424 |
| Atorvastatin + ezetimibe | ||||
| Male | 19 | 3 (15.8%) | 16 (84.2%) | 0.472 |
| Female | 9 | 1 (11.1%) | 8 (88.9%) | 0.303 |
| Rosuvastatin + ezetimibe | ||||
| Male | 9 | 3 (33.3%) | 6 (66.7%) | 0.198 |
| Female | 1 | 0 (0.0%) | 1 (100.0%) | 0.725 |
| Comorbid | Total | Primary outcome | P-value | |
|---|---|---|---|---|
| Yes | No | |||
| aNo statistics are computed because variable is a constant. LDL-C: low-density lipoprotein-cholesterol. | ||||
| Rosuvastatin | ||||
| Diabetes | 2 | 0 (0.0%) | 2 (100.0%) | 0.248 |
| Hypertension | 11 | 2 (18.2%) | 9 (81.8%) | 0.512 |
| Both | 23 | 5 (21.7%) | 18 (78.3%) | 0.422 |
| None | 3 | 0 (0.0%) | 3 (100.0%) | N/Aa |
| Atorvastatin | ||||
| Diabetes | 10 | 3 (30.0%) | 7 (70.0%) | N/Aa |
| Hypertension | 6 | 0 (0.0%) | 6 (100.0%) | 0.335 |
| Both | 22 | 2 (9.1%) | 20 (90.9%) | 0.131 |
| None | 5 | 1 (20.0%) | 4 (80.0%) | 0.408 |
| Ezetimibe | ||||
| Diabetes | 6 | 1 (16.7%) | 5 (83.3%) | 0.346 |
| Hypertension | 6 | 1 (16.7%) | 5 (83.3%) | > 0.999 |
| Both | 21 | 4 (19.0%) | 17 (81.0%) | 0.785 |
| None | 5 | 1 (20.0%) | 4 (80.0%) | 0.408 |
| Atorvastatin + ezetimibe | ||||
| Diabetes | 5 | 1 (20.0%) | 4 (80.0%) | 0.621 |
| Hypertension | 2 | 0 (0.0%) | 2 (100.0%) | 0.551 |
| Both | 16 | 2 (12.5%) | 14 (87.5%) | 0.549 |
| None | 5 | 1 (20.0%) | 4 (80.0%) | 0.408 |
| Rosuvastatin + ezetimibe | ||||
| Diabetes | 1 | 0 (0.0%) | 1 (100.0%) | 0.571 |
| Hypertension | 4 | 1 (25.0%) | 3 (75.0%) | 0.469 |
| Both | 5 | 2 (40.0%) | 3 (60.0%) | 0.126 |
| None | 0 | 0 (0.0%) | 0 (0.0%) | N/Aa |