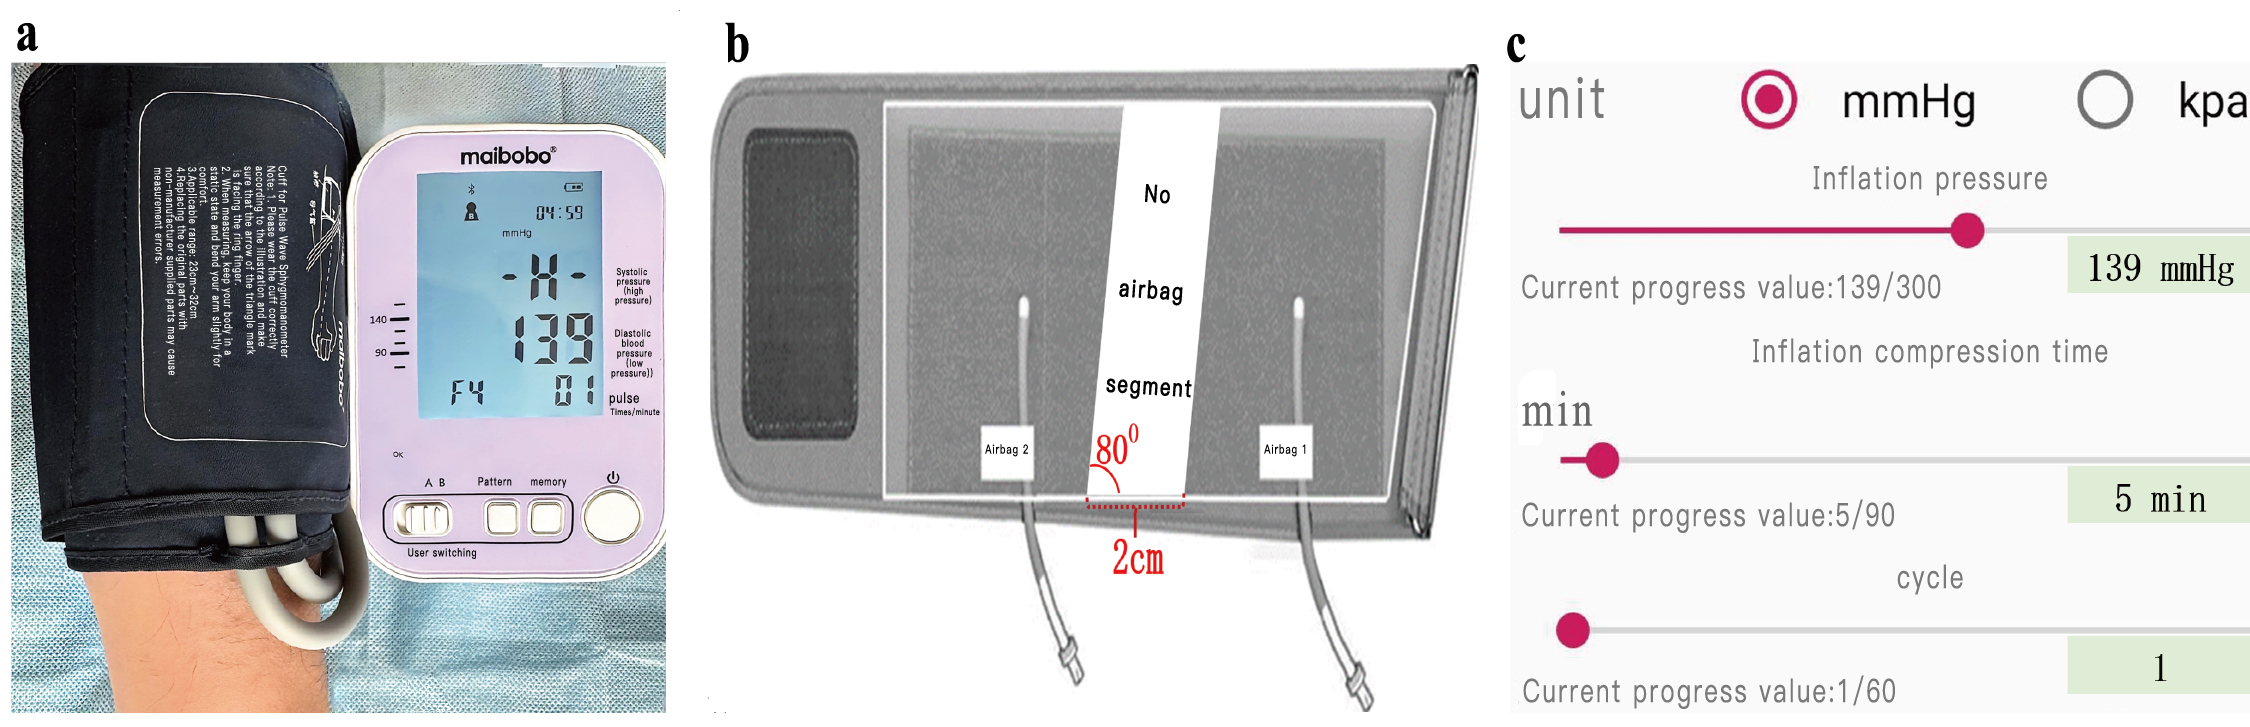
↓ Figure 1. Related equipment and operating procedures. (a) Custom sphygmomanometer. (b) Custom dual airbag hollow cuff. (c) Pre-set use of the app.
| Cardiology Research, ISSN 1923-2829 print, 1923-2837 online, Open Access |
| Article copyright, the authors; Journal compilation copyright, Cardiol Res and Elmer Press Inc |
| Journal website https://cr.elmerpub.com |
Original Article
Volume 16, Number 4, August 2025, pages 338-345
Effect of Hyperperfusion on Successful Collection of Arterial Blood Gas Specimens in Patients With Acute Heart Failure
Figures
Tables
| Variables | Non-hyperperfusion group (n = 325) | Hyperperfusion group (n = 223) | Statistic | P |
|---|---|---|---|---|
| t: t-test; χ2: Chi-square test. | ||||
| Male, n (%) | 199 (61.2) | 150 (67.3) | χ2 = 2.082 | 0.149 |
| Age (years) | 70.83 ± 10.54 | 71.25 ± 10.61 | t = -0.457 | 0.648 |
| Hypertension, n (%) | 234 (72.0) | 145 (65.0) | χ2 = 3.019 | 0.082 |
| Atrial fibrillation, n (%) | 61 (18.8) | 35 (15.7) | χ2 = 0.865 | 0.352 |
| Diabetes, n (%) | 70 (21.5) | 37 (16.6) | χ2 = 2.059 | 0.151 |
| Blood platelet count (× 109/L) | 201.28 ± 32.52 | 197.87 ± 31.63 | t = 1.219 | 0.223 |
| Variables | Non-hyperperfusion group (n = 325) | Hyperperfusion group (n = 223) | Statistic | P |
|---|---|---|---|---|
| t: t-test; χ2: Chi-square test. | ||||
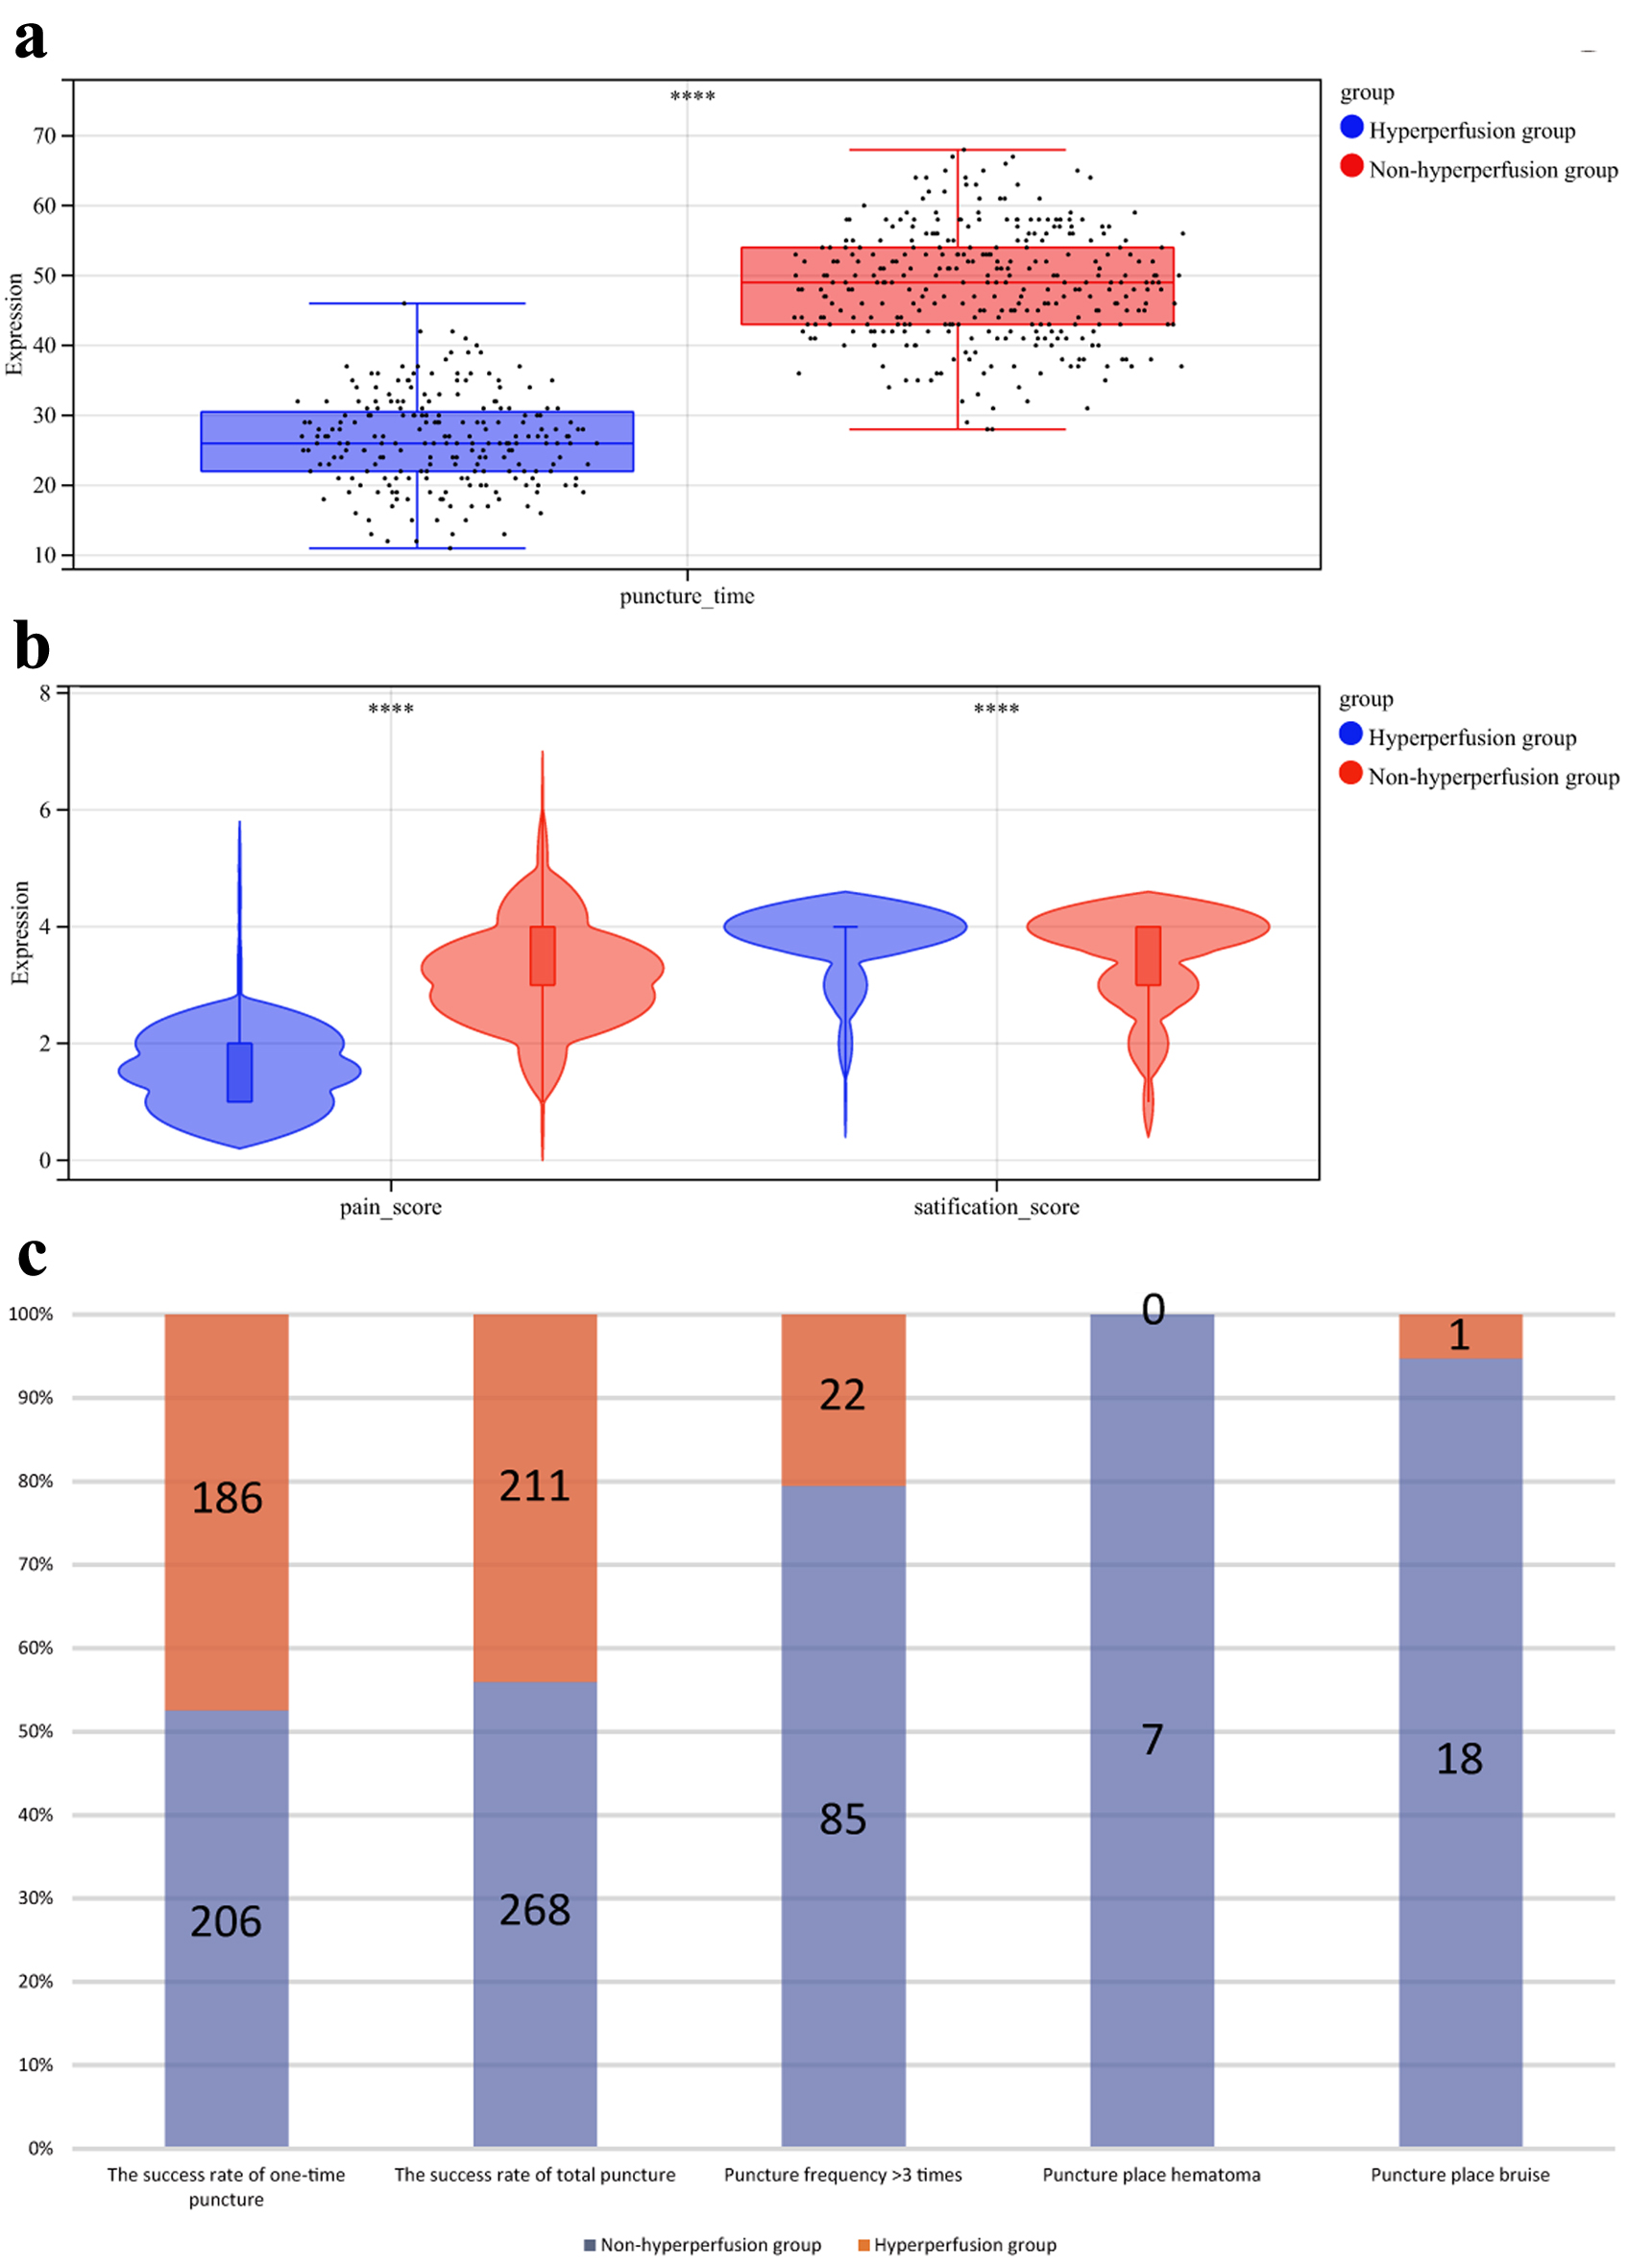
| The success rate of one-time puncture, n (%) | 206 (63.4) | 186 (83.4) | χ2 = 26.040 | < 0.001 |
| The success rate of total puncture, n (%) | 268 (82.5) | 211 (94.6) | χ2 = 17.761 | < 0.001 |
| Puncture frequency > 3 times, n (%) | 85 (26.2) | 22 (9.9) | χ2 = 22.331 | < 0.001 |
| Puncture time (s) | 48.59 ± 7.83 | 26.43 ± 6.44 | t = 34.925 | < 0.001 |
| Variables | Non-hyperperfusion group (n = 325) | Hyperperfusion group (n = 223) | Statistic | P |
|---|---|---|---|---|
| Z: Mann-Whitney U test; χ2: Chi-square test. | ||||
| Pain scores | 3.0 (3.0, 4.0) | 2.0 (1.0, 2.0) | Z = -18.619 | < 0.001 |
| Puncture place hematoma, n (%) | - | 0.045 | ||
| Yes | 7 (2.2) | 0 (0.0) | ||
| No | 318 (97.8) | 223 (100.0) | ||
| Puncture place bruise, n (%) | χ2 = 10.238 | < 0.001 | ||
| Yes | 18 (5.5) | 1 (0.4) | ||
| No | 307 (94.5) | 222 (99.6) | ||
| Variables | Non-hyperperfusion group (n = 325) | Hyperperfusion group (n = 223) | Statistic | P |
|---|---|---|---|---|
| Z: Mann-Whitney U test. | ||||
| Satisfaction, n (%) | Z = -4.795 | < 0.001 | ||
| Very satisfied | 201 (61.8) | 180 (80.7) | ||
| Satisfied | 83 (25.5) | 32 (14.3) | ||
| Basic satisfied | 33 (10.2) | 10 (4.5) | ||
| Dissatisfied | 8 (2.5) | 1 (0.4) | ||