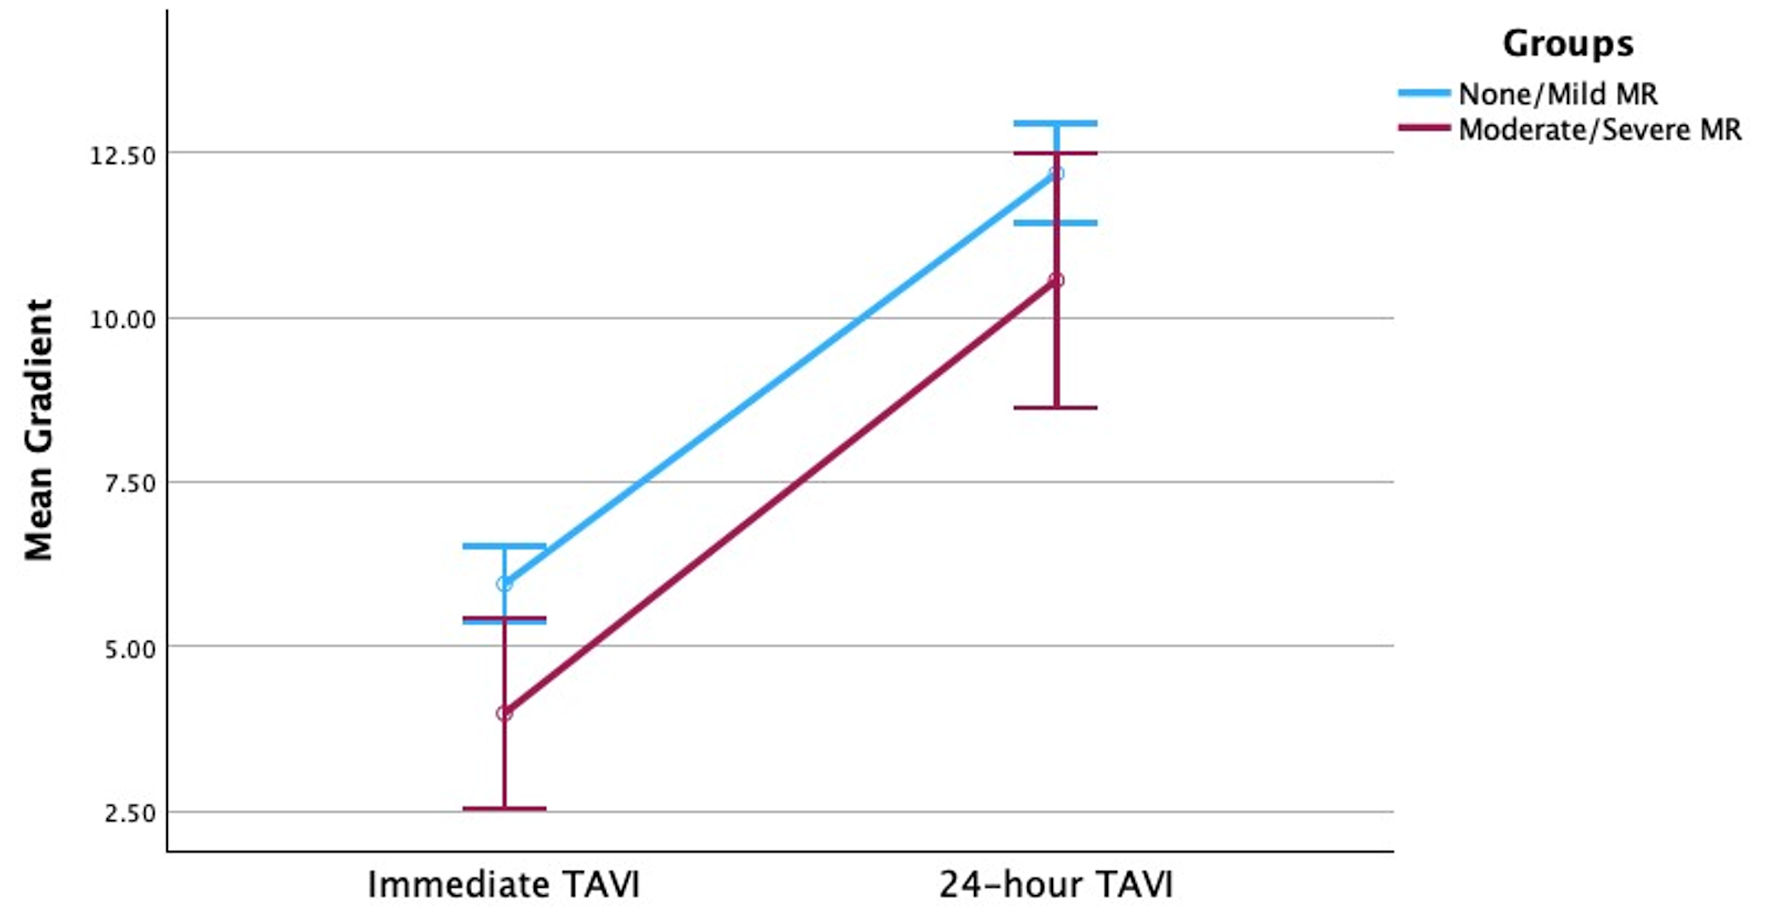
↓ Figure 1. Change in transvalvular mean gradient across time for patients with no-to-mild MR and patients with moderate-to-severe MR. MR: mitral regurgitation; TAVI: transcatheter aortic valve implantation.
| Cardiology Research, ISSN 1923-2829 print, 1923-2837 online, Open Access |
| Article copyright, the authors; Journal compilation copyright, Cardiol Res and Elmer Press Inc |
| Journal website https://cr.elmerpub.com |
Original Article
Volume 16, Number 4, August 2025, pages 312-320
Increase in Aortic Valve Mean Gradients One Day After Transcatheter Aortic Valve Implantation: The Role of Mitral Regurgitation
Figures
Tables
| Baseline clinical characteristics of the patients | No-to-mild MR (n = 327) | Moderate-to-severe MR (n = 51) | P value |
|---|---|---|---|
| Data are expressed as median (IQR, 25th - 75th percentile) or proportion (percentages). P < 0.05 indicates the difference between the two groups is statistically significant. BMI: body mass index; CABG: coronary artery bypass grafting; COPD: chronic obstructive pulmonary disease; MR: mitral regurgitation; NYHA: New York Heart Association; TAVI: transcatheter aortic valve implantation; TIA: transient ischemic attack; IQR: interquartile range. | |||
| Age (years) | 77 (71 - 84) | 79 (76 - 85) | 0.01 |
| Gender (male) | 177 (54.1%) | 29 (56.9%) | 0.01 |
| Clinical history | |||
| Diabetes mellitus | 160 (48.9%) | 22 (43.1%) | 0.44 |
| Hypertension | 292 (89.3%) | 48 (94.1%) | 0.29 |
| Hyperlipidemia | 270 (82.6%) | 40 (78.4%) | 0.47 |
| Peripheral vascular disease | 102 (31.2%) | 15 (29.4%) | 0.80 |
| Stroke/TIA | 54 (16.5%) | 14 (27.5%) | 0.06 |
| COPD | 72 (22%) | 10 (19.6%) | 0.70 |
| Atrial fibrillation | 102 (31.2%) | 23 (45.1%) | 0.05 |
| Previous permanent pacemaker | 38 (11.6%) | 10 (19.6%) | 0.11 |
| Chronic kidney disease | 155 (47.4%) | 33 (64.7%) | 0.02 |
| Coronary artery disease | 210 (64.2%) | 35 (68.6%) | 0.54 |
| Previous myocardial infarction | 72 (22%) | 8 (15.7%) | 0.30 |
| Previous CABG | 64 (19.6%) | 20 (39.2%) | 0.002 |
| Obstructive sleep apnea | 70 (21.4%) | 7 (13.7%) | 0.21 |
| BMI (kg/m2) | 29 (25 - 34.7) | 26.37 (23.96 - 30) | 0.002 |
| NYHA class III-IV symptoms | 309 (94.8%) | 48 (94.1%) | 0.96 |
| CHA2DS2-VASc score | 4 (4 - 5) | 5 (4 - 6) | 0.002 |
| Type of TAVI valve | |||
| SAPIEN | 34 (10.4%) | 9 (17.6%) | 0.19 |
| SAPIEN XT | 3 (0.9%) | 2 (3.9%) | 0.19 |
| SAPIEN 3 | 286 (87.5%) | 40 (78.5%) | 0.19 |
| SAPIEN 3 Ultra | 4 (1.2%) | 0 | 0.19 |
| Low-flow state factors | No-to-mild MR (n = 327) | Moderate-to-severe MR (n = 51) | P value |
|---|---|---|---|
| Data are expressed as median (IQR, 25th - 75th percentile) or proportion (percentages). P < 0.05 indicates the difference between the two groups is statistically significant. MR: mitral regurgitation; TAVI: transcatheter aortic valve implantation; IQR: interquartile range. | |||
| Volume status | |||
| Pre-TAVI weight (kg) | 83.9 (71 - 99.2) | 75.7 (65.8 - 88.3) | 0.005 |
| Post-TAVI weight (kg) | 84.1 (70.48 - 100) | 76.2 (65 - 90) | 0.006 |
| Pre-TAVI systolic blood pressure (mm Hg) | 155 (139 - 173) | 146 (129 - 163.5) | 0.055 |
| Pre-TAVI diastolic blood pressure (mm Hg) | 67 (59 - 76.5) | 64 (55 - 74.5) | 0.175 |
| Immediate post-TAVI systolic blood pressure (mm Hg) | 126 (114 - 141.5) | 130 (118.5 - 139} | 0.62 |
| Immediate post-TAVI diastolic blood pressure (mm Hg) | 54 (47 - 62.5) | 54 (46 - 63.5) | 0.813 |
| 24-h post-TAVI systolic blood pressure (mm Hg)) | 127 (115 - 138) | 124 (118 - 139) | 0.664 |
| 24-h post-TAVI diastolic blood pressure (mm Hg)) | 57 (50 - 65) | 56 (46 - 64.5) | 0.451 |
| Peri-procedural fluids (mL) | 575 (200 - 800) | 550 (125.5 - 950) | 0.411 |
| Post-procedural fluids (mL) | 394 (0 - 970) | 450 (0 - 1,050) | 0.869 |
| Medications | |||
| Total fentanyl dose (mg) | 100 (50 - 250) | 100 (50 - 250) | 0.733 |
| Total propofol dose (g) | 0 | 0 | 0.945 |
| Total versed dose (g) | 1 (0 - 2) | 1 (0 - 2) | 0.587 |
| Total dexmedetomidine dose (µg) | 16.8 (0 - 83.35) | 26.5 (0 - 63.45) | 0.669 |
| Echocardiographic characteristics of the patients | No-to-mild MR (n = 327) | Moderate-to-severe MR (n = 51) | P value |
|---|---|---|---|
| Data are expressed as median (IQR, 25th - 75th percentile) or proportion (percentages). P < 0.05 indicates the difference between the two groups is statistically significant. MR: mitral regurgitation; TAVI: transcatheter aortic valve implantation; IQR: interquartile range. | |||
| Pre-TAVI | |||
| Left ventricular ejection fraction (%) | 58 (55 - 62.5) | 51 (45 - 57.1) | < 0.001 |
| Aortic valve area (cm2) | 0.78 (0.66 - 0.90) | 0.77 (0.69 - 0.85) | 0.002 |
| Aortic valve mean gradient (mm Hg) | 41.1 (32.9 - 48.11) | 34.5 (24.3 - 45) | 0.017 |
| Immediate post-TAVI | |||
| Transvalvular mean gradient (mm Hg) | 4.5 (3 - 6) | 3.3 (2.5 - 4.7) | < 0.001 |
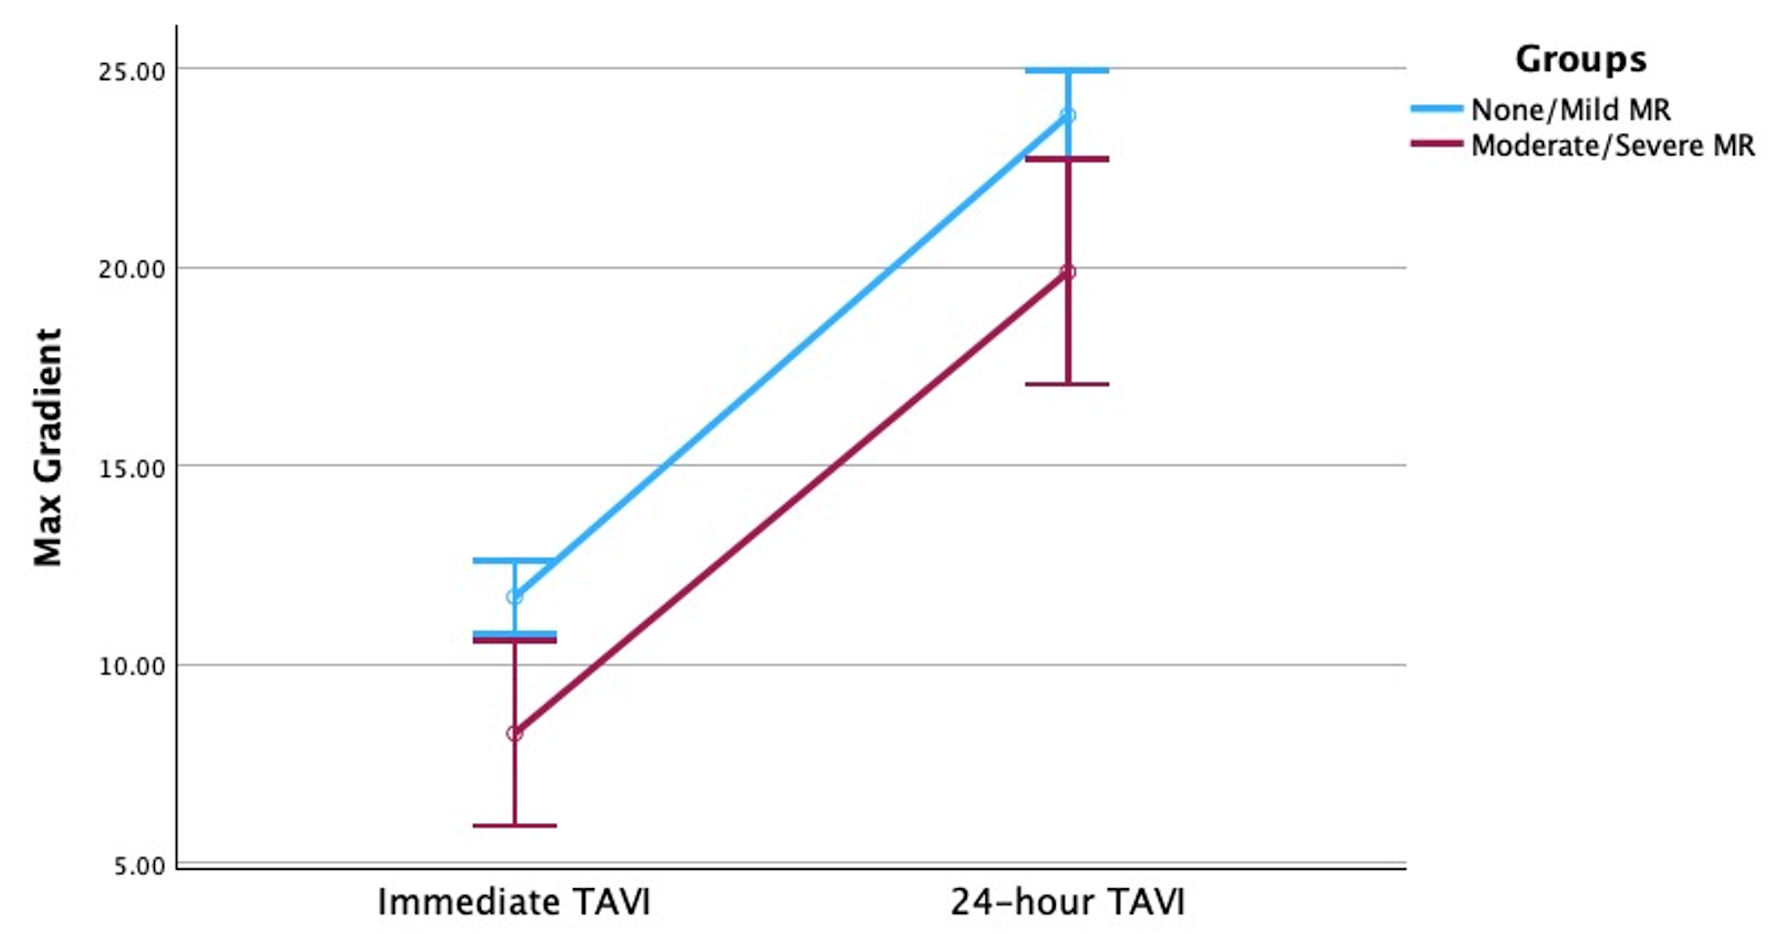
| Transvalvular peak gradient (mm Hg) | 9.4 (7 - 13) | 7 (5.9 - 10) | < 0.001 |
| 24-h post-TAVI | |||
| Transvalvular mean gradient (mm Hg) | 11 (8 - 14.7) | 9.05 (7 - 13) | < 0.001 |
| Transvalvular peak gradient (mm Hg) | 22 (16.3 - 29.1) | 18 (13.4 - 24.3) | < 0.001 |
| Deltas (24-h - immediate) | |||
| Transvalvular mean gradient delta (mm Hg) | 6 (3.7 - 9) | 6 (3.4 - 9) | 0.87 |
| Transvalvular peak gradient delta (mm Hg) | 12.2 (6.8 - 18) | 12 (5.5 - 15.9) | 0.41 |
| MR severity quantification by TTE | Pre-TAVI | Post-TAVI | P value |
|---|---|---|---|
| Quantitative metrics include MR vena contracta, EROA measured by both PISA and continuity methods, and regurgitant volume. In the no-to-mild MR group, quantitative values are uniformly reported below ASE guideline-based thresholds for moderate MR due to the absence of sufficiently measurable MR jets, a limitation inherent to the minimal severity in this cohort. As such, statistical comparisons are not applicable for this group. In contrast, patients with moderate-to-severe MR demonstrated significant reductions in all quantitative parameters post-TAVI. Data are expressed as median (IQR, 25th - 75th percentile) or proportion (percentages). P < 0.05 indicates the difference between the two groups is statistically significant. EROA: effective regurgitant orifice area; TTE: transthoracic echocardiogram; MR: mitral regurgitation; PISA: proximal isovelocity surface area; TAVI: transcatheter aortic valve implantation; ASE: American Society of Echocardiography; IQR: interquartile range. | |||
| No-to-mild MR patients (n = 327) | |||
| MR vena contracta (cm) | < 0.30 | < 0.30 | - |
| MR EROA - PISA (cm2) | < 0.20 | < 0.20 | - |
| MR EROA - continuity (cm2) | < 0.20 | < 0.20 | - |
| Regurgitant volumes (mL) | < 30 | < 30 | - |
| Moderate-to-severe MR patients (n = 51) | |||
| MR vena contracta (cm) | 0.50 (0.41 - 0.71) | 0.3 (0.30 - 0.30) | < 0.001 |
| MR EROA - PISA (cm2) | 0.40 (0.34 - 0.57) | 0.20 (0.20 - 0.20) | < 0.001 |
| MR EROA - continuity (cm2) | 0.41 (0.35 - 0.61) | 0.20 (0.20 - 0.20) | < 0.001 |
| Regurgitant volumes (mL) | 73.94 (58.26 - 114.61) | 30 (30 - 30) | < 0.001 |