Figures
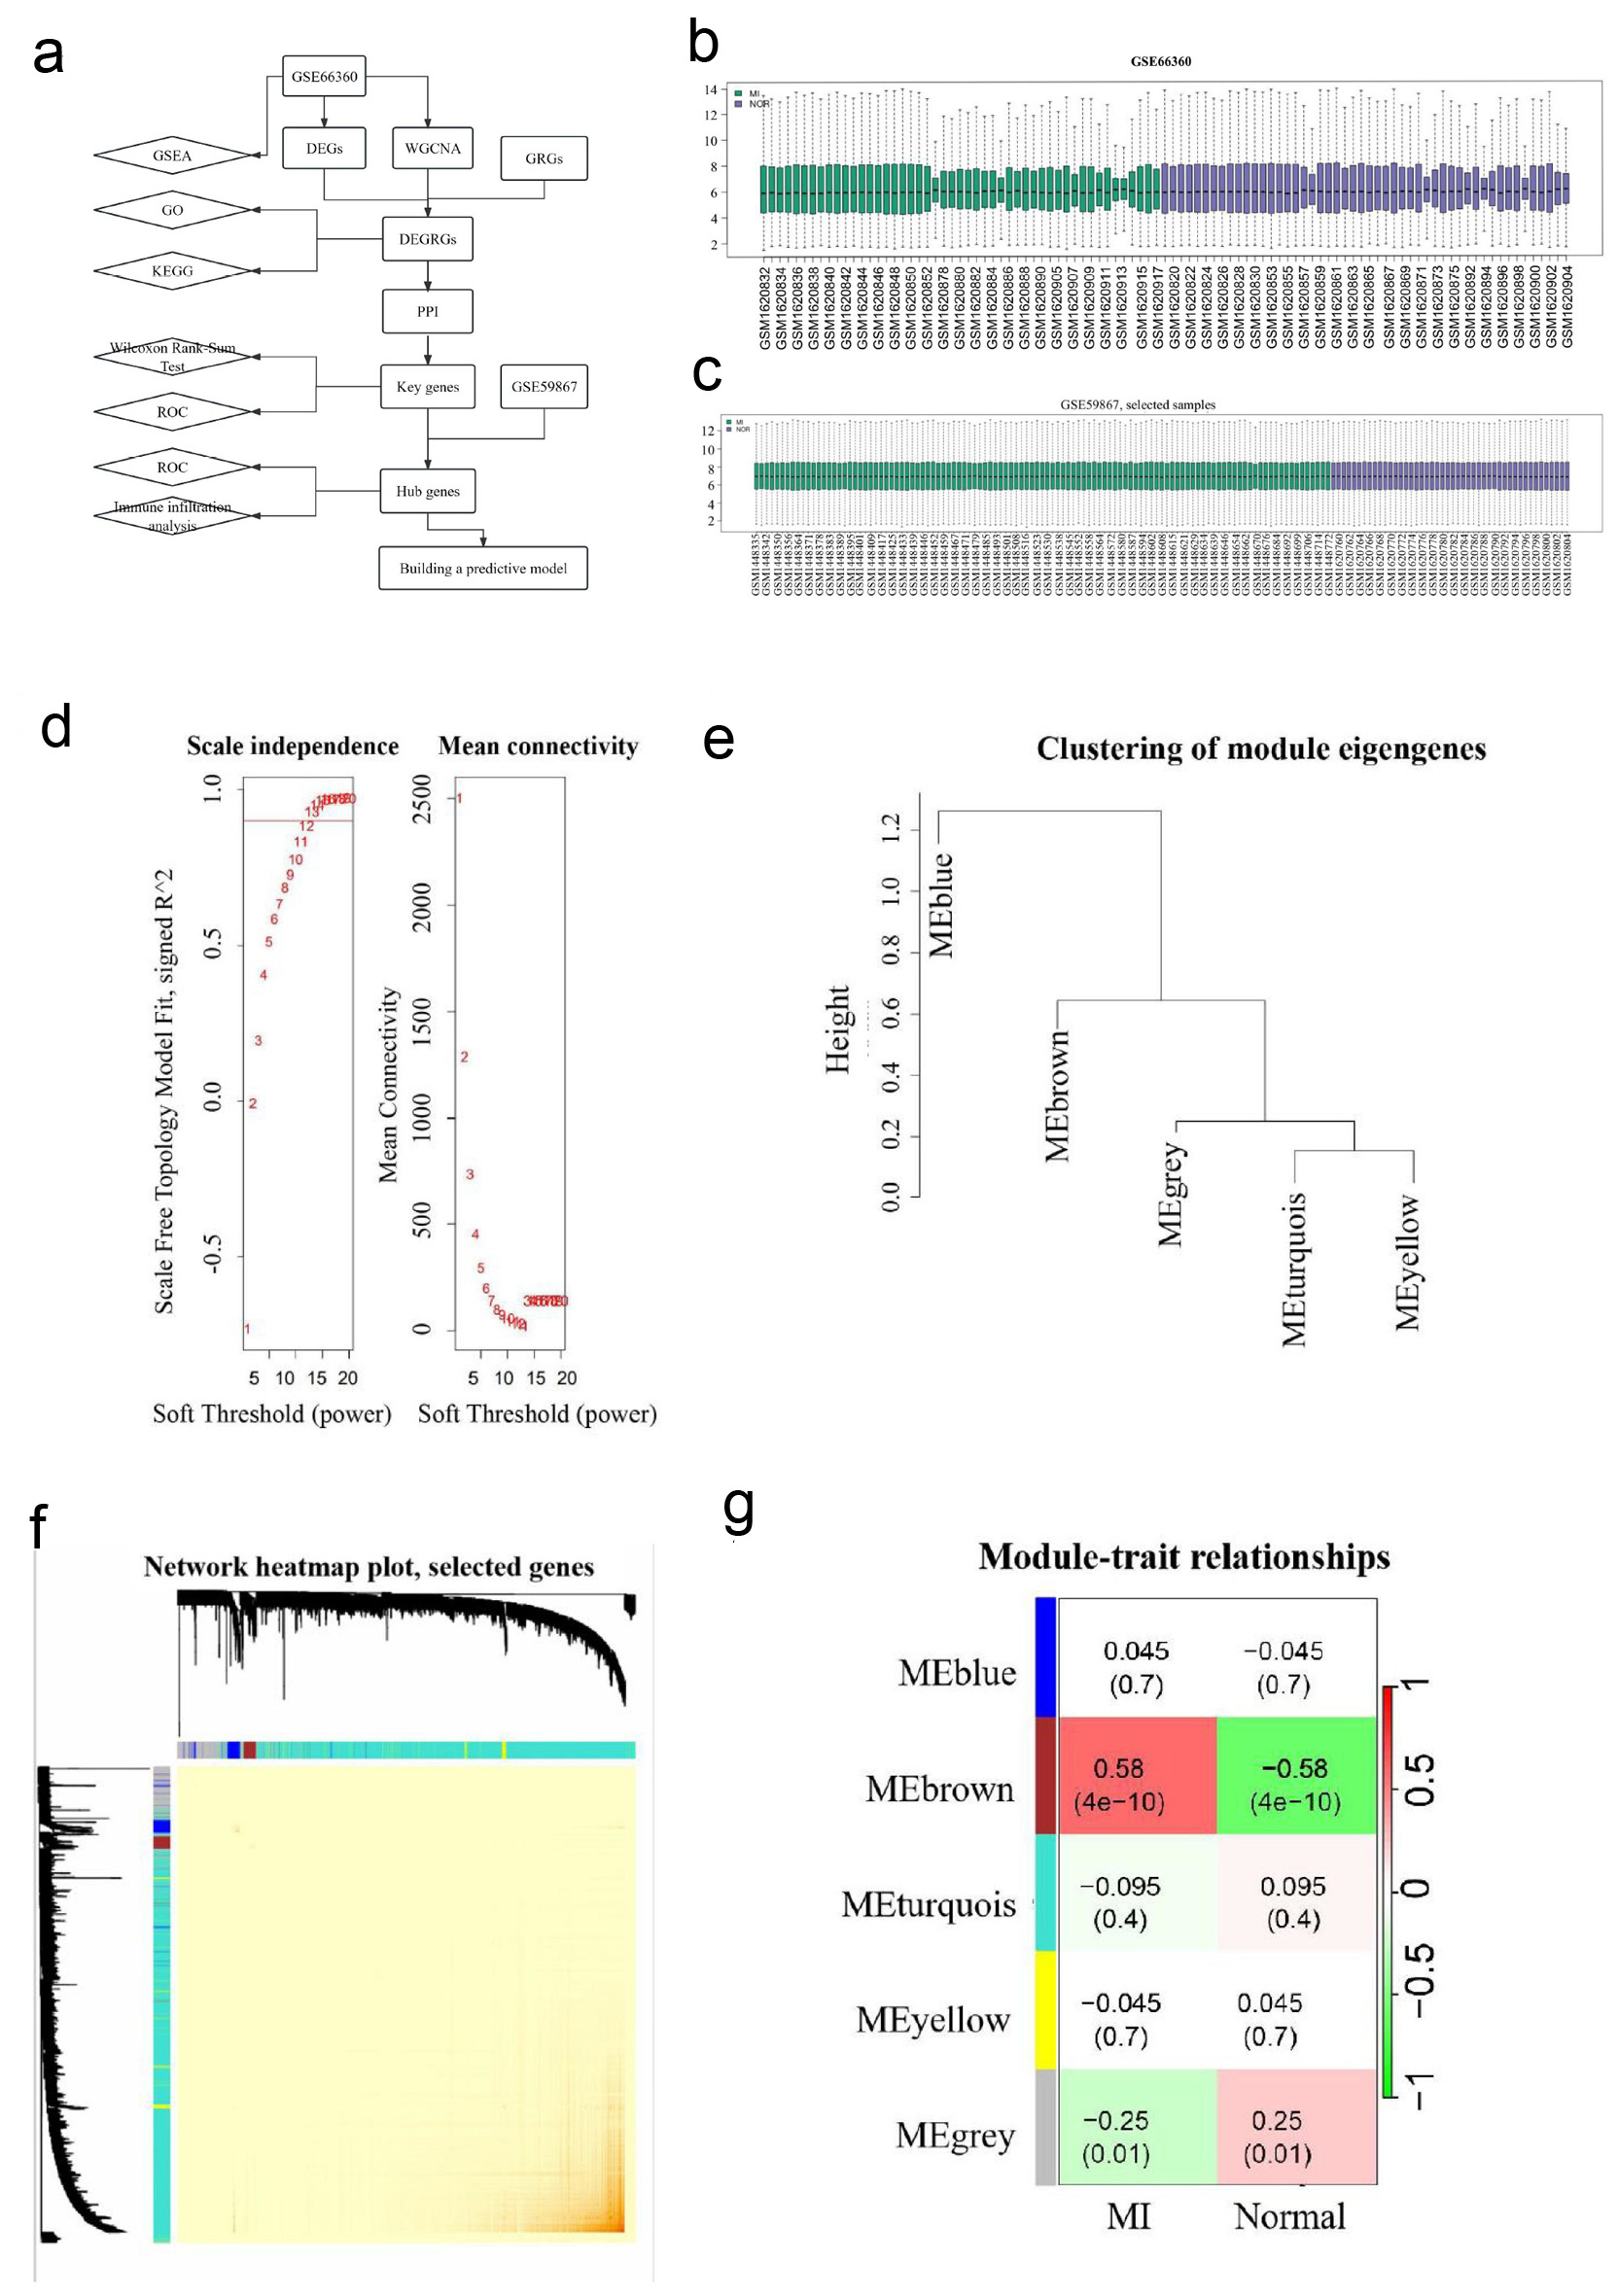
↓ Figure 1. WGCNA analysis. (a) A flow diagram of using a multi-step strategy to select hub genes of AMI in GSE66360 dataset and DEGRGs, and carry out multi-step validation. (b) Data quality evaluation of GSE66360 datasets. (c) Data quality evaluation of GSE59867 dataset. (d) Analysis scale free topology fitting index and connectivity, 12 is the optimal soft threshold. (e) Clustering diagram of module feature genes. (f) Clustering dendrogram of genes, with dissimilarity based on the topological overlap. The saddlebrown module was considered to be the most relevant to AMI. (g) A heatmap of the correlation between different color modules and clinical traits. WGCNA revealed that genes contained in the saddlebrown module were maximally associated with AMI. WGCNA: weighted gene co-expression network analysis; AMI: acute myocardial infarction; DEGRGs: differentially expressed glycolysis related genes; GRG: glycolysis-related gene; PPI: protein-protein interaction; GSEA: gene set enrichment analysis; GO: Gene Ontology; KEGG: Kyoto Encyclopedia of Genes and Genomes; ROC: receiver operating characteristic.
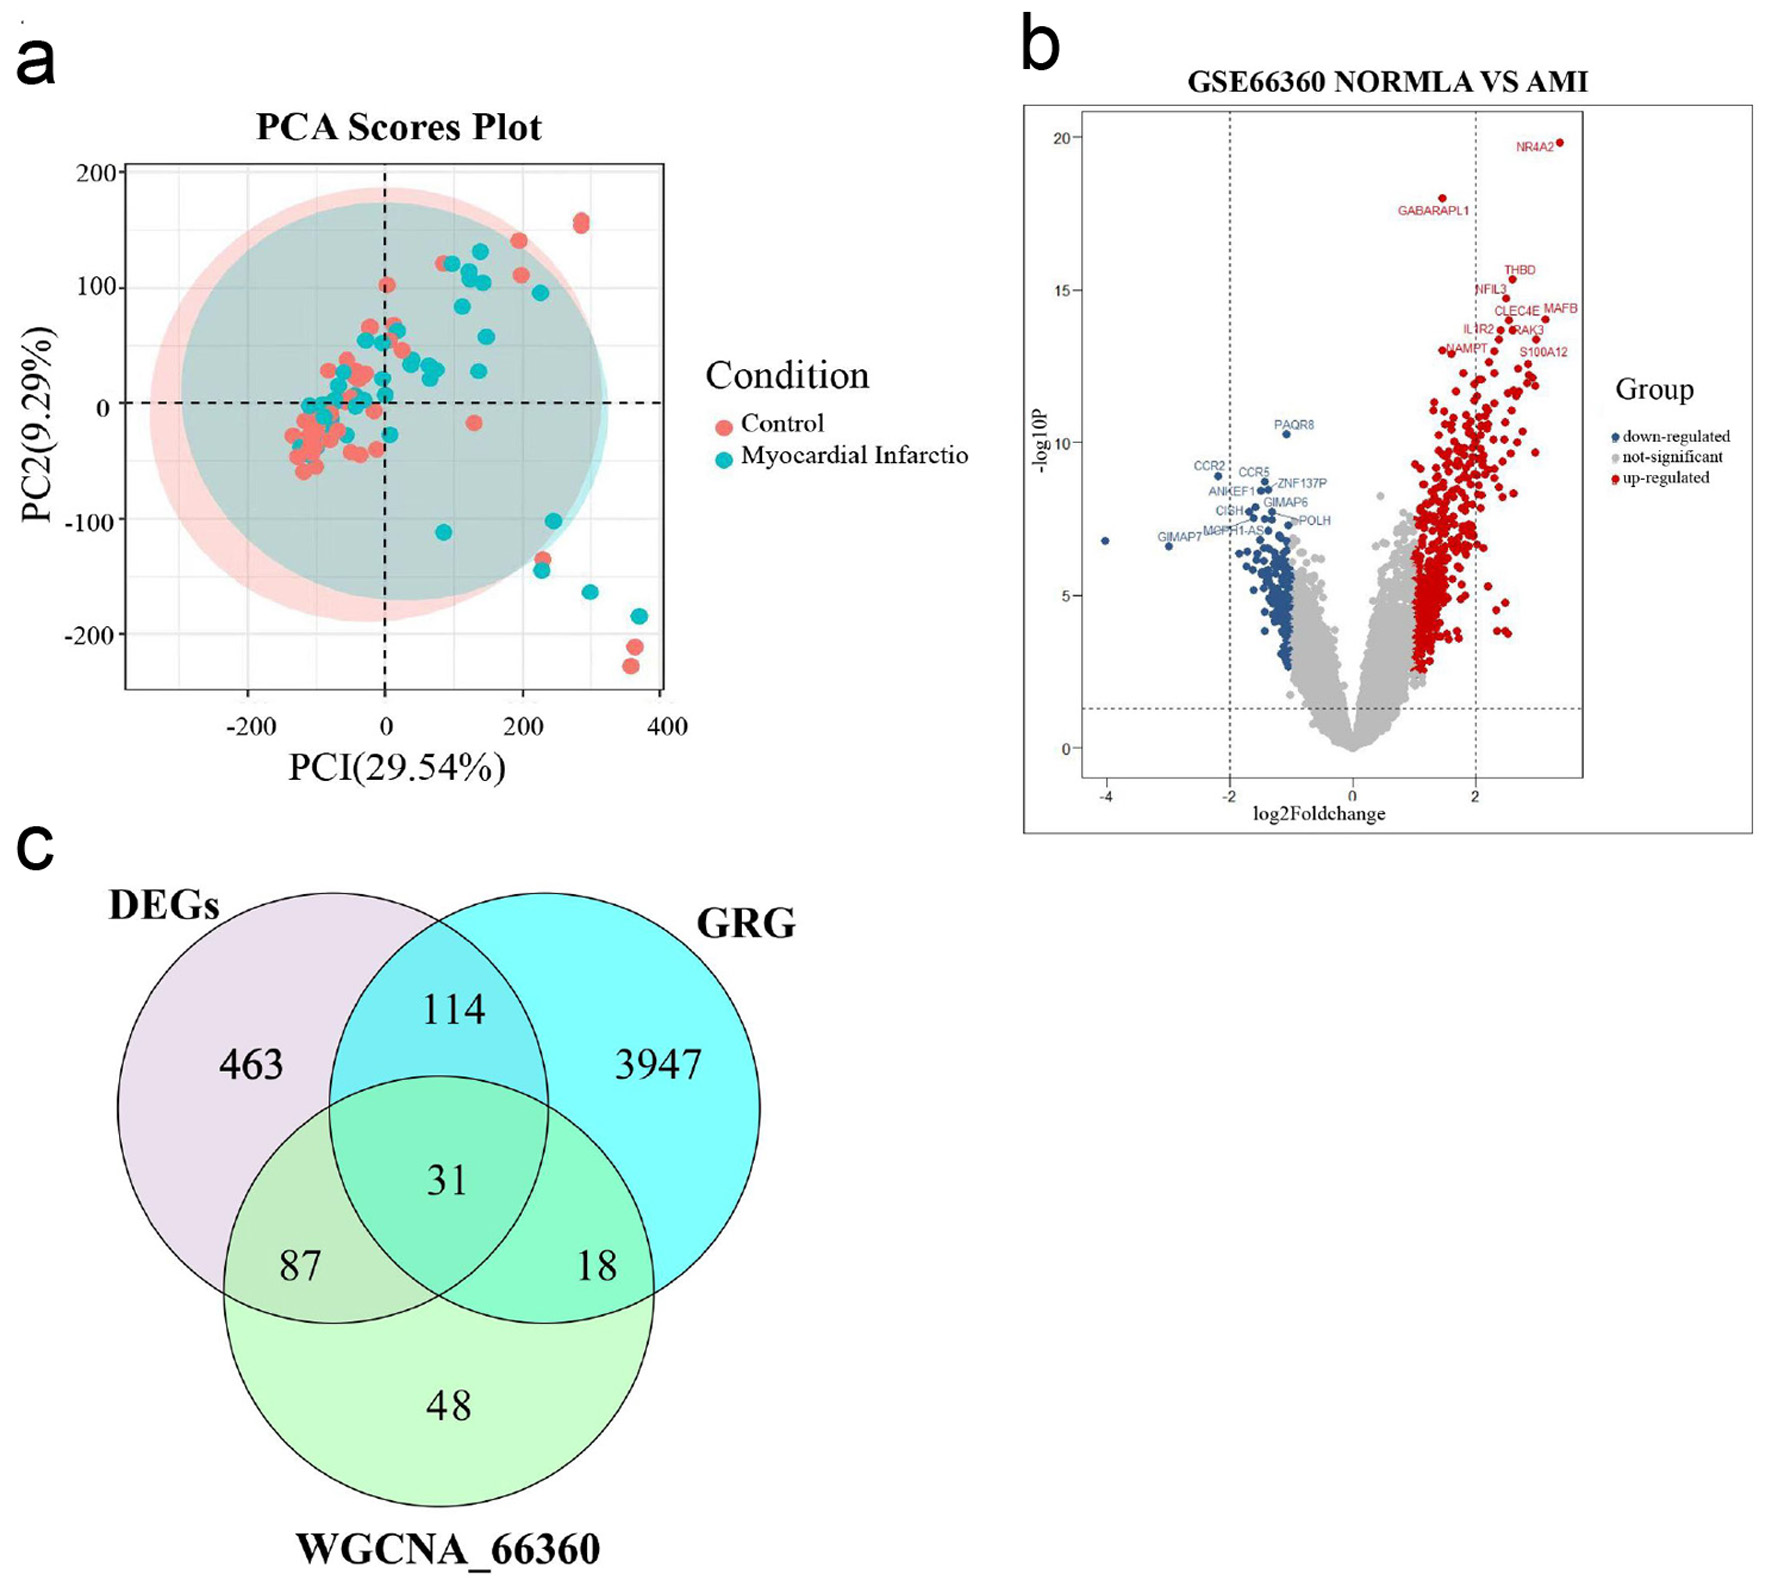
↓ Figure 2. Select DEGRGs. (a) PCA of AMI group and healthy control group. (b) A volcano plot of difference analysis between AMI group and healthy control group in GSE66360. (c) Venn diagram of intersecting genes in DEGs, WGCNA_GSE66360, GRG. DEGRGs: differentially expressed glycolysis related genes; PCA: principal component analysis; AMI: acute myocardial infarction; DEGs: differentially expressed genes; GRG: glycolysis-related gene; WGCNA: weighted gene co-expression network analysis.
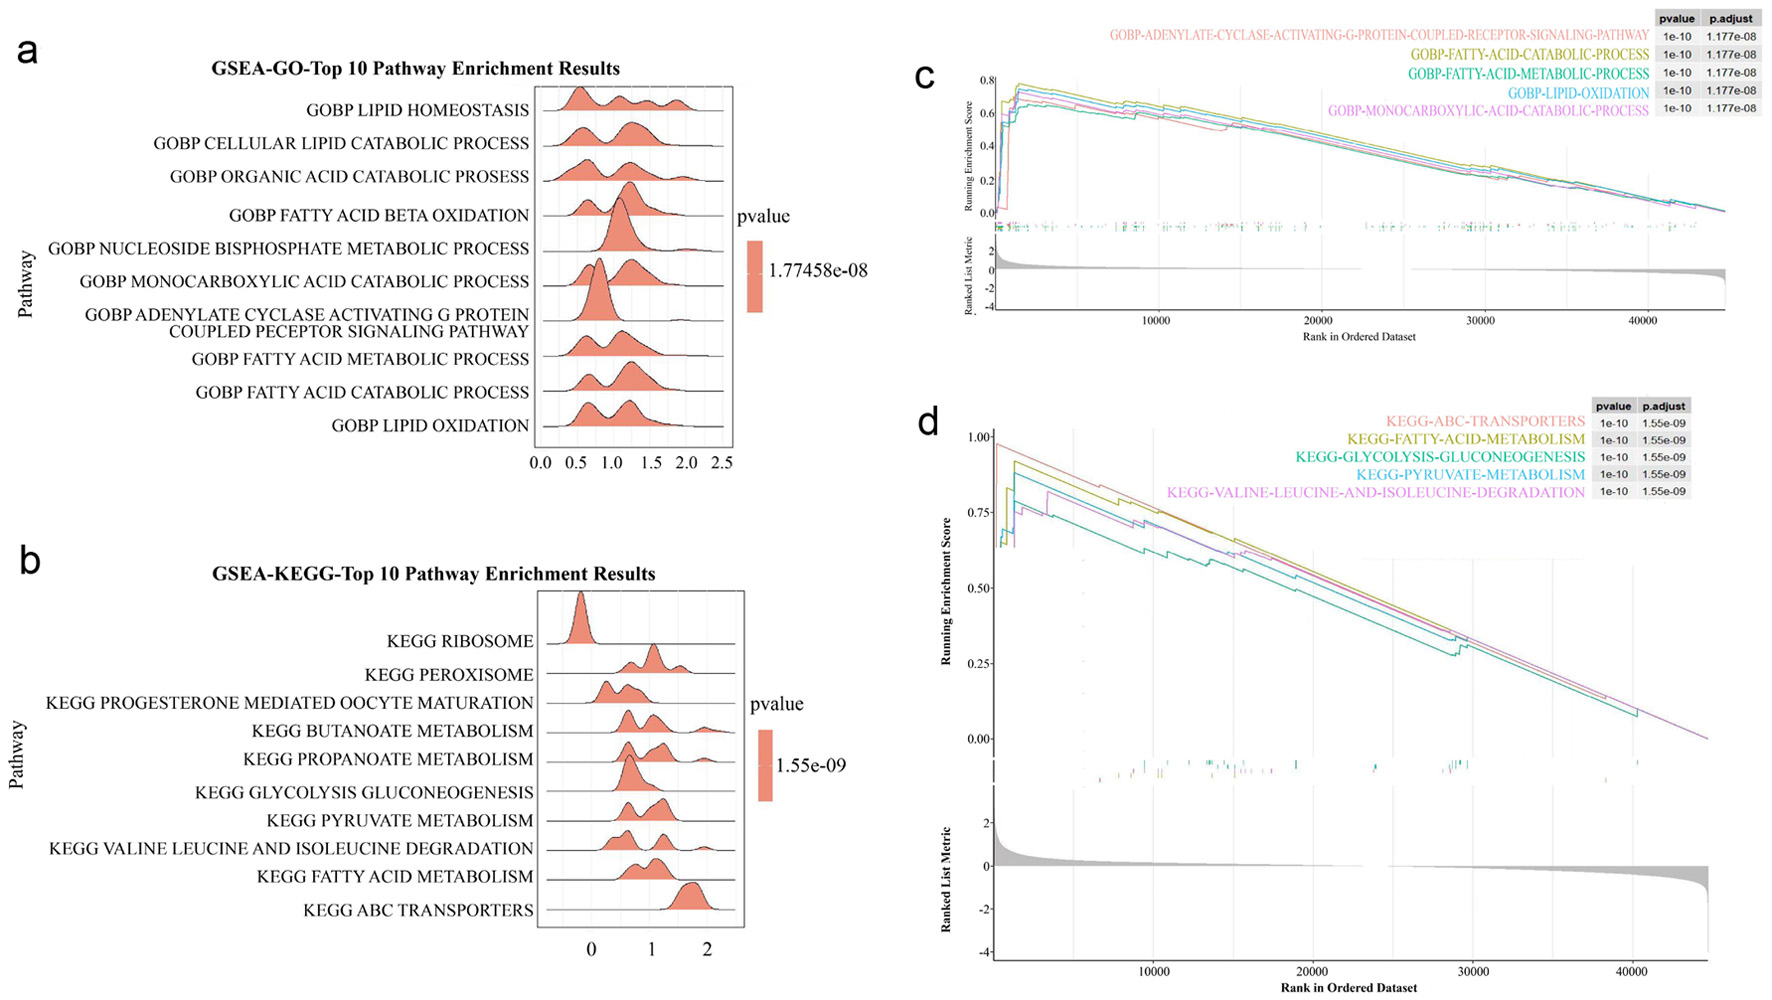
↓ Figure 3. GSEA analysis. (a) GO analysis of GSEA enrichment analysis. (b) KEGG analysis of GSEA enrichment analysis. (c) The main enriched pathway of GO. (d) The main enriched pathway of KEGG. GSEA: gene set enrichment analysis; GO: Gene Ontology; KEGG: Kyoto Encyclopedia of Genes and Genomes; DEGs: differentially expressed genes; GRG: glycolysis-related gene.
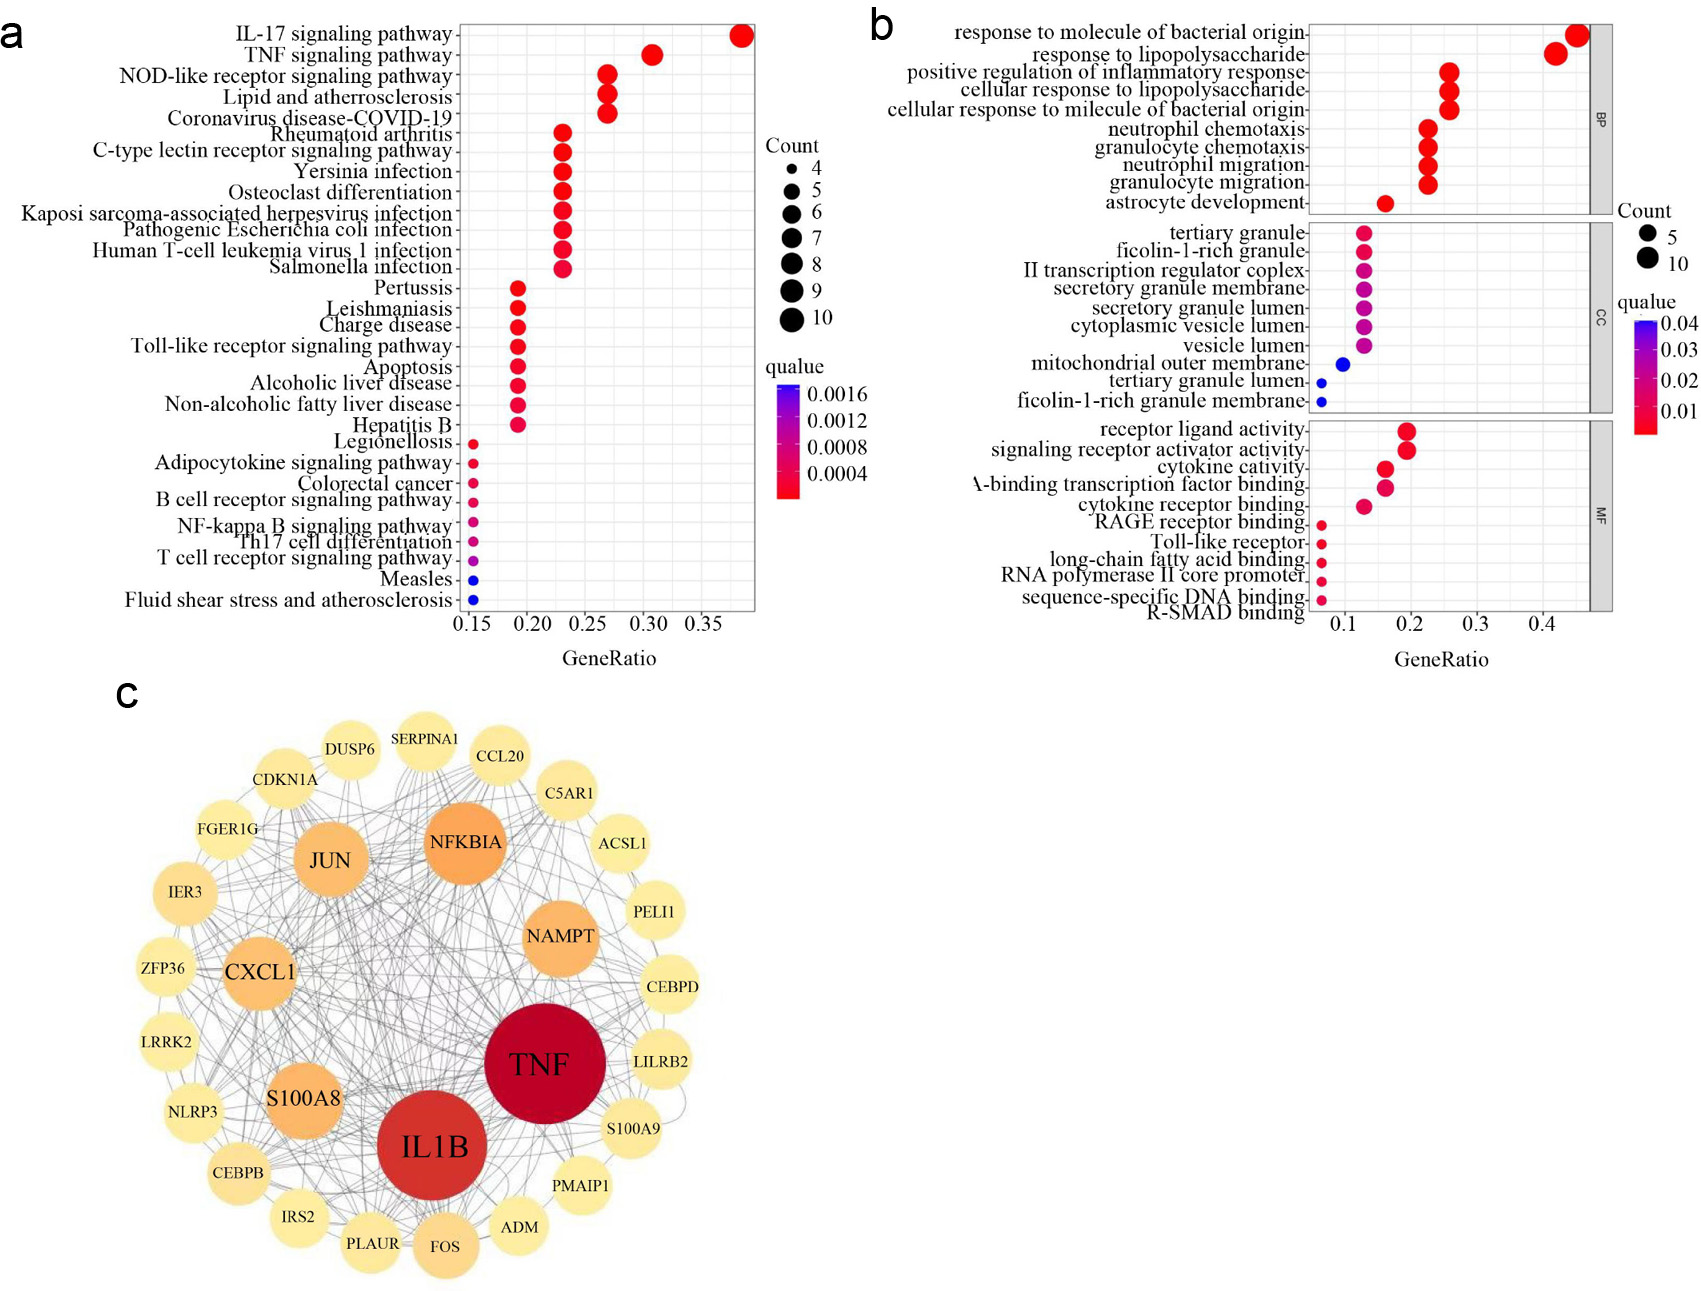
↓ Figure 4. Construction of PPI networks and identification of hub genes based on DEGRGs. (a) GO enrichment analysis of DEGRGs. (b) KEGG enrichment analysis of DEGRGs. (c) Screening hub genes by constructing PPI network and get seven hub genes (TNF, IL1B, NFKBIA, NAMPT, S100A8, CXCL1, and JUN). The circle with the larger diameter and deeper color indicates the higher intervention centrality and central position in the network. PPI: protein-protein interaction; DEGRGs: differentially expressed glycolysis related genes; GO: Gene Ontology; KEGG: Kyoto Encyclopedia of Genes and Genomes.
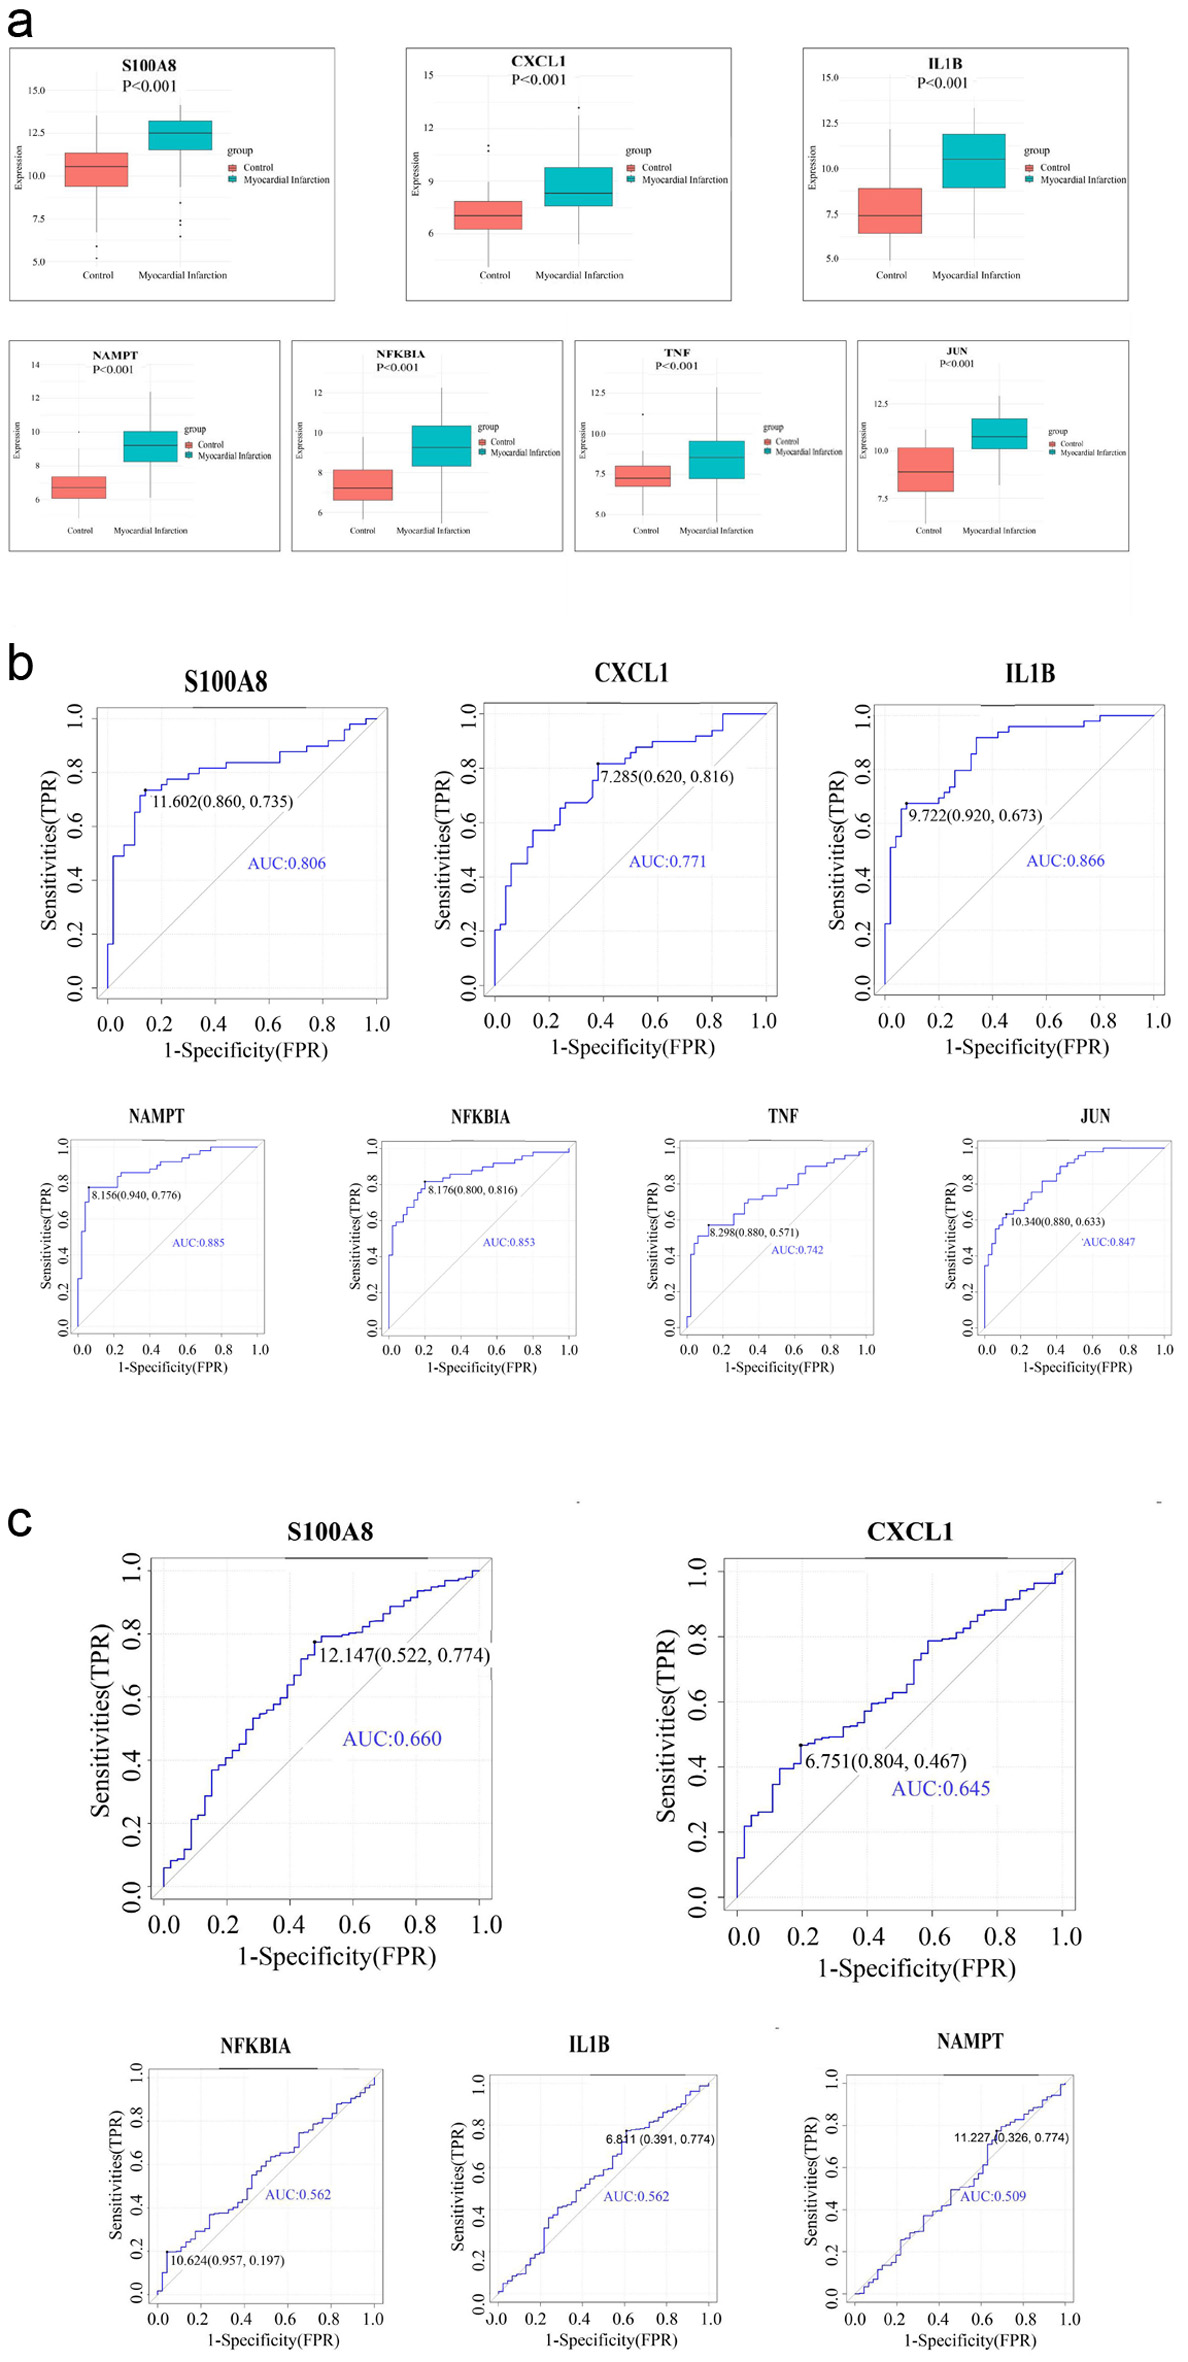
↓ Figure 5. Assess the diagnostic efficacy of seven hub genes and get two hub genes (S100A8, CXCL1) with good diagnostic performance in AMI. (a) Expression of hub genes in GSE66360 dataset. (b) ROC curve of hub genes in GSE66360 dataset. (c) ROC curve of hub genes in GSE59867 dataset. AMI: acute myocardial infarction; ROC: receiver operating characteristic.
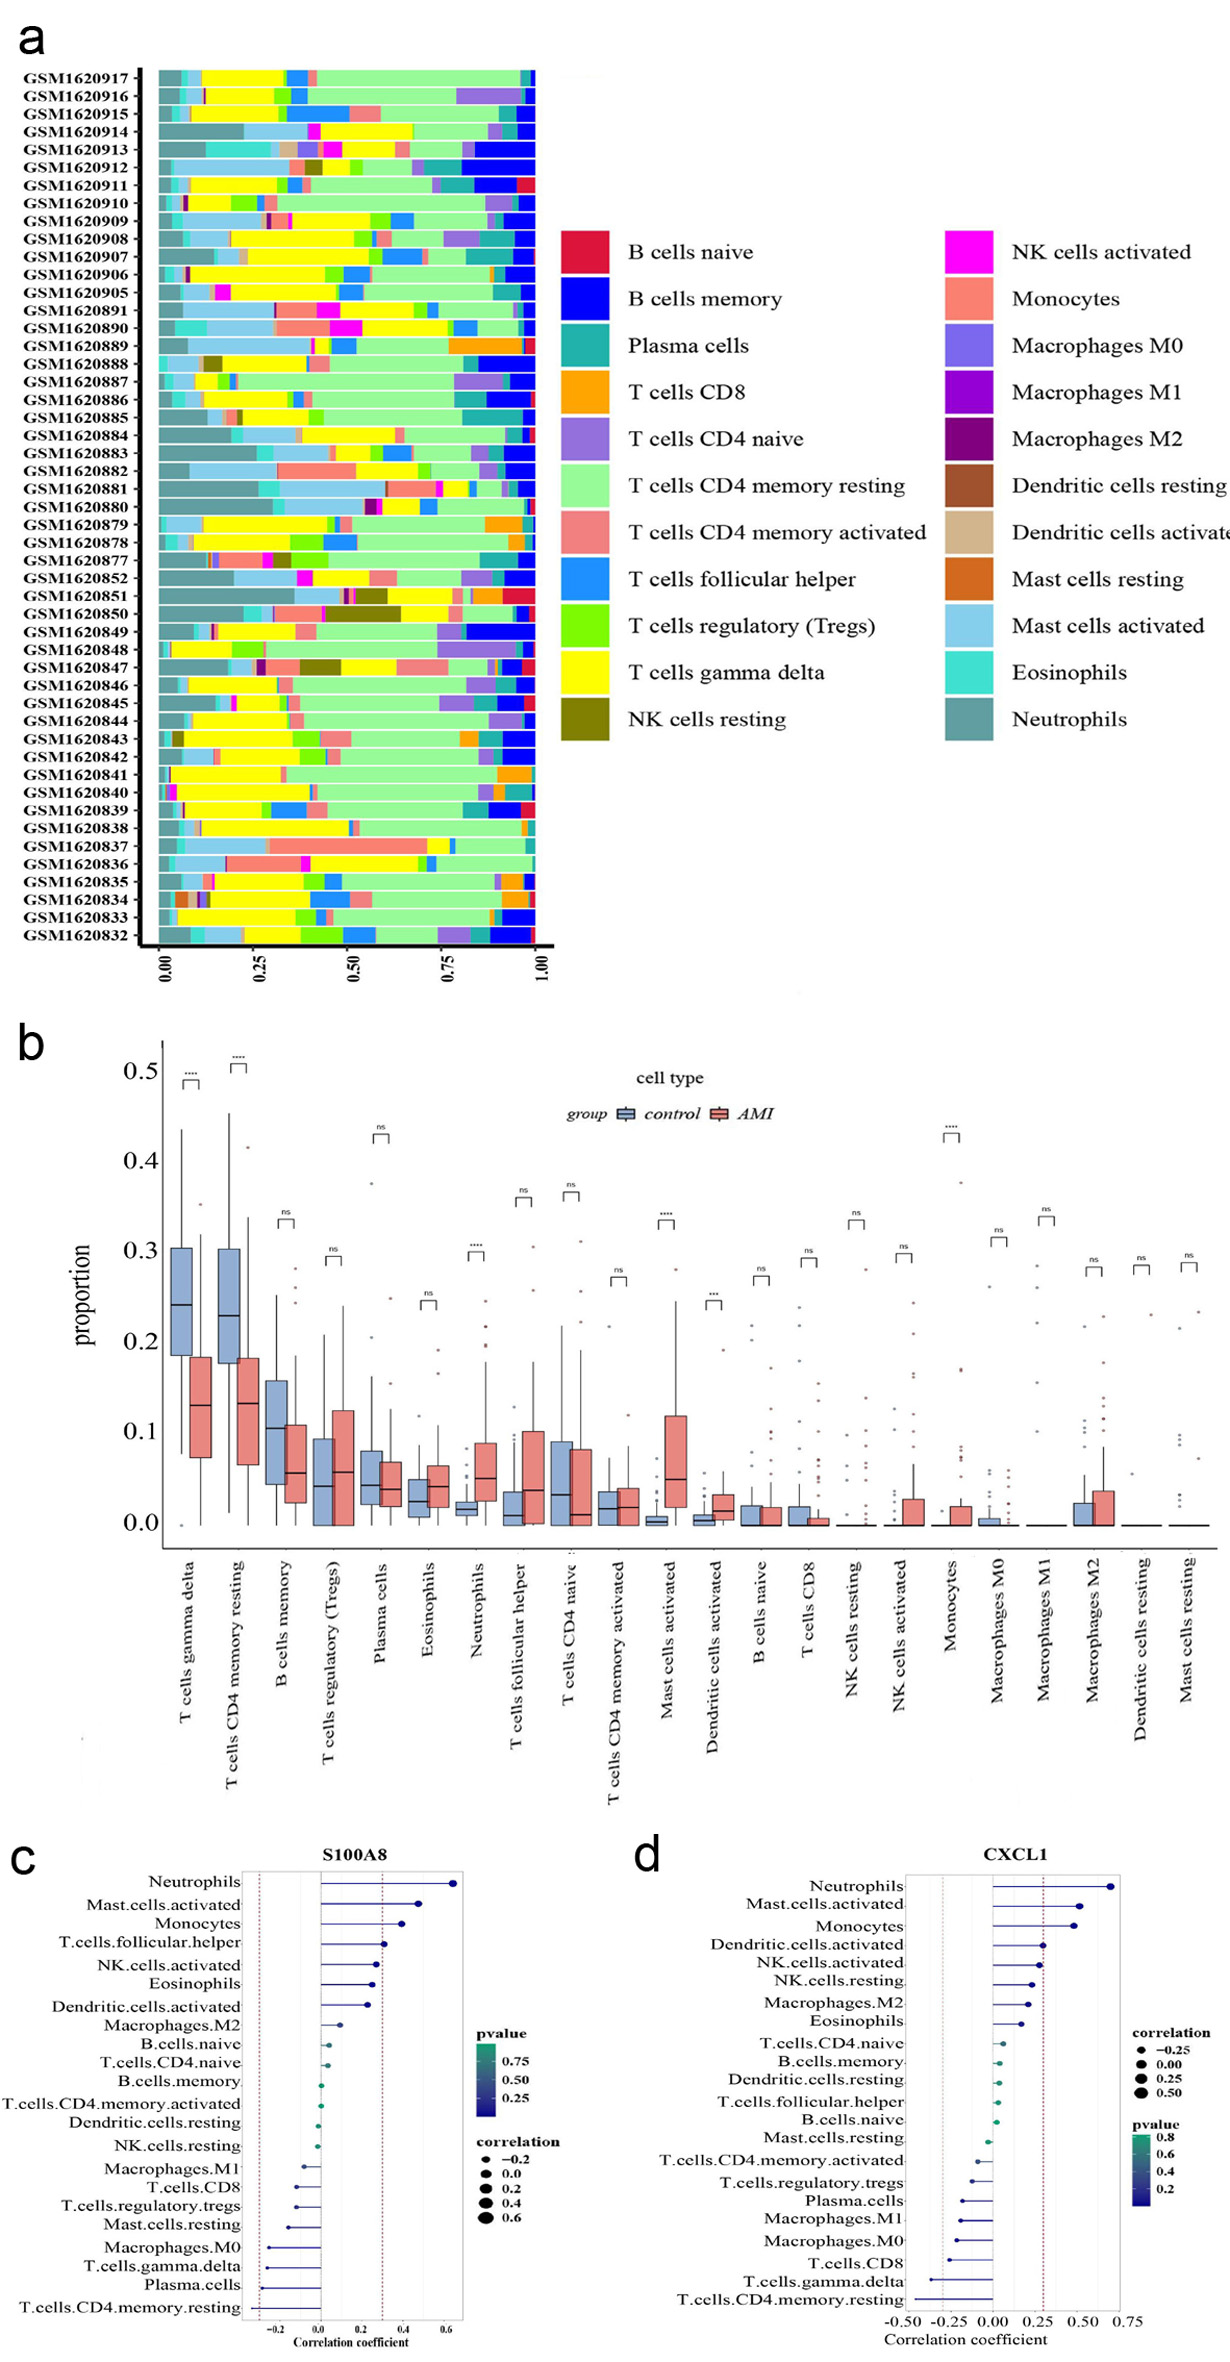
↓ Figure 6. Immune cell infiltration analysis. (a) The box plot shows the relative percentages of different types of immune cells in all AMI samples. The vertical axis shows the 49 AMI samples, and the length of each color block on the horizontal axis indicates its percentage (0 - 1) of all immune cells. (b) Comparison of the proportion of various immune cell infiltrates between AMI and healthy control. (c) Correlation between CXCL1 and infiltrating immune cells. (d) Correlation between S100A8 and infiltrating immune cells. AMI: acute myocardial infarction.