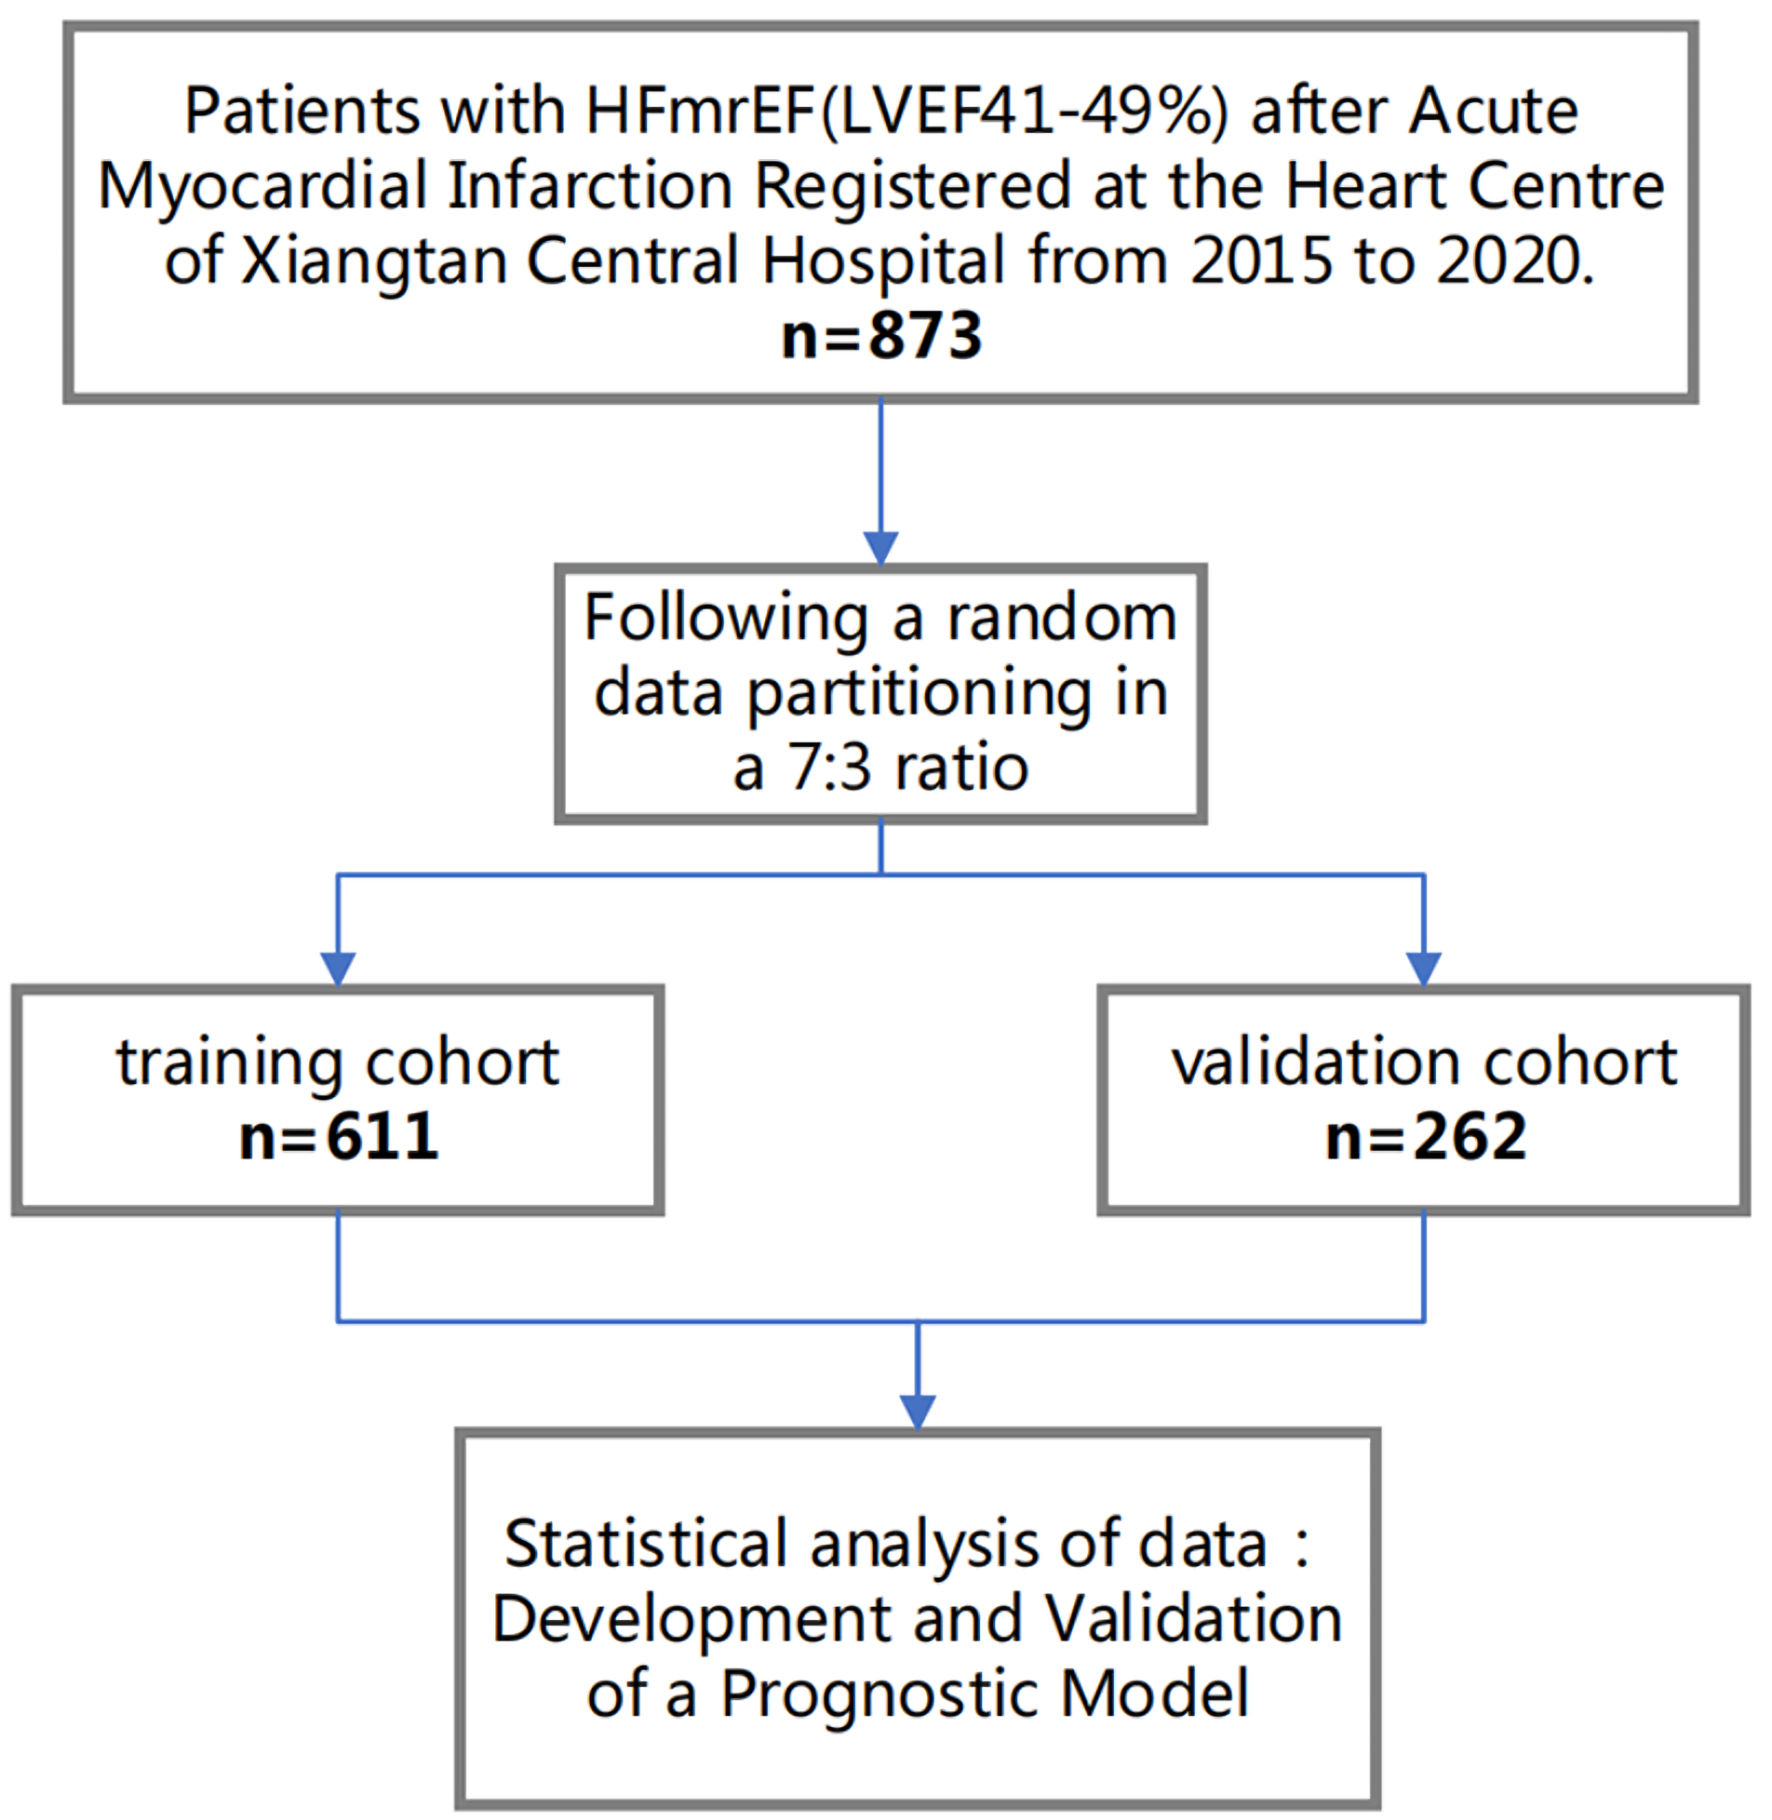
↓ Figure 1. Flow diagram for participant screening, eligibility, and analysis. HFmrEF: heart failure with mildly reduced ejection fraction; LVEF: left ventricular ejection fraction.
| Cardiology Research, ISSN 1923-2829 print, 1923-2837 online, Open Access |
| Article copyright, the authors; Journal compilation copyright, Cardiol Res and Elmer Press Inc |
| Journal website https://cr.elmerpub.com |
Original Article
Volume 17, Number 1, February 2026, pages 10-22
Development and Validation of a Prognostic Model to Predict Mortality in Patients With Heart Failure With Mildly Reduced Ejection Fraction After Acute Myocardial Infarction
Figures
Tables
| Training cohort (n = 611) | Validation cohort (n = 262) | P value | |
|---|---|---|---|
| According to a 7:3 ratio, the population was randomly divided into a training cohort and a validation cohort. Categorical variables were presented as n (%). Values for continuous variables are given as means ± SD or medians with interquartile ranges. HFmrEF: heart failure with mildly reduced ejection fraction; NYHA: New York Heart Association; COPD: chronic obstructive pulmonary disease; ACEI: angiotensin-converting enzyme inhibitor; ARB: angiotensin receptor blocker; ARNI: angiotensin receptor-neprilysin inhibitor; SGLT2i: sodium–glucose cotransporter 2 inhibitors; NT-proBNP: N-terminal pro-brain natriuretic peptide; eGFR: estimated glomerular filtration rate; LVd: left ventricular end-diastolic diameter; RVd: right ventricular end-diastolic diameter; E/e’: early diastolic peak velocity/early diastolic peak velocity of the lateral or septal mitral annulus; PASP: pulmonary artery systolic pressure; SD: standard deviation. | |||
| Demographics | |||
| Age, years | 69.0 (61.0; 77.0) | 69.0 (61.0; 77.0) | 0.734 |
| Male, n (%) | 434 (71.0%) | 174 (66.4%) | 0.201 |
| Body mass index, kg/m2 | 24.4 (22.8; 30.0) | 24.4 (22.9; 30.0) | 0.988 |
| NYHA III + IV, n (%) | 324 (53.0%) | 123 (46.9%) | 0.116 |
| Medical history, n (%) | |||
| Current smoker | 221 (36.2%) | 95 (36.3%) | 1.000 |
| Current drinker | 53 (8.67%) | 26 (9.92%) | 0.645 |
| Hypertension | 432 (70.7%) | 168 (64.1%) | 0.065 |
| Hyperlipidemia | 126 (20.6%) | 57 (21.8%) | 0.775 |
| Coronary heart disease | 605 (99.0%) | 261 (99.6%) | 0.681 |
| Atrial fibrillation | 71 (11.6%) | 28 (10.7%) | 0.778 |
| Stroke | 77 (12.6%) | 29 (11.1%) | 0.601 |
| COPD | 66 (10.8%) | 22 (8.40%) | 0.338 |
| Renal insufficiency | 127 (20.8%) | 42 (16.0%) | 0.124 |
| Diabetes | 206 (33.7%) | 96 (36.6%) | 0.450 |
| Serology | |||
| NT-proBNP/100, pg/mL | 17.7 (4.50; 57.5) | 21.1 (4.36; 63.3) | 0.797 |
| Hemoglobin, g/L | 126 (112; 139) | 130 (114; 142) | 0.164 |
| White blood cells, × 109/L | 8.33 (6.35; 10.8) | 8.41 (6.42; 10.7) | 0.959 |
| Platelets, × 109/L | 187 (150; 227) | 187 (148; 231) | 0.908 |
| Alanine aminotransferase, U/L | 25.7 (14.9; 43.8) | 26.9 (14.5; 46.9) | 0.756 |
| Aspartate aminotransferase, U/L | 32.1 (20.1; 150) | 36.2 (21.1; 134) | 0.413 |
| Creatine kinase-MB, U/L | 24.5 (14.0; 88.2) | 25.9 (14.8; 113) | 0.550 |
| Uric acid, µmol/L | 340 (276; 416) | 332 (264; 415) | 0.378 |
| eGFR, mL/min/1.73 m2 | 73.9 (51.0; 93.7) | 73.7 (57.6; 93.2) | 0.680 |
| Sodium, mg/L | 140 (137; 142) | 140 (137; 141) | 0.972 |
| Potassium, mg/L | 4.12 (3.80; 4.48) | 4.08 (3.77; 4.40) | 0.248 |
| Low-density lipoprotein, mmol/L | 2.42 (1.73; 3.13) | 2.50 (1.78; 3.18) | 0.280 |
| Treatment, n (%) | |||
| PPCI | 392 (64.2%) | 173 (66.0%) | 0.122 |
| Beta-blocker | 534 (87.4%) | 235 (89.7%) | 0.397 |
| ACEI or ARB | 498 (81.5%) | 221 (84.4%) | 0.361 |
| ARNI | 34 (5.56%) | 12 (4.58%) | 0.666 |
| SGLT2i | 2 (0.33%) | 1 (0.38%) | 1.000 |
| Diuretics | 319 (52.2%) | 130 (49.6%) | 0.530 |
| Spironolactone | 292 (47.8%) | 124 (47.3%) | 0.959 |
| Echocardiography | |||
| Aortic size, mm | 33.0 (31.0; 36.0) | 33.5 (31.0; 36.0) | 0.762 |
| Left atrium size, mm | 37.0 (34.0; 40.0) | 37.0 (35.0; 40.0) | 0.992 |
| LVd, mm | 51.0 (48.0; 55.0) | 51.0 (47.0; 55.0) | 0.160 |
| Right atrium size, mm | 35.0 (33.0; 38.0) | 36.0 (34.0; 38.0) | 0.023 |
| RVd, mm | 19.0 (17.0; 20.0) | 19.0 (18.0; 20.0) | 0.176 |
| E/e’, cm/s | 13.3 (9.80; 18.4) | 13.7 (10.4; 18.0) | 0.396 |
| PASP, mm Hg | 31.0 (18.0; 40.0) | 31.0 (22.0; 39.8) | 0.884 |
| Clinical endpoints, n (%) | |||
| Death | 128 (20.9%) | 55 (21.0%) | 1.000 |
| characteristics | β | SE | HR | 95% CI | Z score | P value |
|---|---|---|---|---|---|---|
| aP < 0.05. HFmrEF: heart failure with mildly reduced ejection fraction; NYHA: New York Heart Association; COPD: chronic obstructive pulmonary disease; ACEI: angiotensin-converting enzyme inhibitors; ARB: angiotensin receptor blocker; ARNI: angiotensin receptor-neprilysin inhibitor; SGLT2i: sodium–glucose cotransporter 2 inhibitors; PPCI: primary percutaneous coronary intervention; NT-proBNP: N-terminal pro-brain natriuretic peptide; eGFR: estimated glomerular filtration rate; LVd: left ventricular end-diastolic diameter; RVd: right ventricular end-diastolic diameter; E/e’: early diastolic peak velocity/early diastolic peak velocity of the lateral or septal mitral annulus; PASP: pulmonary artery systolic pressure; SE: standard error; HR: hazard ratio; CI: confidence interval. | ||||||
| Age | 0.077 | 0.009 | 1.08 | 1.061–1.1 | 8.297 | < 0.001a |
| Male vs. female | 0.074 | 0.198 | 1.076 | 0.73–1.588 | 0.371 | 0.711 |
| Body mass index | –0.004 | 0.022 | 0.996 | 0.954–1.041 | –0.159 | 0.874 |
| Current smoker | –0.263 | 0.191 | 0.769 | 0.529–1.117 | –1.378 | 0.168 |
| Current drinker | –0.234 | 0.329 | 0.791 | 0.415–1.51 | –0.71 | 0.478 |
| Diabetes | 0.389 | 0.18 | 1.476 | 1.037–2.1 | 2.16 | 0.031a |
| Renal insufficiency | 1.05 | 0.183 | 2.857 | 1.995–4.09 | 5.731 | < 0.001a |
| COPD | 0.804 | 0.223 | 2.236 | 1.443–3.463 | 3.603 | < 0.001a |
| Stroke | 1.032 | 0.202 | 2.808 | 1.888–4.175 | 5.1 | < 0.001a |
| Atrial fibrillation | 0.684 | 0.227 | 1.982 | 1.27–3.092 | 3.015 | 0.003a |
| Hyperlipidemia | –0.617 | 0.261 | 0.539 | 0.324–0.899 | –2.369 | 0.018a |
| Hypertension | 0.782 | 0.234 | 2.187 | 1.381–3.462 | 3.338 | 0.001a |
| NYHA III + IV vs. NYHA II | 1.006 | 0.202 | 2.735 | 1.84–4.065 | 4.974 | < 0.001a |
| Low-density lipoprotein | –0.153 | 0.095 | 0.858 | 0.713–1.034 | –1.608 | 0.108 |
| Sodium | 0.05 | 0.152 | 1.052 | 0.781–1.416 | 0.332 | 0.74 |
| Potassium | 0.013 | 0.025 | 1.013 | 0.966–1.063 | 0.533 | 0.594 |
| eGFR | –0.026 | 0.003 | 0.974 | 0.968–0.98 | –8.33 | < 0.001a |
| Uric acid | 0.002 | 0.001 | 1.002 | 1.001–1.004 | 3.277 | 0.001a |
| Creatine kinase-MB | –0.003 | 0.001 | 0.997 | 0.995–0.999 | –3.038 | 0.002a |
| Alanine aminotransferase | –0.002 | 0.001 | 0.998 | 0.996–0.999 | –2.716 | 0.007a |
| Aspartate aminotransferase | –0.011 | 0.004 | 0.99 | 0.982–0.997 | –2.642 | 0.008a |
| White blood cells | –0.056 | 0.027 | 0.946 | 0.897–0.997 | –2.063 | 0.039a |
| Hemoglobin | –0.032 | 0.004 | 0.969 | 0.962–0.976 | –8.512 | < 0.001a |
| NT-proBNP/100 | 0.005 | 0.001 | 1.005 | 1.003–1.006 | 5.919 | < 0.001a |
| PASP | 0.01 | 0.002 | 1.01 | 1.007–1.013 | 5.826 | < 0.001a |
| E/e’ | 0.052 | 0.011 | 1.053 | 1.03–1.077 | 4.562 | < 0.001a |
| RVd | 0.028 | 0.022 | 1.028 | 0.985–1.073 | 1.282 | 0.2 |
| Right atrium size | 0.029 | 0.017 | 1.029 | 0.996–1.063 | 1.739 | 0.082 |
| LVd | 0.041 | 0.014 | 1.042 | 1.013–1.072 | 2.887 | 0.004a |
| Left atrium size | 0.076 | 0.015 | 1.079 | 1.048–1.111 | 5.121 | < 0.001a |
| Aortic size | 0.047 | 0.024 | 1.048 | 1–1.098 | 1.973 | 0.049a |
| PPCI | –1.039 | 0.18 | 0.354 | 0.249–0.504 | –5.772 | < 0.001a |
| Diuretics | 0.262 | 0.179 | 1.3 | 0.915–1.847 | 1.464 | 0.143 |
| ARNI | 0.343 | 0.423 | 1.409 | 0.616–3.226 | 0.812 | 0.417 |
| ACEI or ARB | –1.032 | 0.191 | 0.356 | 0.245–0.518 | –5.402 | < 0.001a |
| Spironolactone | –0.141 | 0.178 | 0.868 | 0.613–1.229 | –0.797 | 0.426 |
| Beta-blocker | –0.913 | 0.209 | 0.401 | 0.266–0.604 – | –4.37 | < 0.001a |
| Characteristics | β | SE | HR | 95% CI | Z score | P value |
|---|---|---|---|---|---|---|
| aP < 0.05. HFmrEF: heart failure with mildly reduced ejection fraction; eGFR: estimated glomerular filtration rate; PPCI: primary percutaneous coronary intervention; NYHA: New York Heart Association; SE: standard error; HR: hazard ratio; CI: confidence interval. | ||||||
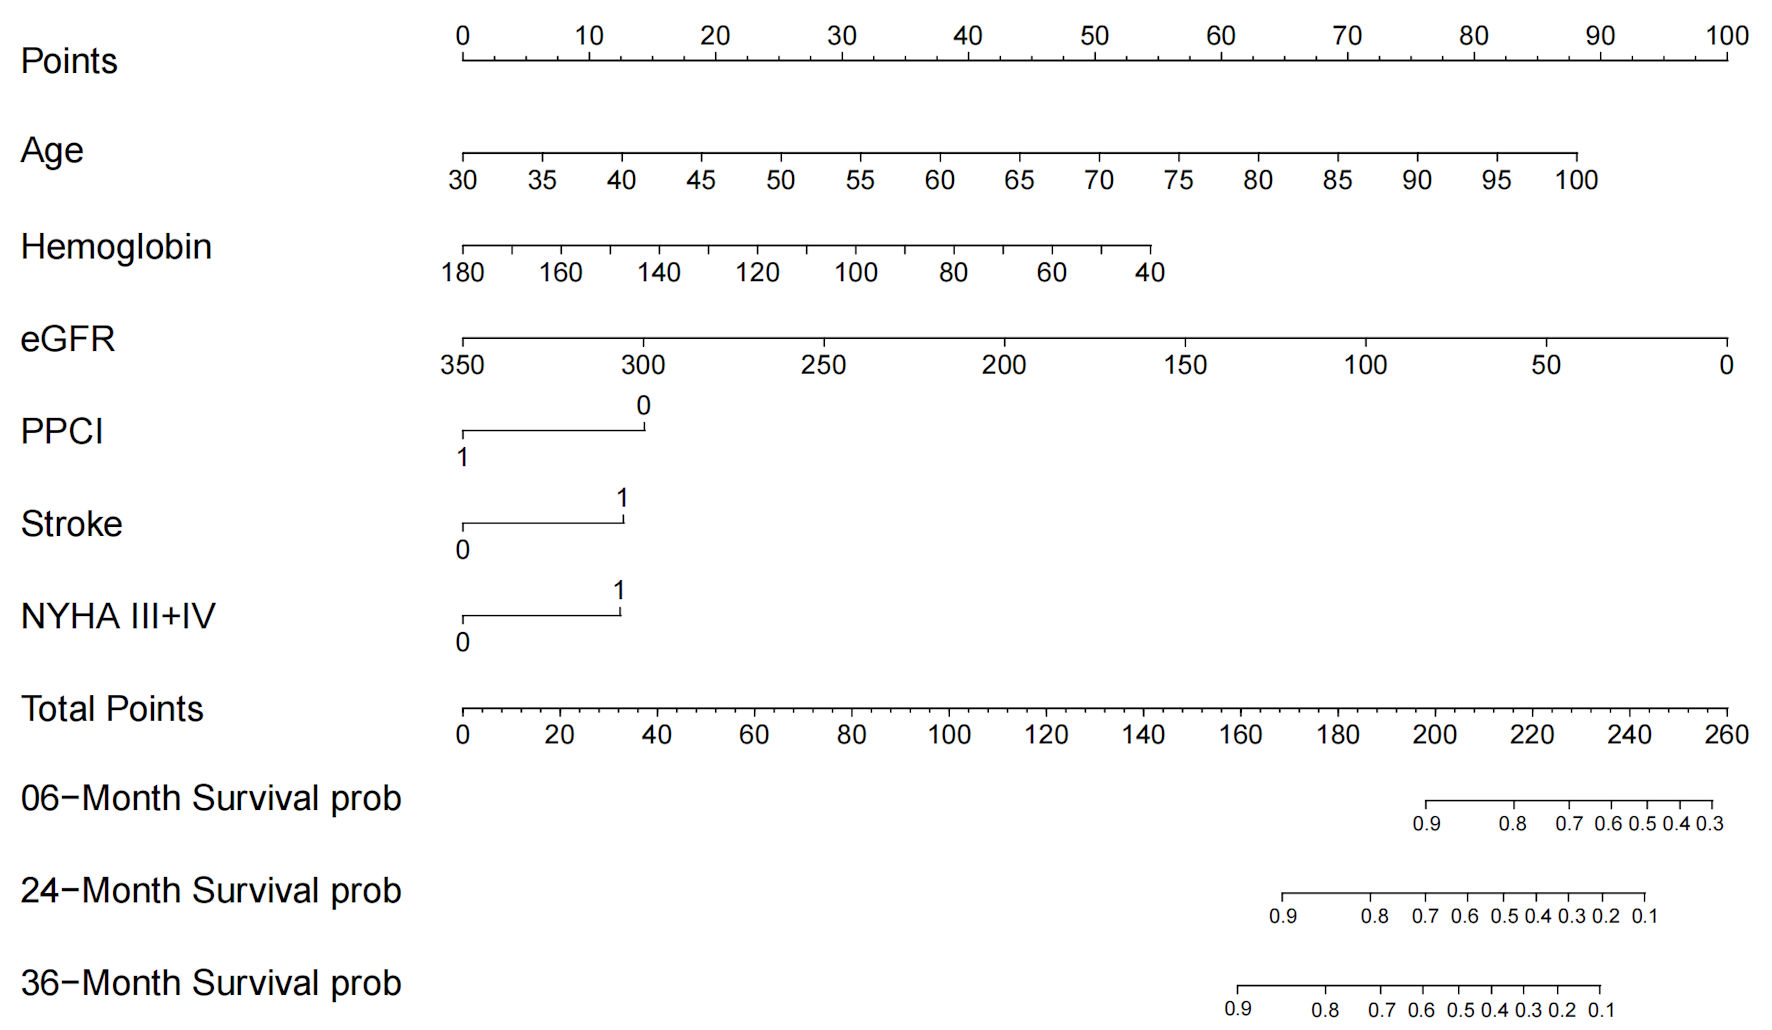
| Age | 0.052 | 0.009 | 1.053 | 1.034–1.073 | 5.555 | < 0.001a |
| Hemoglobin | –0.016 | 0.005 | 0.984 | 0.975–0.993 | –3.42 | 0.001a |
| eGFR | –0.012 | 0.004 | 0.988 | 0.981–0.996 | –2.98 | 0.003a |
| PPCI | –0.594 | 0.187 | 0.552 | 0.383–0.797 | –3.176 | 0.001a |
| Stroke | 0.525 | 0.205 | 1.69 | 1.13–2.528 | 2.556 | 0.011a |
| NYHA III + IV vs. NYHA II | 0.514 | 0.209 | 1.673 | 1.111–2.519 | 2.462 | 0.014a |