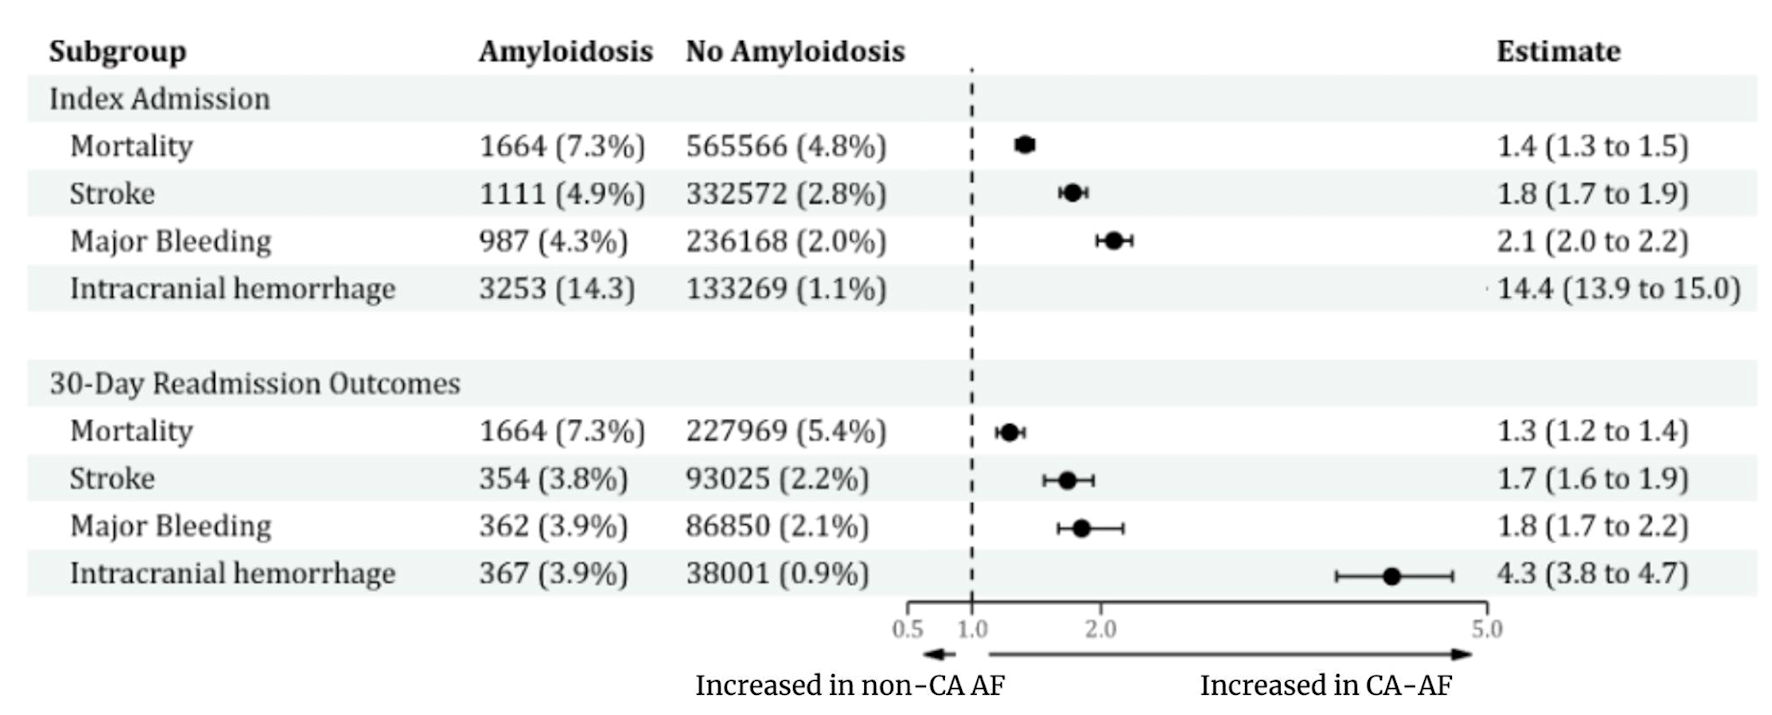
↓ Figure 1. Proportion of major events and estimates of outcomes between CA-AF and no-CA-AF at index admission and 30-day readmission. CA: cardiac amyloidosis; AF: atrial fibrillation.
| Cardiology Research, ISSN 1923-2829 print, 1923-2837 online, Open Access |
| Article copyright, the authors; Journal compilation copyright, Cardiol Res and Elmer Press Inc |
| Journal website https://cr.elmerpub.com |
Original Article
Volume 16, Number 5, October 2025, pages 385-393
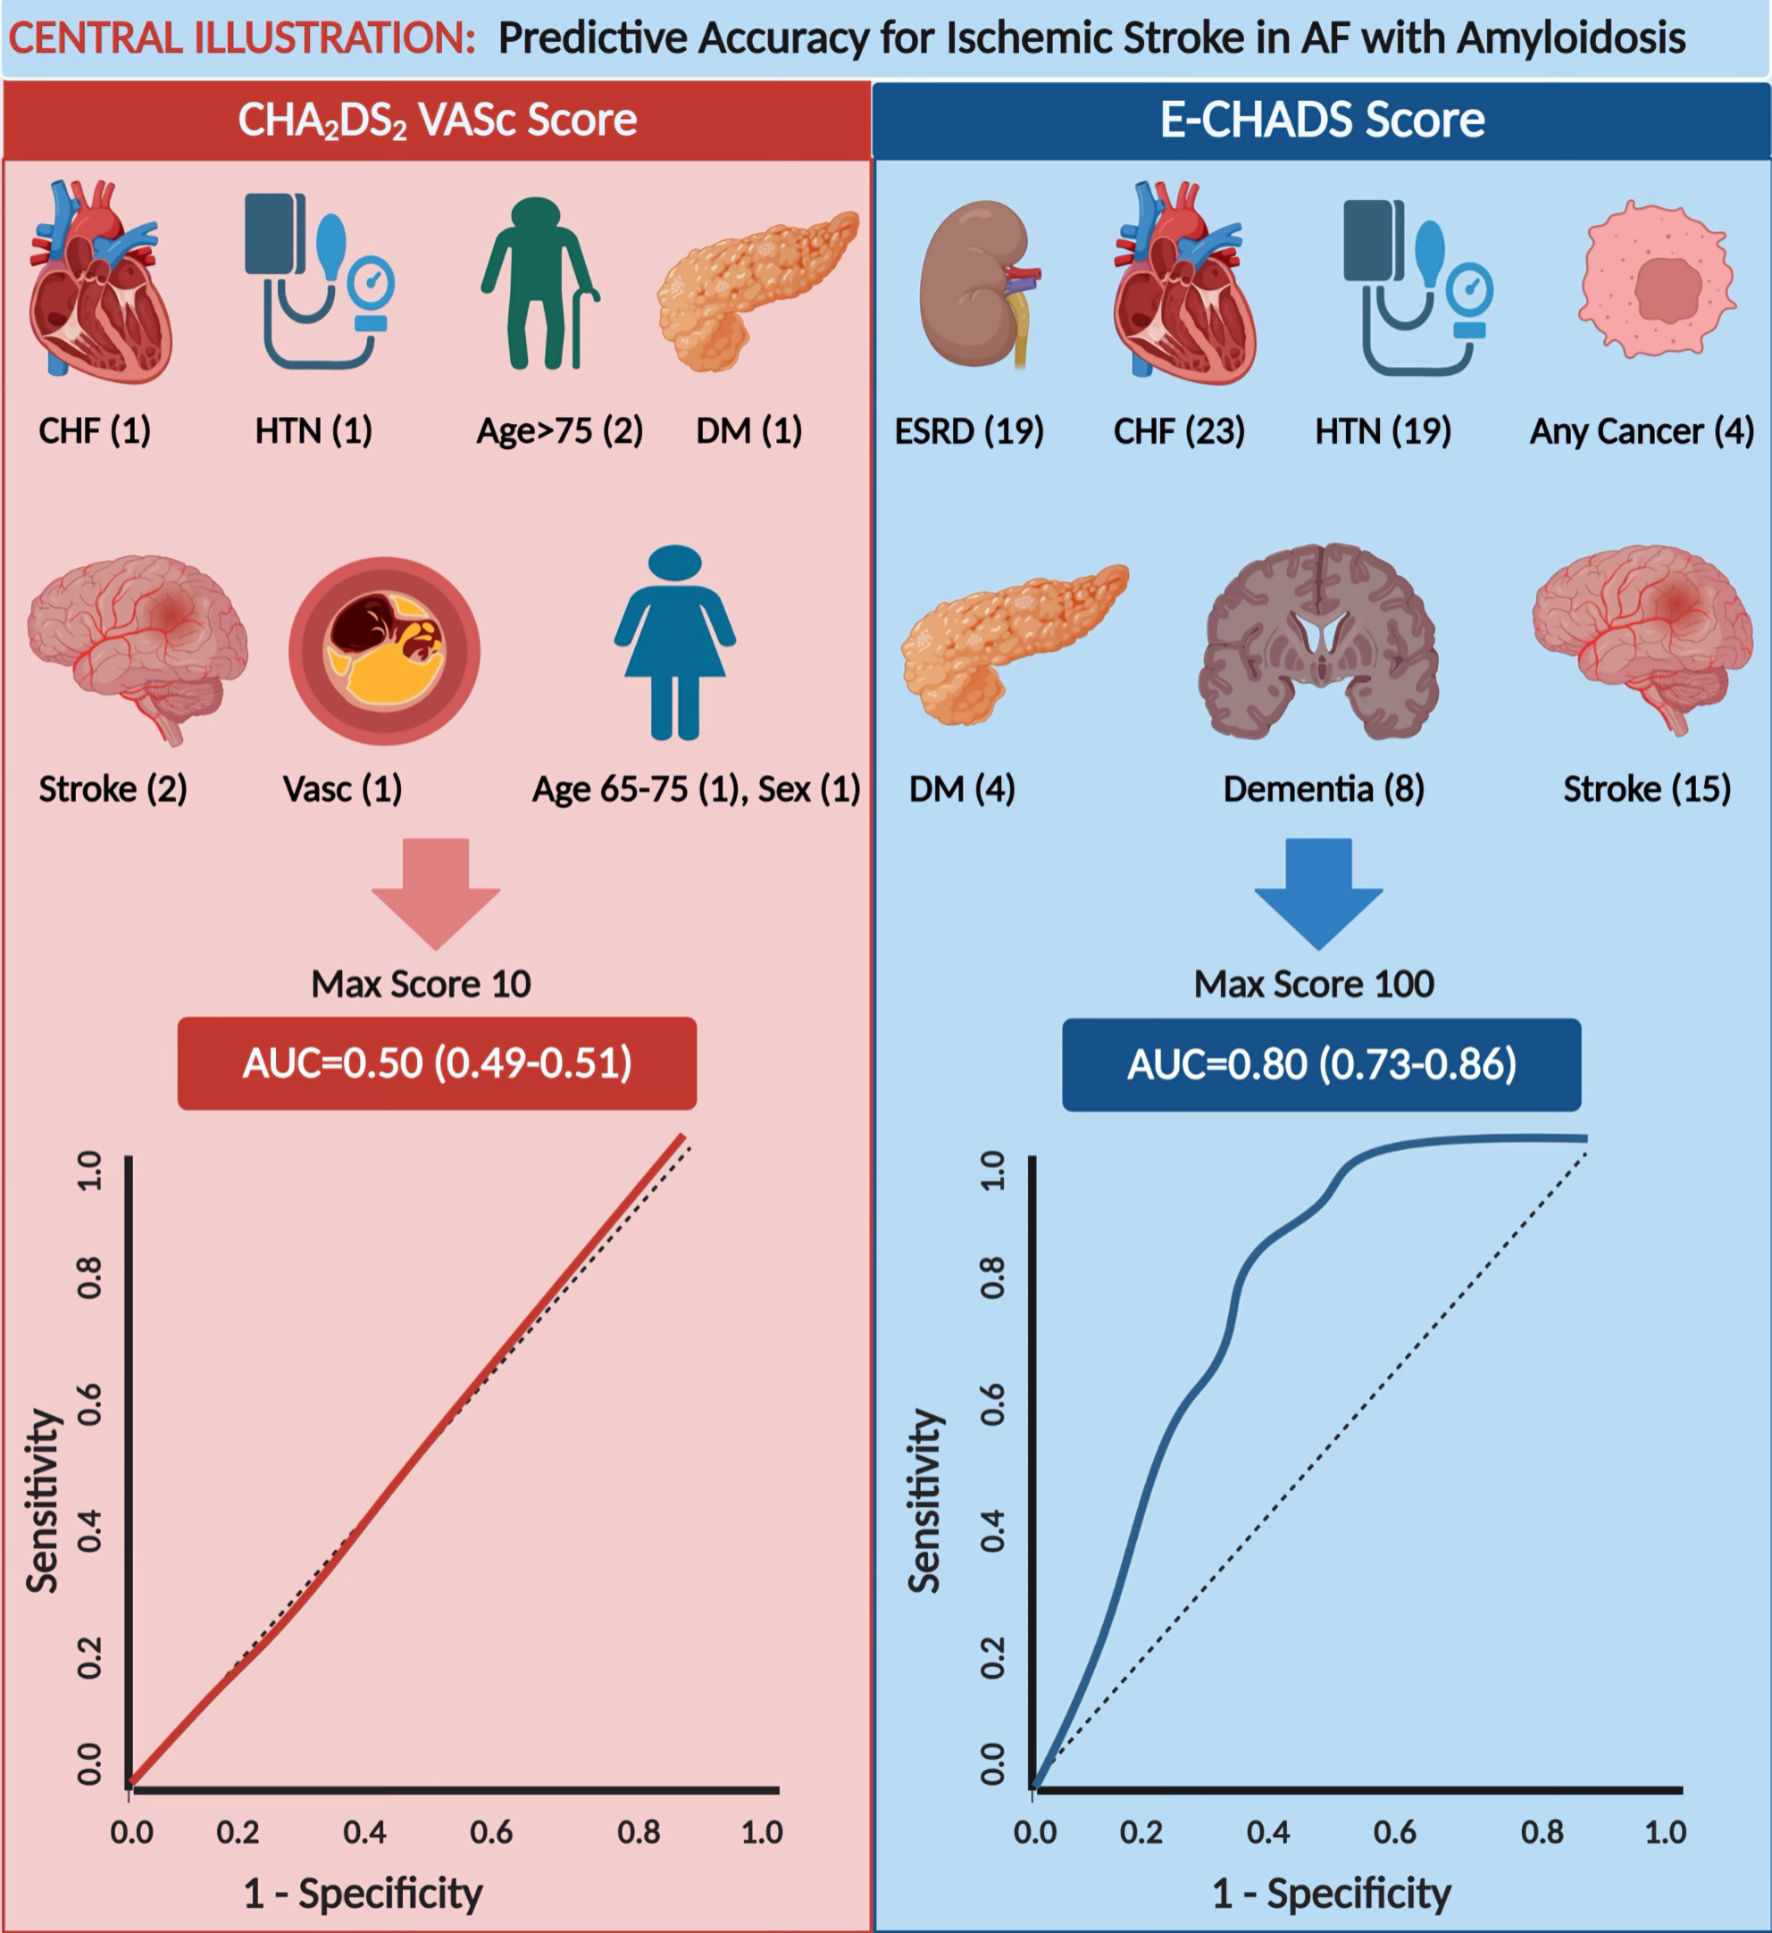
Discriminative Accuracy of CHA2DS2-VASc Score, and Development of Predictive Accuracy Model Using Machine Learning for Ischemic Stroke Risk in Cardiac Amyloidosis and Atrial Fibrillation
Figures
Table
| Score cut-off | Predicted risk | % of patients | Accuracy (95% CI) | Sensitivity (95% CI) | Specificity (95% CI) | PPV (95% CI) | NPV (95% CI) |
|---|---|---|---|---|---|---|---|
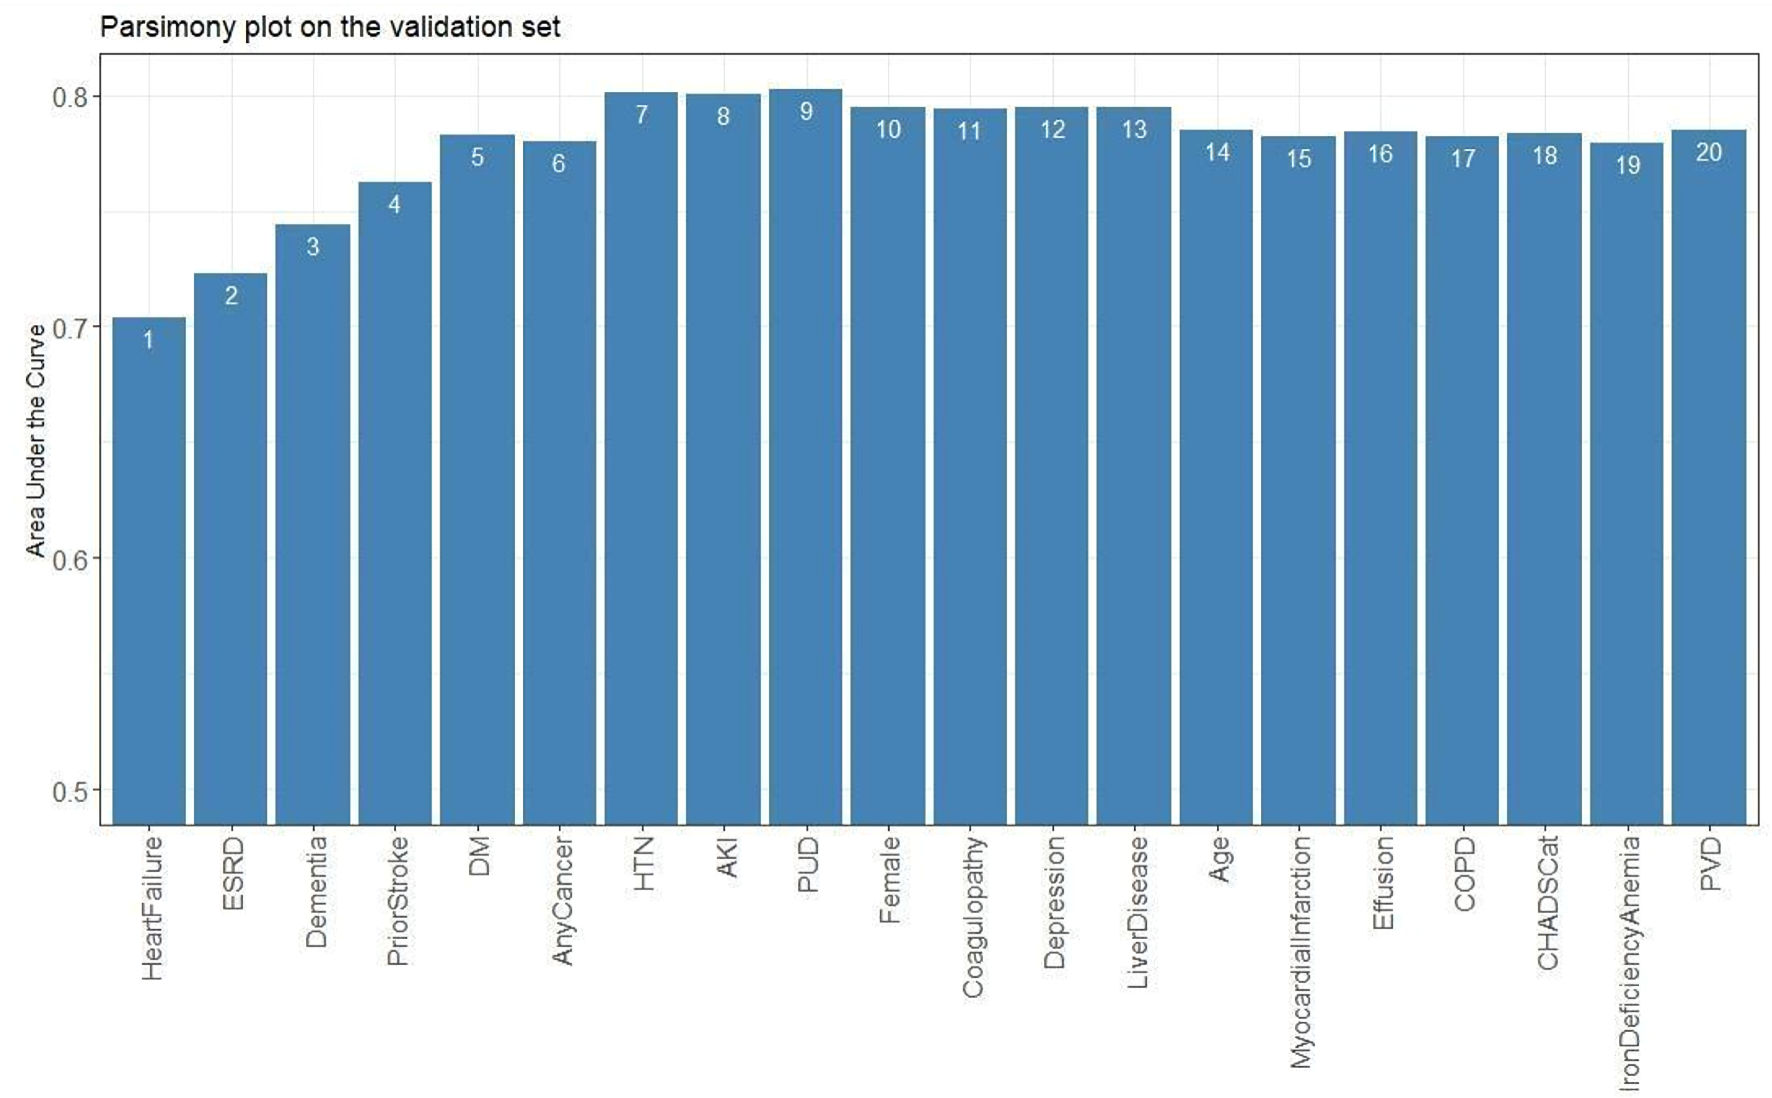
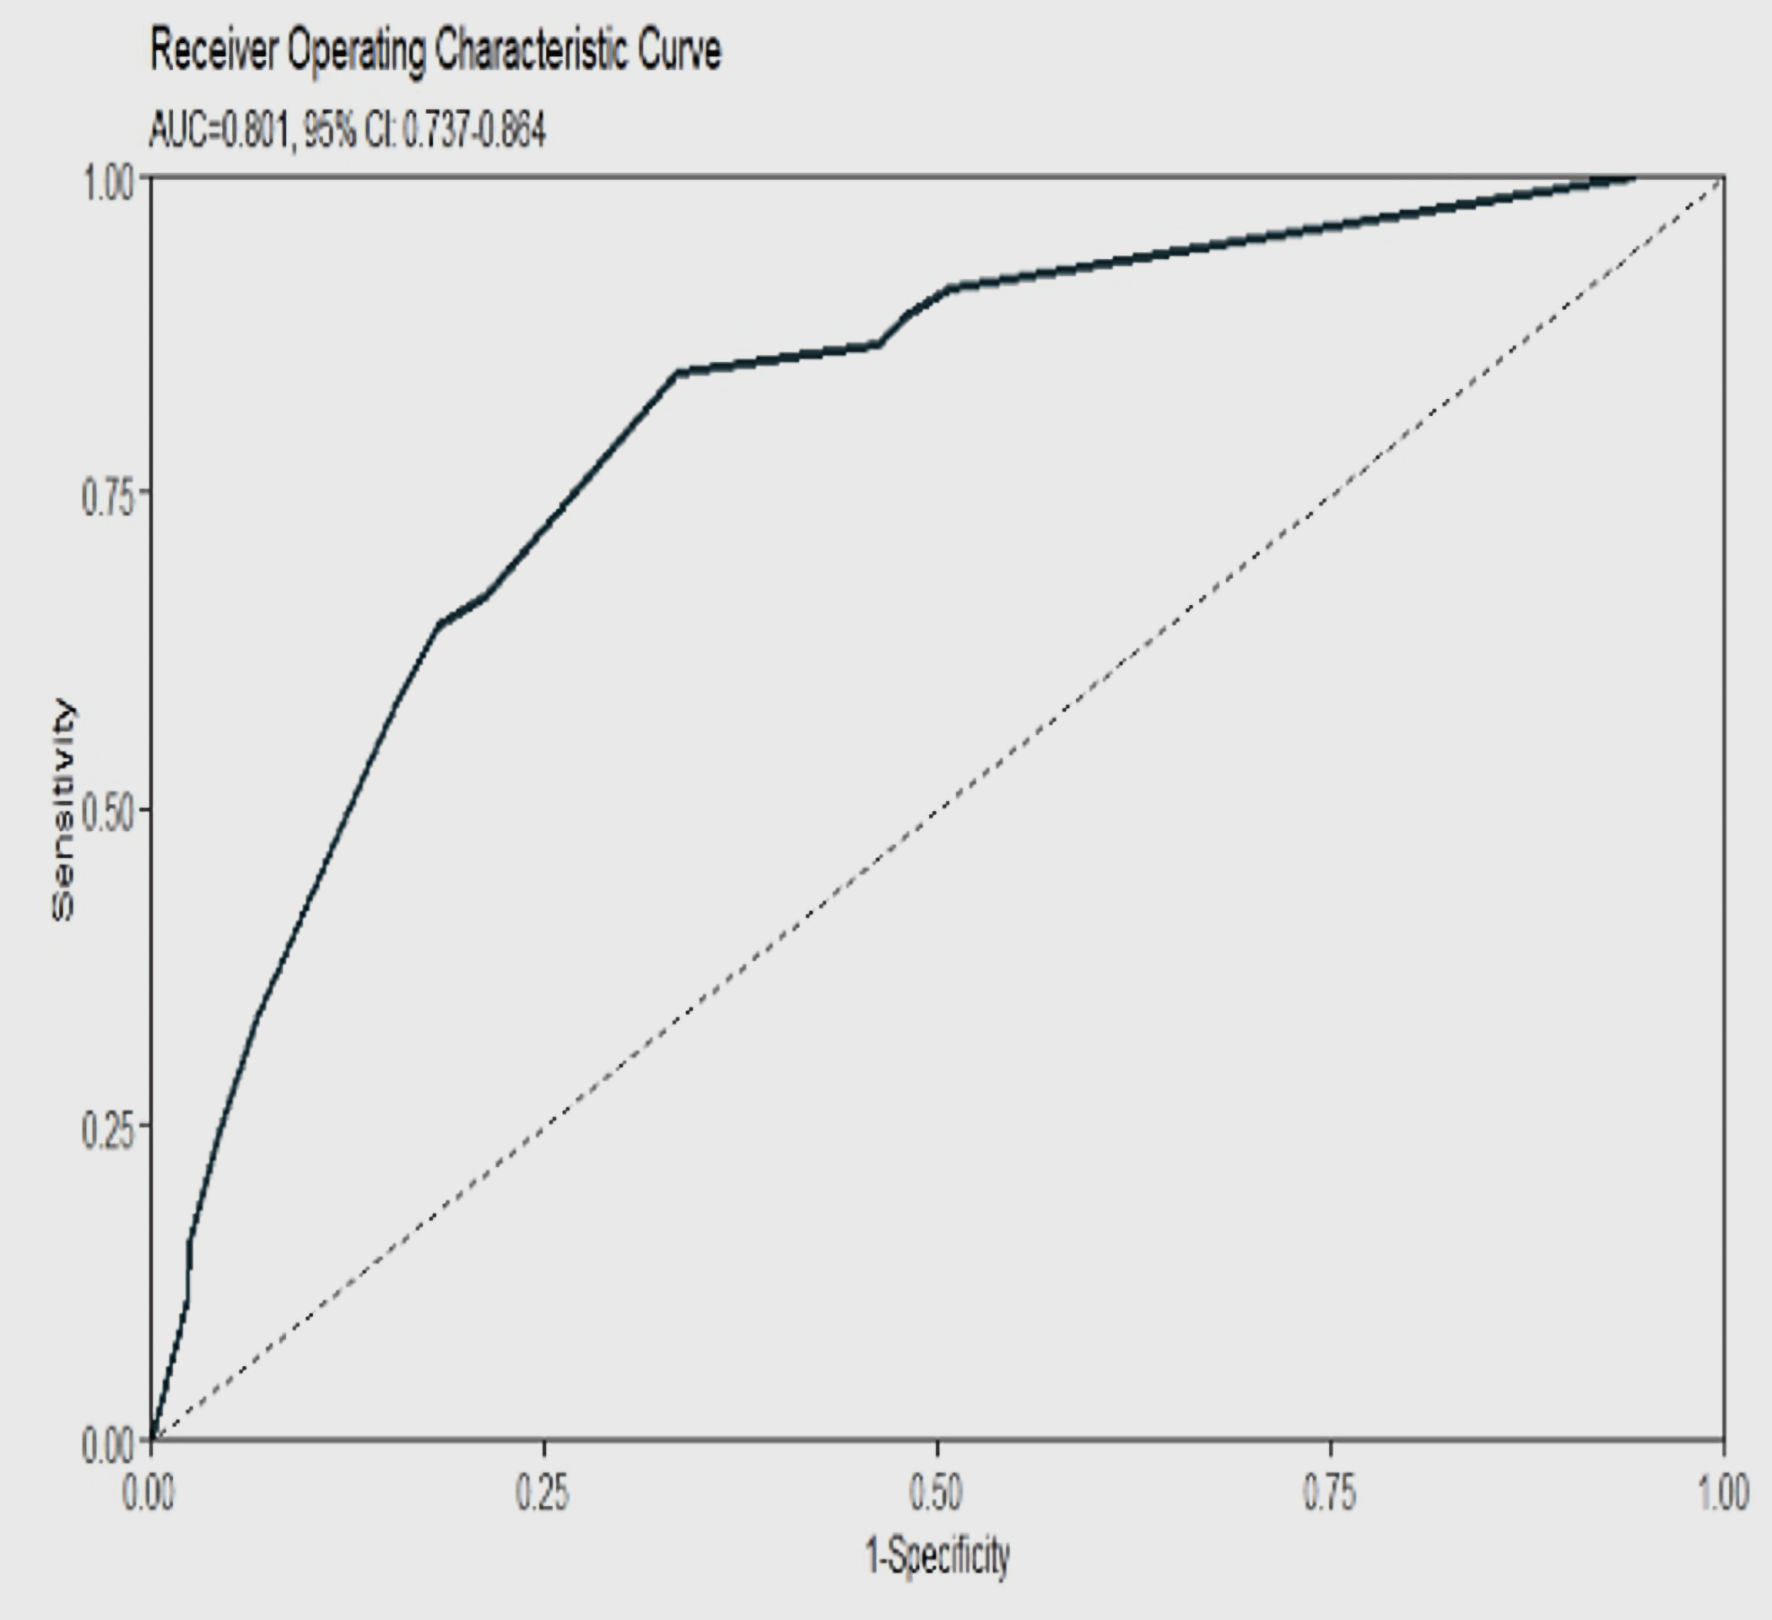
| Machine learning model’s predicted risk of stroke, based on scores, was determined by eight selected variables (heart failure, ESRD, HTN, neurological disease, dementia, electrolyte abnormalities, DM, and any cancer). Also shown are the accuracy, sensitivity, specificity, PPV, NPV, and their respective 95% CIs for the model at each score cut-off point. Values for accuracy, sensitivity, specificity, PPV, NPV, and their respective confidence intervals are listed as percentages. ESRD: end-stage renal disease; HTN: hypertension; DM: diabetes mellitus; PPV: positive predictive value; NPV: negative predictive value; CI: confidence interval. | |||||||
| ≥ 20 | ≥ 0.80% | 95 | 9.8 (7.9 - 11.7) | 100 (100 - 100) | 5.5 (3.6 - 7.5) | 4.8 (4.7 - 4.9) | 100 (100 - 100) |
| ≥ 40 | ≥ 2.40% | 55 | 48.9 (44.7 - 53.2) | 95.8 (87.5 - 100) | 46.6 (42.3 - 51.2) | 7.9 (7 - 8.7) | 99.6 (98.7 - 100) |
| ≥ 60 | ≥ 5.90% | 22 | 79.2 (75.8 - 82.6) | 66.7 (49.9 - 83.3) | 79.8 (76.3 - 83.2) | 13.6 (9.7 - 17.5) | 98.1 (97 - 99) |
| ≥ 75 | ≥ 11.60% | 9 | 88.5 (86 - 90.8) | 20.8 (4.2 - 37.5) | 91.7 (89.3 - 94.1) | 10.4 (2.9 - 18.9) | 96 (95.3 - 96.9) |
| ≥ 90 | ≥ 21.60% | 2 | 94.3 (93.2 - 95.3) | 4.2 (0 - 12.5) | 98.6 (97.6 - 99.6) | 11.1 (0 - 42.9) | 95.6 (95.4 - 96) |
| ≥ 100 | ≥ 29% | 0 | 95.5 (94.9 - 96) | 4.2 (0 - 12.5) | 99.8 (99.4 - 100) | 50 (0 - 100) | 95.6 (95.4 - 96) |