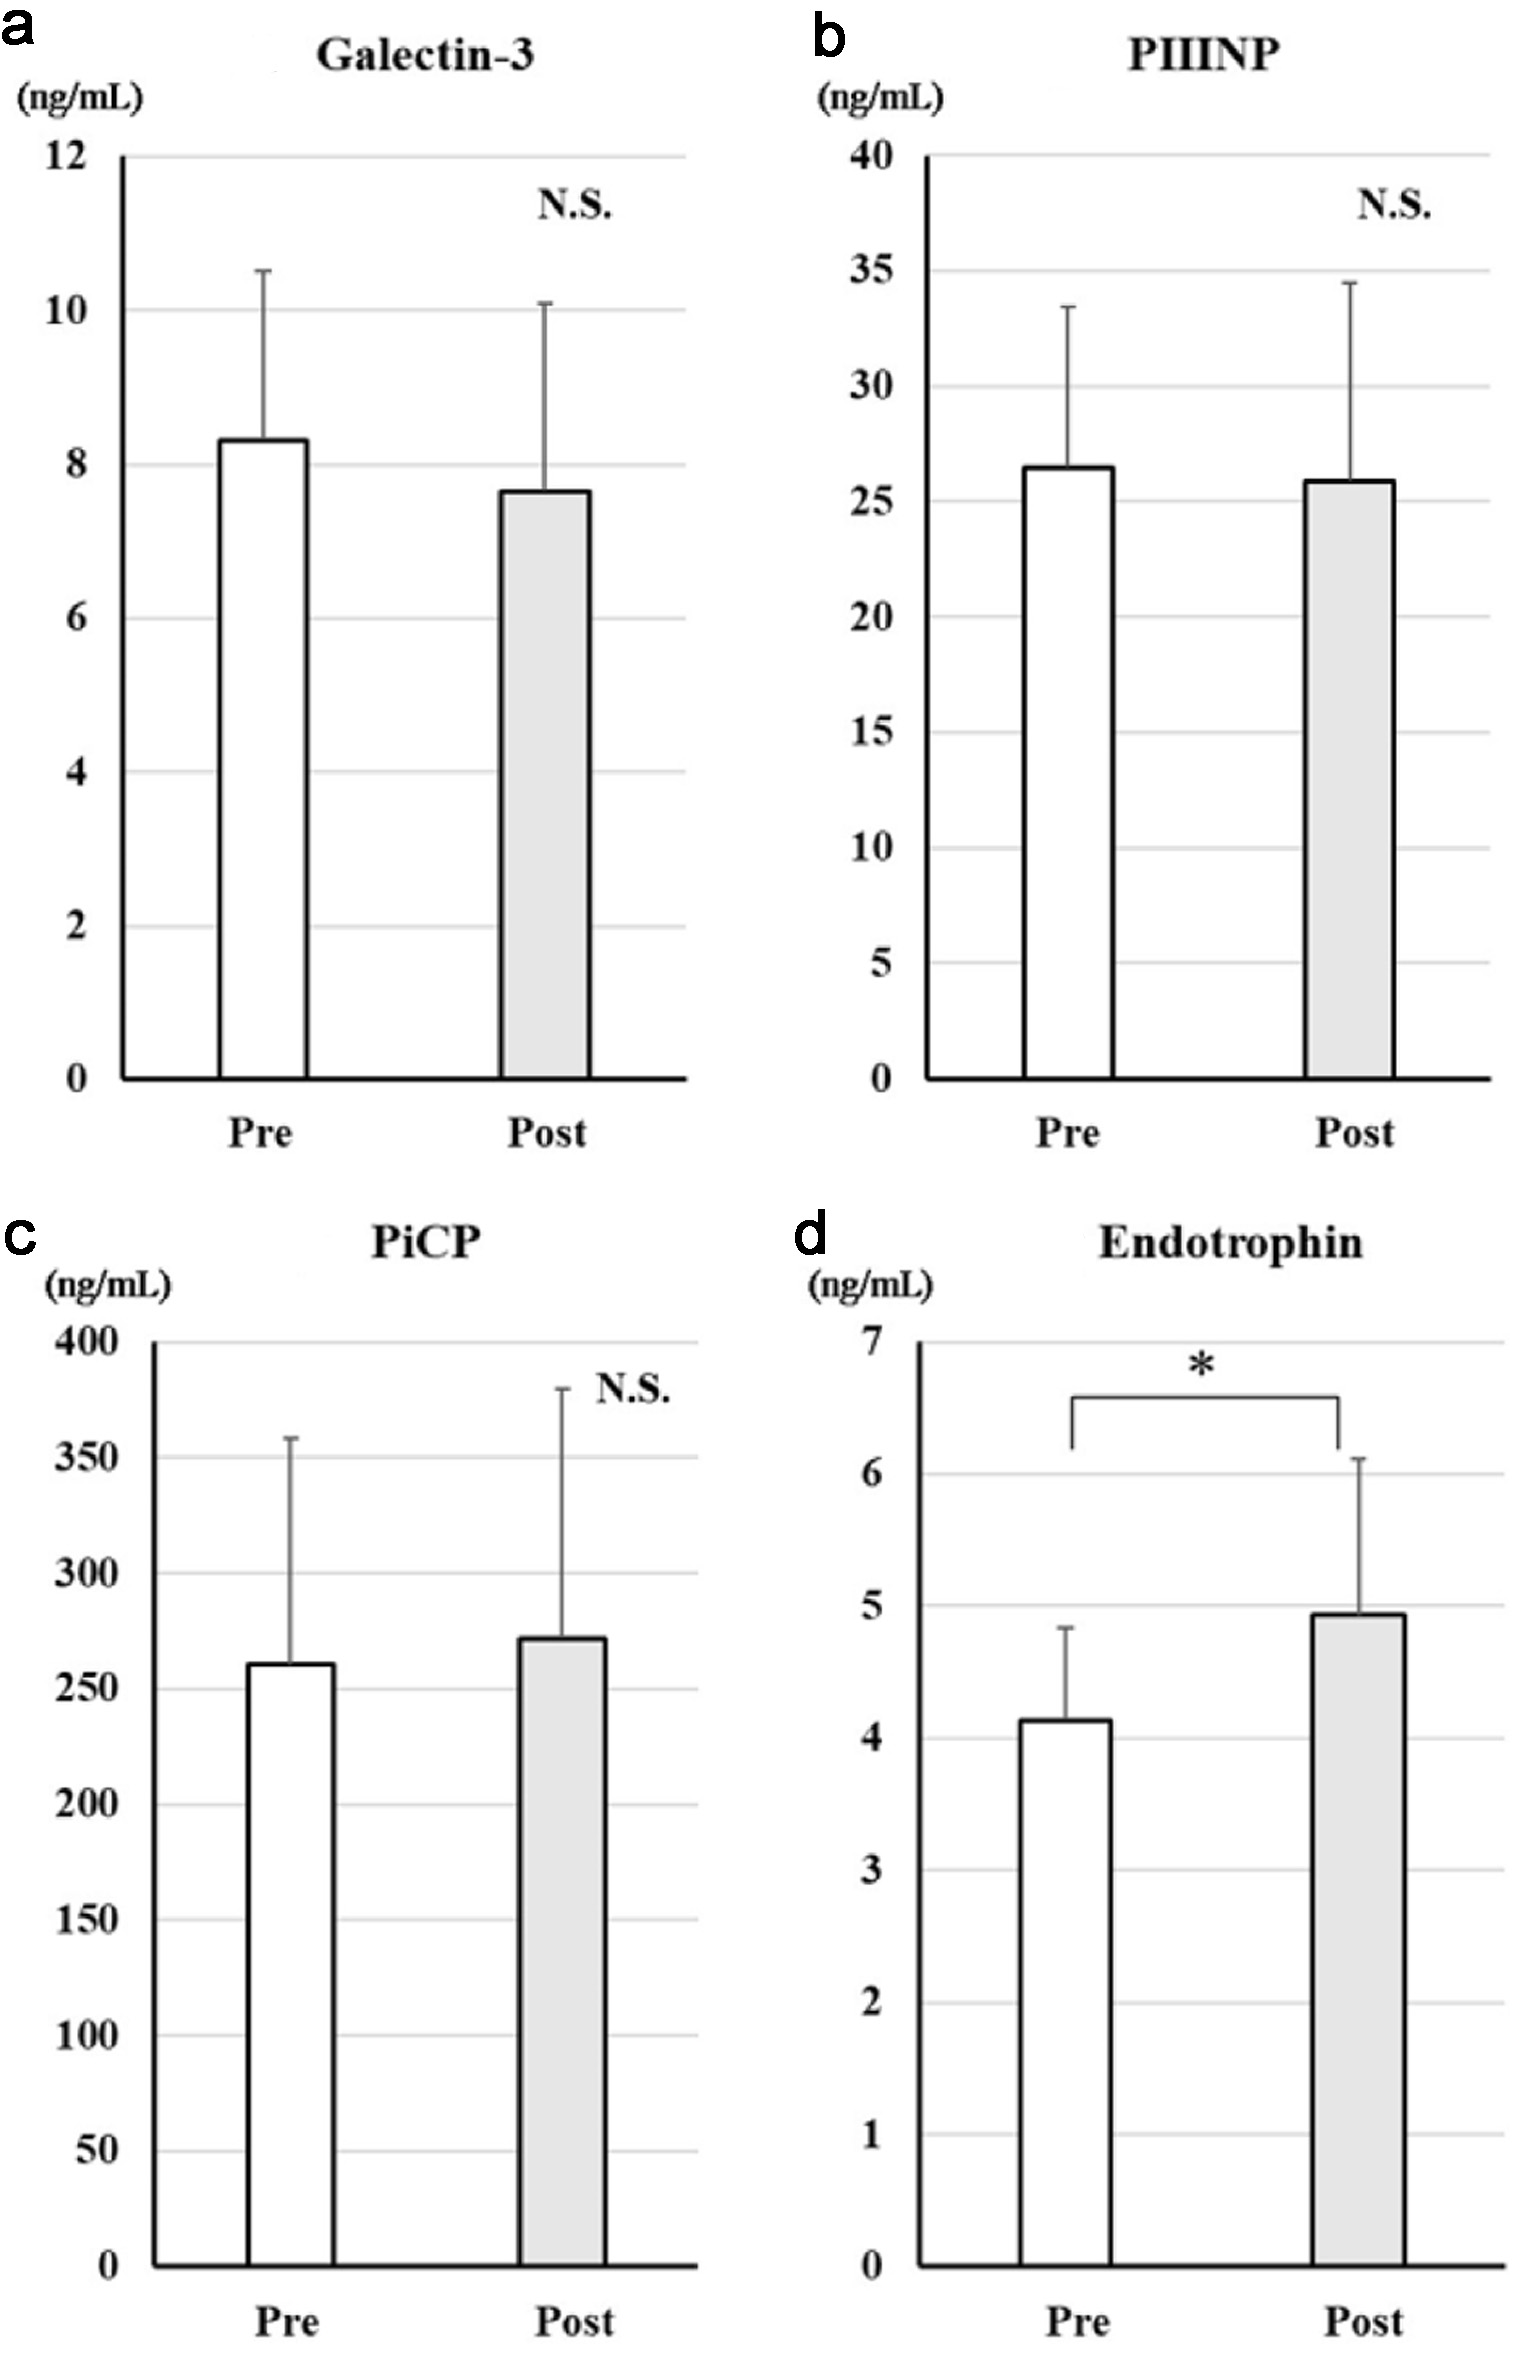
Cardiology Research, ISSN 1923-2829 print, 1923-2837 online, Open Access
Article copyright, the authors; Journal compilation copyright, Cardiol Res and Elmer Press Inc
Journal website https://cr.elmerpub.com

Original Article

Volume 16, Number 6, December 2025, pages 489-498


Anti-Oxidative Effect of Dapagliflozin, a Selective Sodium Glucose Transporter-2 Inhibitor, for Cardio-Renal Protection in Patients With Heart Failure With Reduced Ejection Fraction

Figures

Figure 1.
Figure 1. Changes in serum markers of fibrosis after treatment with dapagliflozin for 6 months. Changes in galectin-3 (a), PIIINP (b), PiCP (c), and endotrophin (d) before and after treatment with dapagliflozin. *Significant differences between before and after treatment. PIIINP: procollagen type III N-terminal propeptide; PiCP: procollagen type I C-terminal propeptide; NS: not significant.
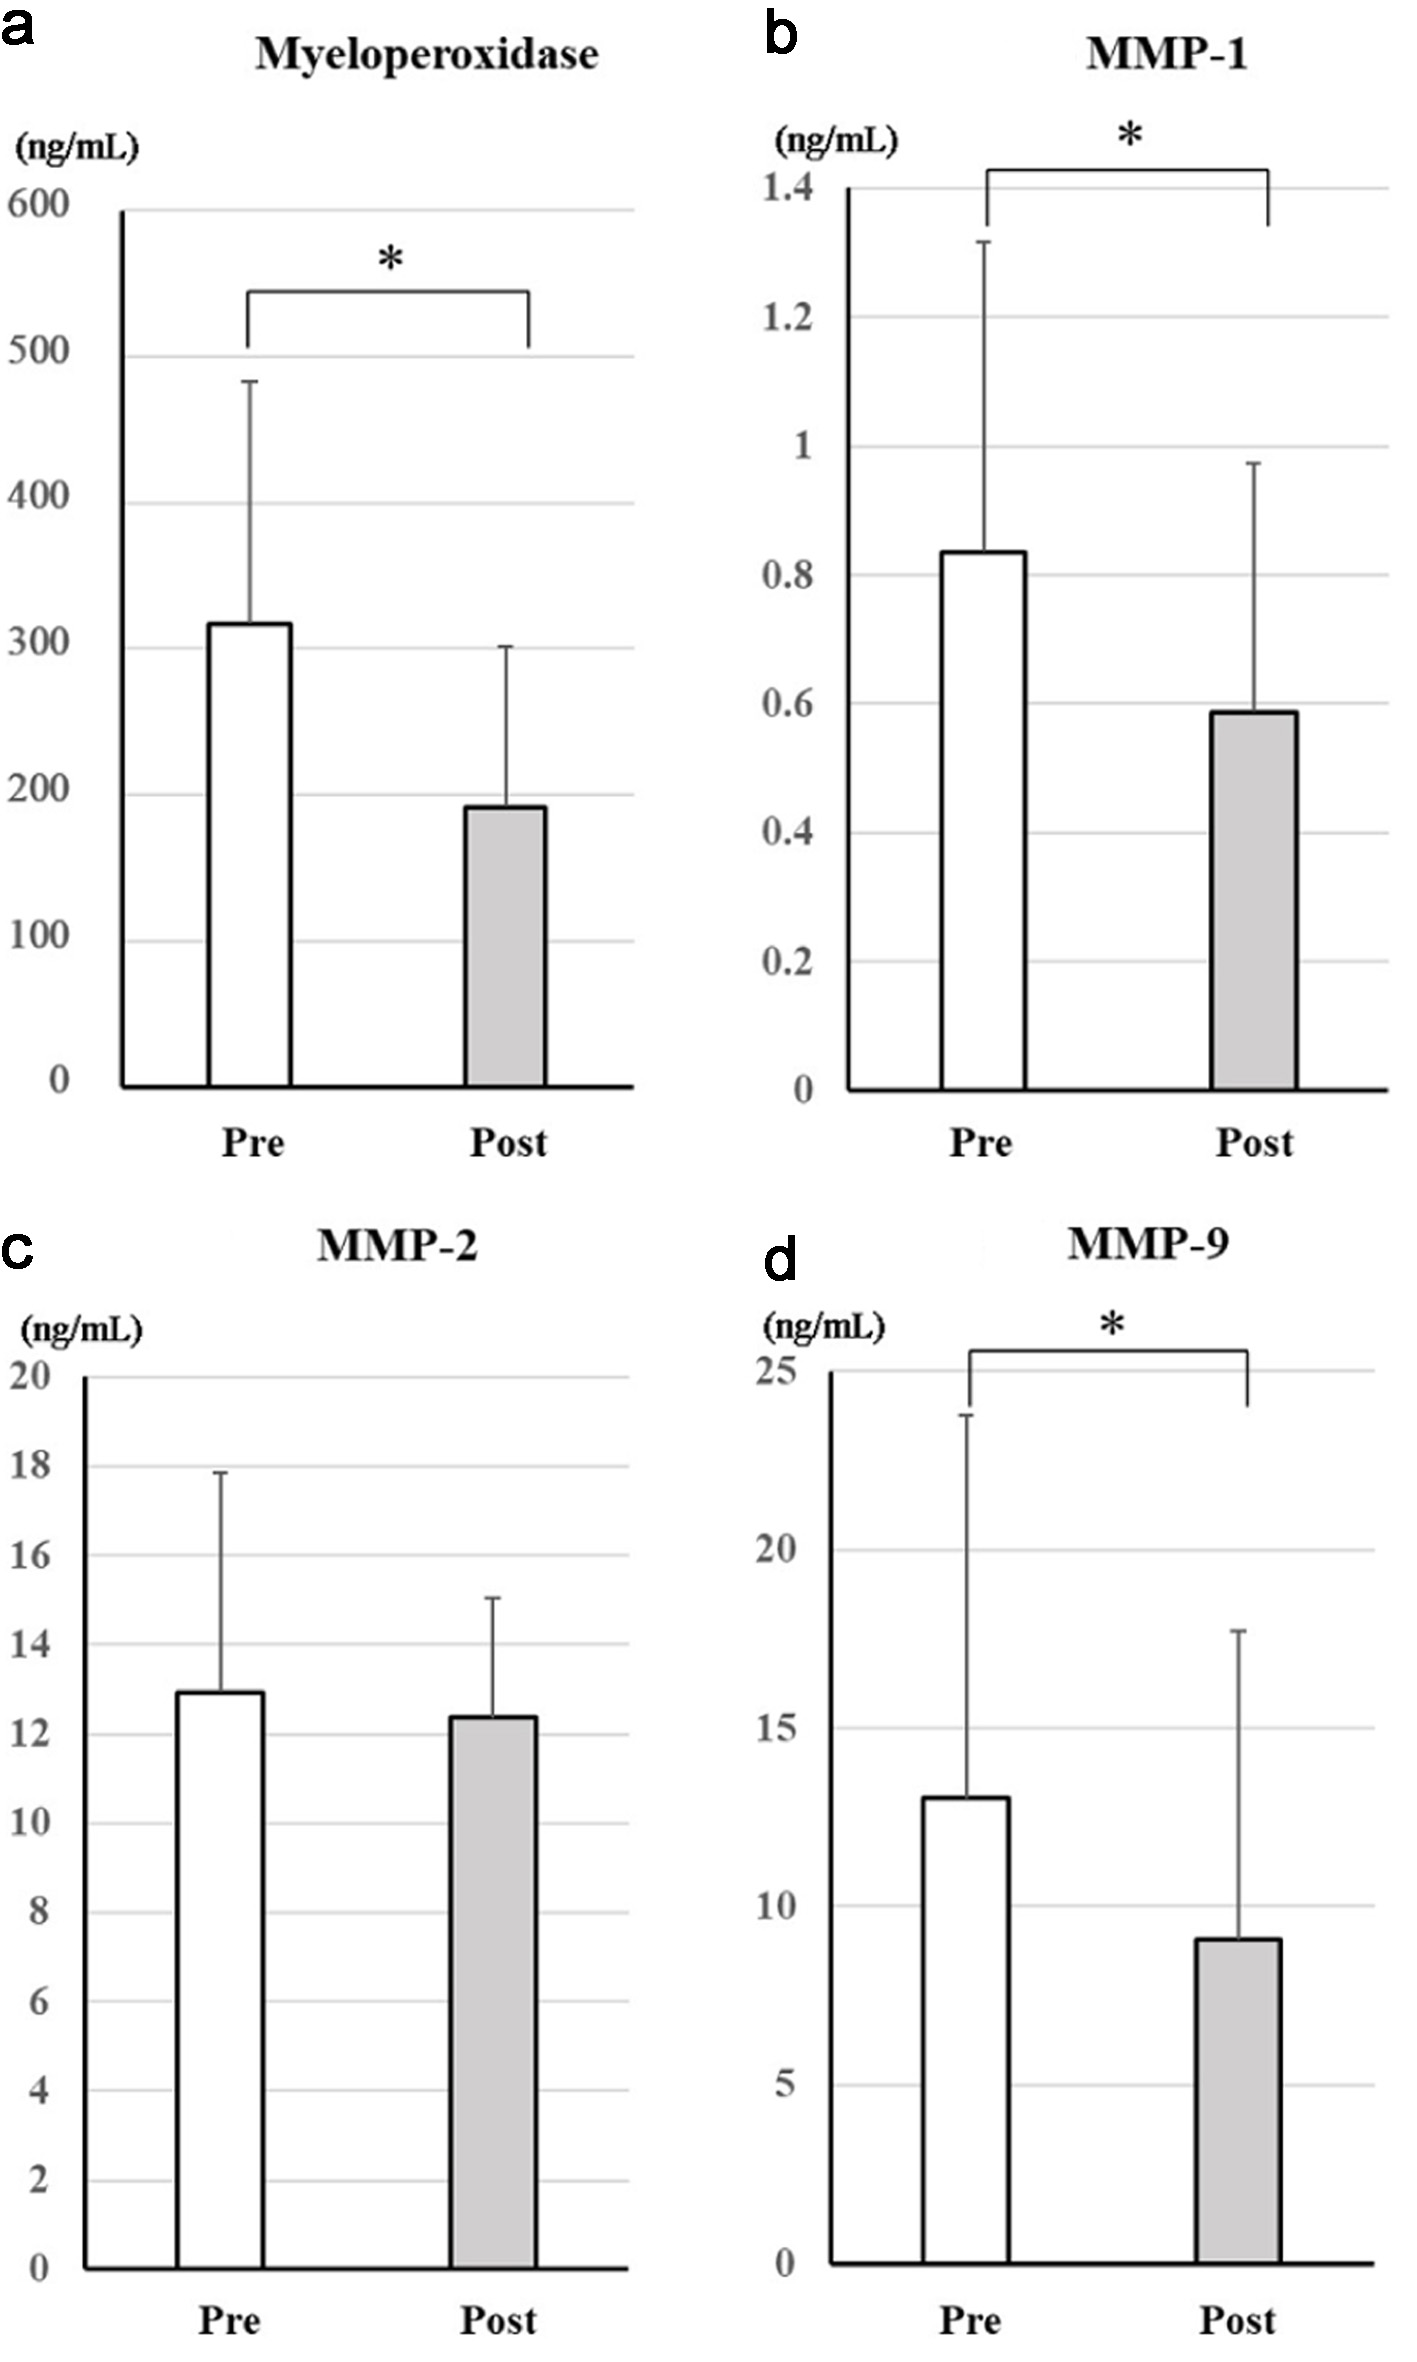
Figure 2.
Figure 2. Changes in serum markers of antioxidative effects after treatment with dapagliflozin for 6 months. Changes in myeloperoxidase (a), MMP-1 (b), MMP-2 (c), and MMP-9 (d) between before and after treatment with dapagliflozin. *Significant differences between before and after treatment. MMP-1: matrix metalloproteinase-1; MMP-2: matrix metalloproteinase-2; MMP-9: matrix metalloproteinase-9; NS: not significant.
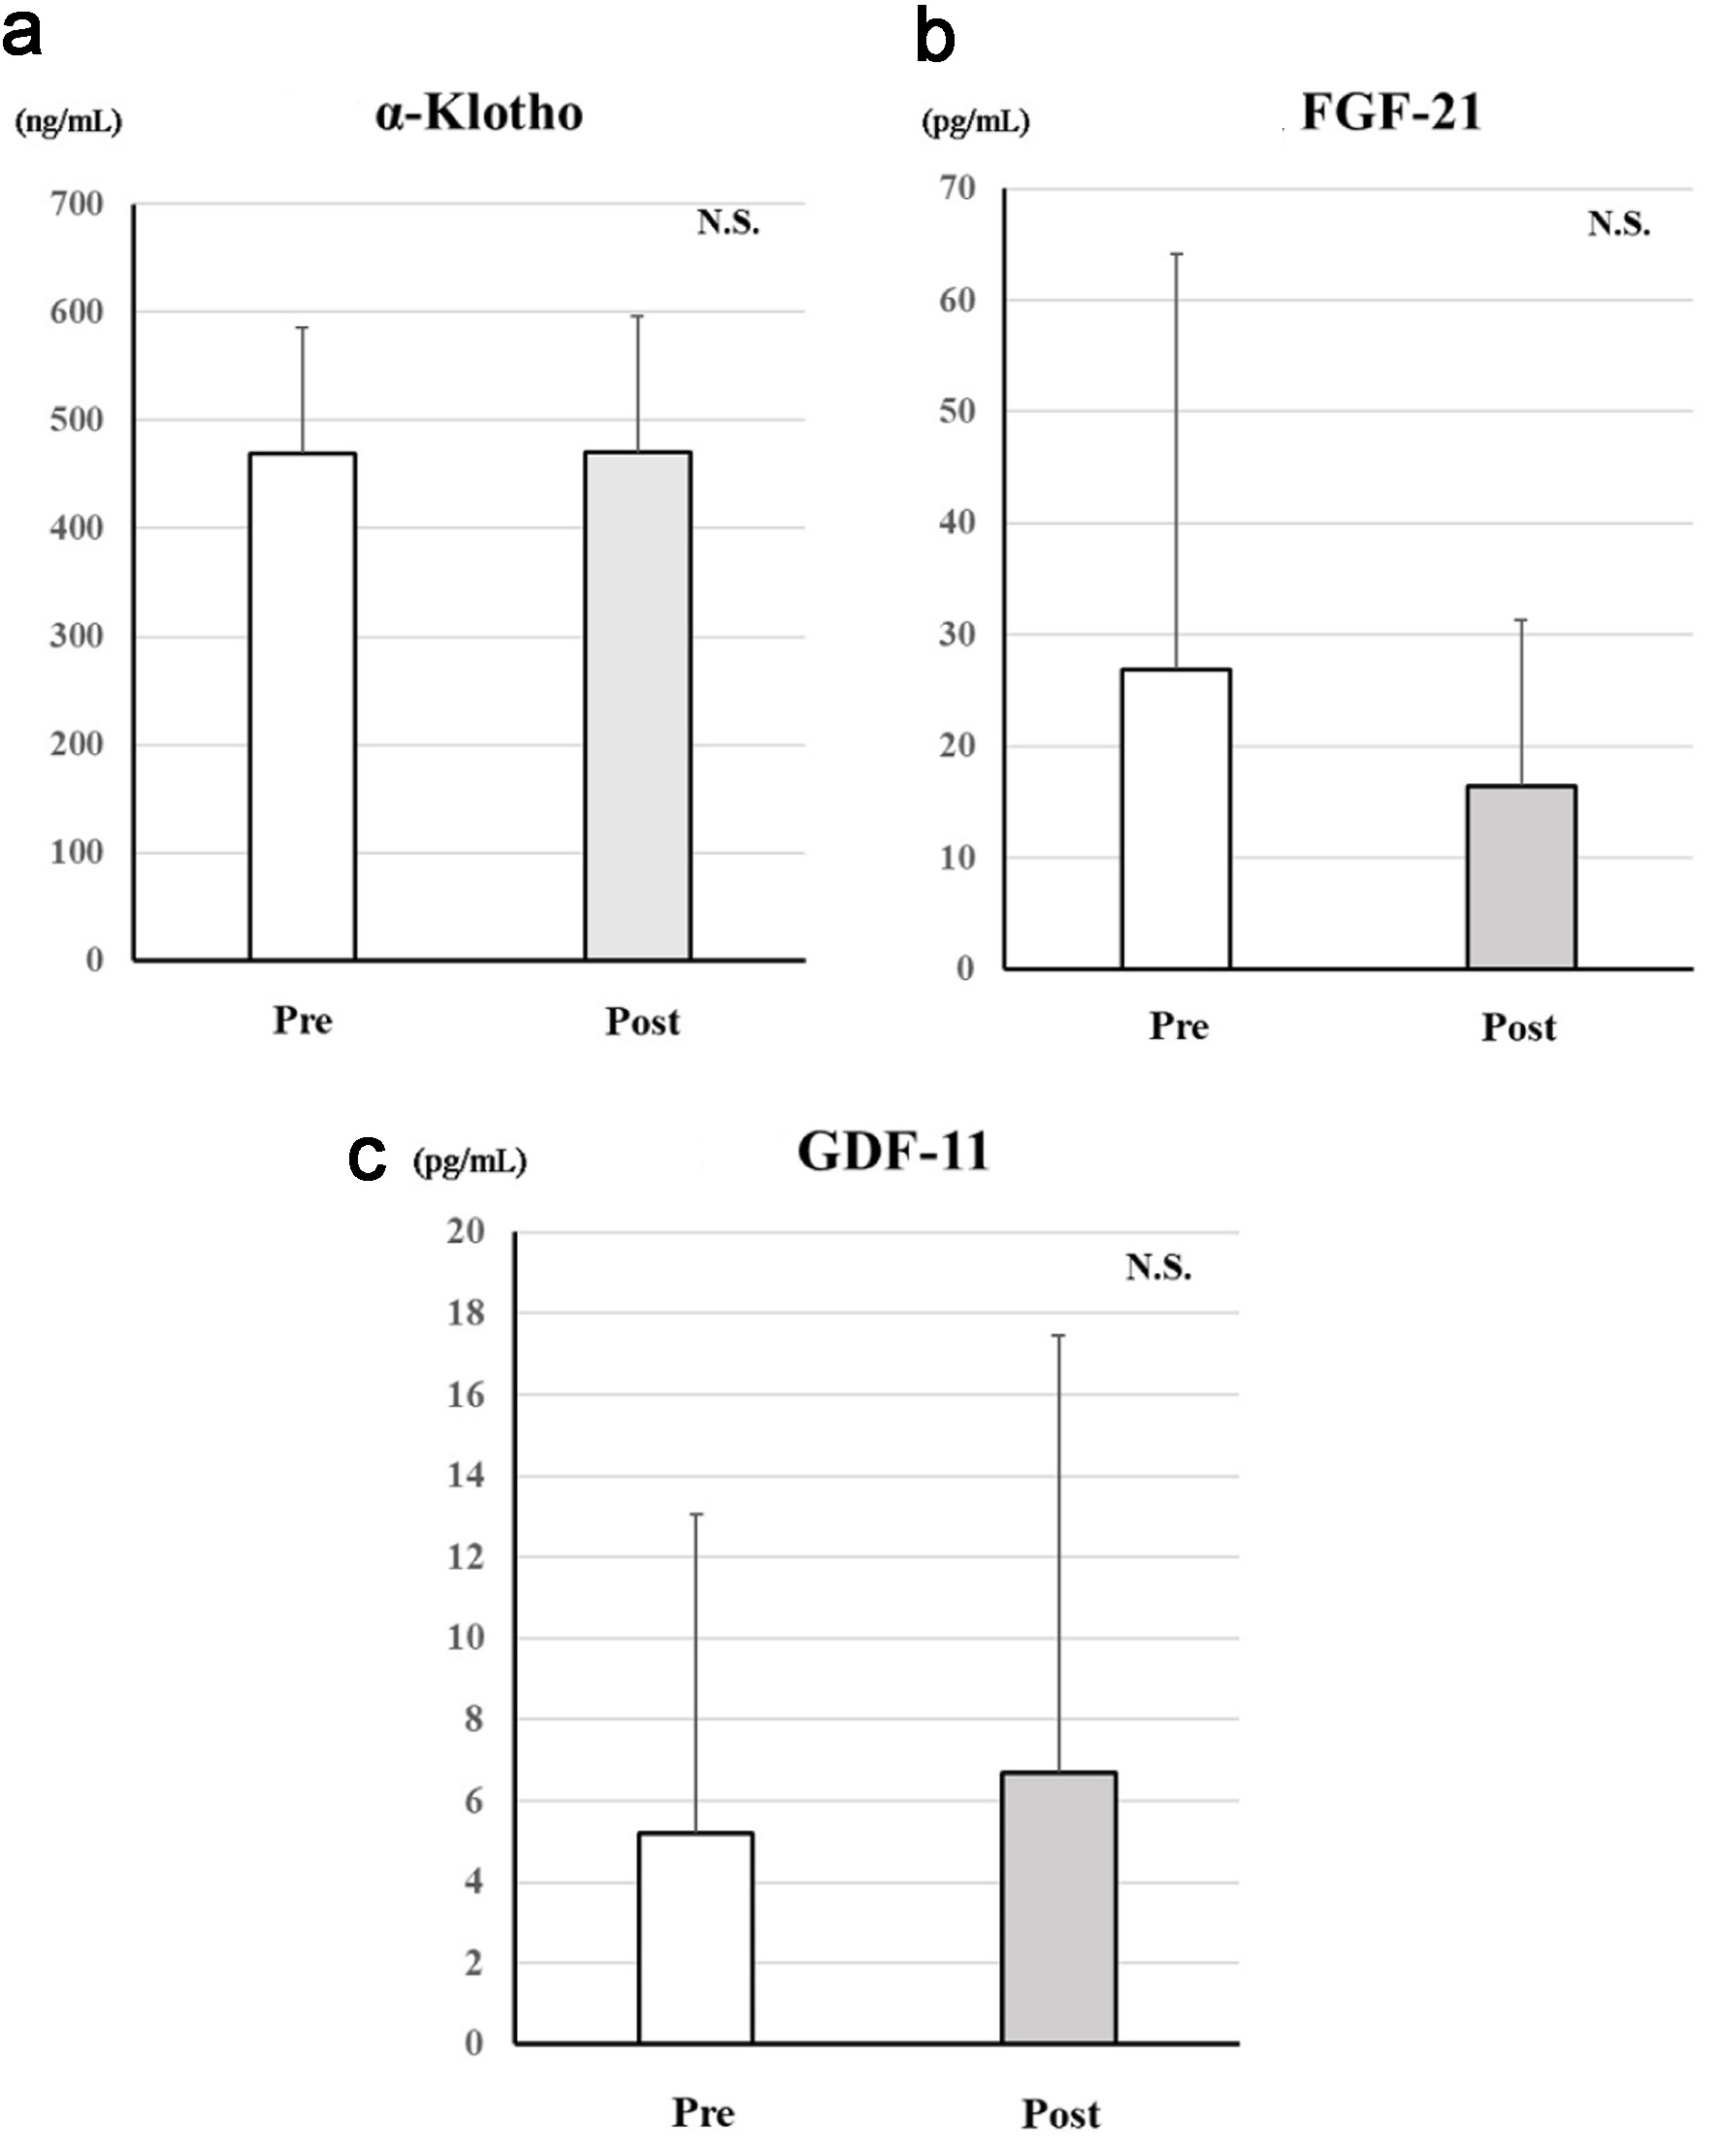
Figure 3.
Figure 3. Changes in serum age-related proteins after treatment with dapagliflozin for 6 months. Changes in α-Klotho (a), FGF-21 (b), and GDF-11 (c) between before and after treatment with dapagliflozin. *Significant differences between before and after treatment. FGF-21: fibroblast growth factor-21; GDF-11: growth differentiation factor-11; NS: not significant.

Tables

Table 1. Baseline Characteristics (n = 25)
 
Characteristics
Continuous variables are expressed as mean ± SD. AF: atrial fibrillation; CKD: chronic kidney disease; IHD: ischemic heart disease.
Age, years67.0 ± 13.6
Male, n (%)16 (64.0)
Smoking, n (%)19 (76.0)
Hypertension, n (%)14 (56.0)
Diabetes mellitus, n (%)4 (16.0)
Dyslipidemia, n (%)12 (48.0)
CKD, n (%)7 (28.0)
Cardiovascular disease
  IHD, n (%)9 (36.0)
  Cardiomyopathy, n (%)6 (24.0)
  AF, n (%)13 (52.0)


Table 2. Changes in Vital Signs and Medications After Treatment With Dapagliflozin for 6 Months (n = 25)
 
Before treatmentAfter treatment for 6 monthsP-value
Continuous variables are expressed as mean ± SD. ACEi/ARB/ARNi: angiotensin-converting-enzyme inhibitor/angiotensin II receptor blocker/angiotensin receptor neprilysin inhibitor; BMI: body mass index; BW: body weight; CCB: calcium channel blocker; DBP: diastolic blood pressure; MRA: mineralocorticoid receptor antagonist; SBP: systolic blood pressure.
BW, kg63.4 ± 12.460.2 ± 11.8< 0.001
BMI, kg/m224.0 ± 4.522.3 ± 4.1< 0.001
SBP, mm Hg123 ± 24117 ± 210.17
DBP, mm Hg79.3 ± 15.074.7 ± 12.60.10
Medications
  ARB/ACEi/ARNi, n (%)16 (64.0)18 (72.0)0.31
  β-blocker, n (%)19 (76.0)20 (80.0)0.65
  MRA, n (%)15 (60.0)15 (60.0)1.0
  Pimobendan, n (%)3 (12.0)3 (12.0)1.0
  CCB, n (%)6 (24.0)5 (20.0)0.56
  Diuretics, n (%)16 (64.0)14 (56.0)0.32
  Statin, n (%)9 (36.0)10 (40.0)0.56


Table 3. Changes in the Results of Biochemical Examinations
 
Before treatmentAfter treatment for 6 monthsP-value
Continuous variables are expressed as mean ± SD if they are parametric, and as median (interquartile range) if they are non-parametric. Alb: albumin; ALT: alanine aminotransferase; AST: aspartate aminotransferase; BNP: B-type natriuretic peptide; BUN: blood urea nitrogen; Cre: creatinine; CRP: C-reactive protein; eGFR: estimated glomerular filtration rate; Hb: hemoglobin; HCT: hematocrit; LDH: lactate dehydrogenase; L-FABP: liver-type fatty acid binding protein; NAG: N-acetyl-β-D-glycosaminidase; Plt: platelet; RBC: red blood cell; TP: total protein; WBC: white blood cell.
Blood findings
  WBC, × 103/µL6.70 ± 1.835.88 ± 1.650.01
  RBC, × 106/µL4.34 ± 0.714.74 ± 0.620.002
  Hb, g/dL13.0 ± 2.214.0 ± 1.70.003
  Plt, × 103/µL221 (179 - 262)228 ± 890.95
  HCT, %39.7 ± 6.643.3 ± 5.1< 0.001
  TP, g/dL6.8 ± 0.87.2 ± 0.60.008
  Alb, g/dL3.8 ± 0.64.2 ± 0.30.002
  AST, U/L23 (20 - 34)25.7 ± 9.30.14
  ALT, U/L22 (14 - 34)14 (10-27)0.03
  LDH, U/L227 (177 - 249)207 ± 610.12
  BUN, mg/dL18.6 ± 7.719.2 ± 5.70.69
  Cre, mg/dL1.01 (0.85 - 1.07)1.02 ± 0.220.47
  eGFR, mL/min/1.73 m256.3 ± 17.854.4 ± 15.20.43
  Ferritin, ng/mL147 ± 10883 (29 - 154)0.01
  CRP, mg/dL0.33 (0.05 - 1.67)0.08 (0.06 - 0.20)0.04
  BNP, pg/mL280 (169 - 537)229 ± 1710.03
Urinary findings
  NAG, IU/L15.1 ± 10.95.9 (2.8 - 10.8)0.03
  Cre, mg/dL121 ± 5976.2 ± 45.90.005
  Microalbumin, mg/L19.5 (6.0 - 52.0)10 (5 - 28)0.34
  L-FABP, ng/mL3.23 (1.30 - 6.82)2.41 ± 2.400.13


Table 4. Changes in Transthoracic Echocardiography Findings
 
BaselinePost-treatmentP value
Continuous variables are expressed as mean ± SD if they are parametric, and as median (interquartile range) if they are non-parametric. AOD: aortic dimension; E/A: ratio of early to late diastolic filling velocities; E/e’: ratio of early diastolic filling velocity to early diastolic mitral annular velocity; IVS: interventricular septum; LAD: left atrial dimension; LVPW: left ventricular posterior wall; LVDd: left ventricular end-diastolic dimension; LVDs: left ventricular end-systolic dimension; LVEDV: left ventricular end-diastolic volume; LVEF: left ventricular ejection fraction; LVESV: left ventricular end-systolic volume; TRPG: tricuspid regurgitation pressure gradient.
LAD, mm44.4 ± 11.243.0 ± 9.10.43
AOD, mm32.1 (29.7 - 33.3)32.0 ± 3.20.44
IVS, mm9.72 ± 2.519.38 ± 2.550.35
LVPW, mm10.6 ± 1.610.2 (9.4 - 10.8)0.37
LVDd, mm56.3 ± 9.253.9 ± 9.40.048
LVDs, mm48.5 ± 10.643.7 ± 11.10.005
LVEF, %30.5 ± 11.339.9 ± 14.50.002
LVEDV, mL137 ± 58115 ± 530.02
LVESV, mL98.0 ± 47.871.9 ± 46.00.009
E/A1.4 (0.9 - 2.0)0.7 (0.5 - 0.8)0.026
E/e’17.1 (12.2 - 24.0)12.7 ± 5.30.04
TRPG, mm Hg33.5 ± 23.317.5 (13.0 - 31.0)0.04