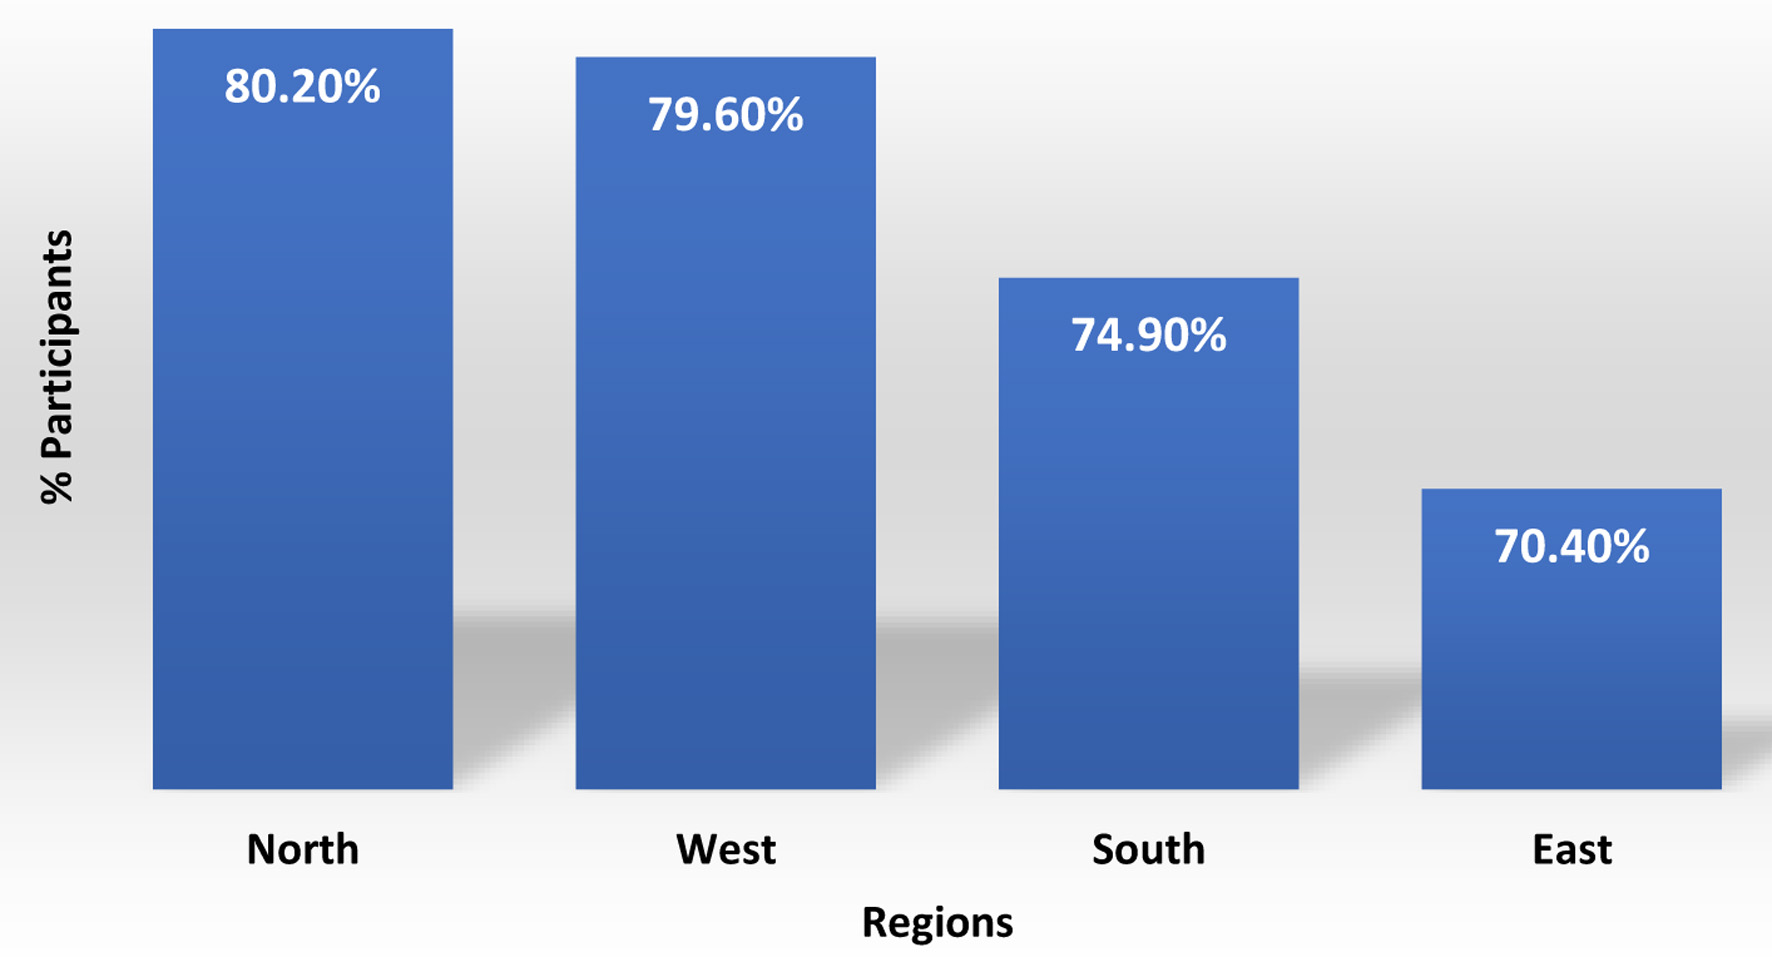
↓ Figure 1. Region-wise prevalence of hypertension.
| Cardiology Research, ISSN 1923-2829 print, 1923-2837 online, Open Access |
| Article copyright, the authors; Journal compilation copyright, Cardiol Res and Elmer Press Inc |
| Journal website https://cr.elmerpub.com |
Original Article
Volume 16, Number 5, October 2025, pages 403-412
BEAT-HTN India: Burden, Epidemiology, and Trends of Hypertension - A Nationwide Survey
Figures
Tables
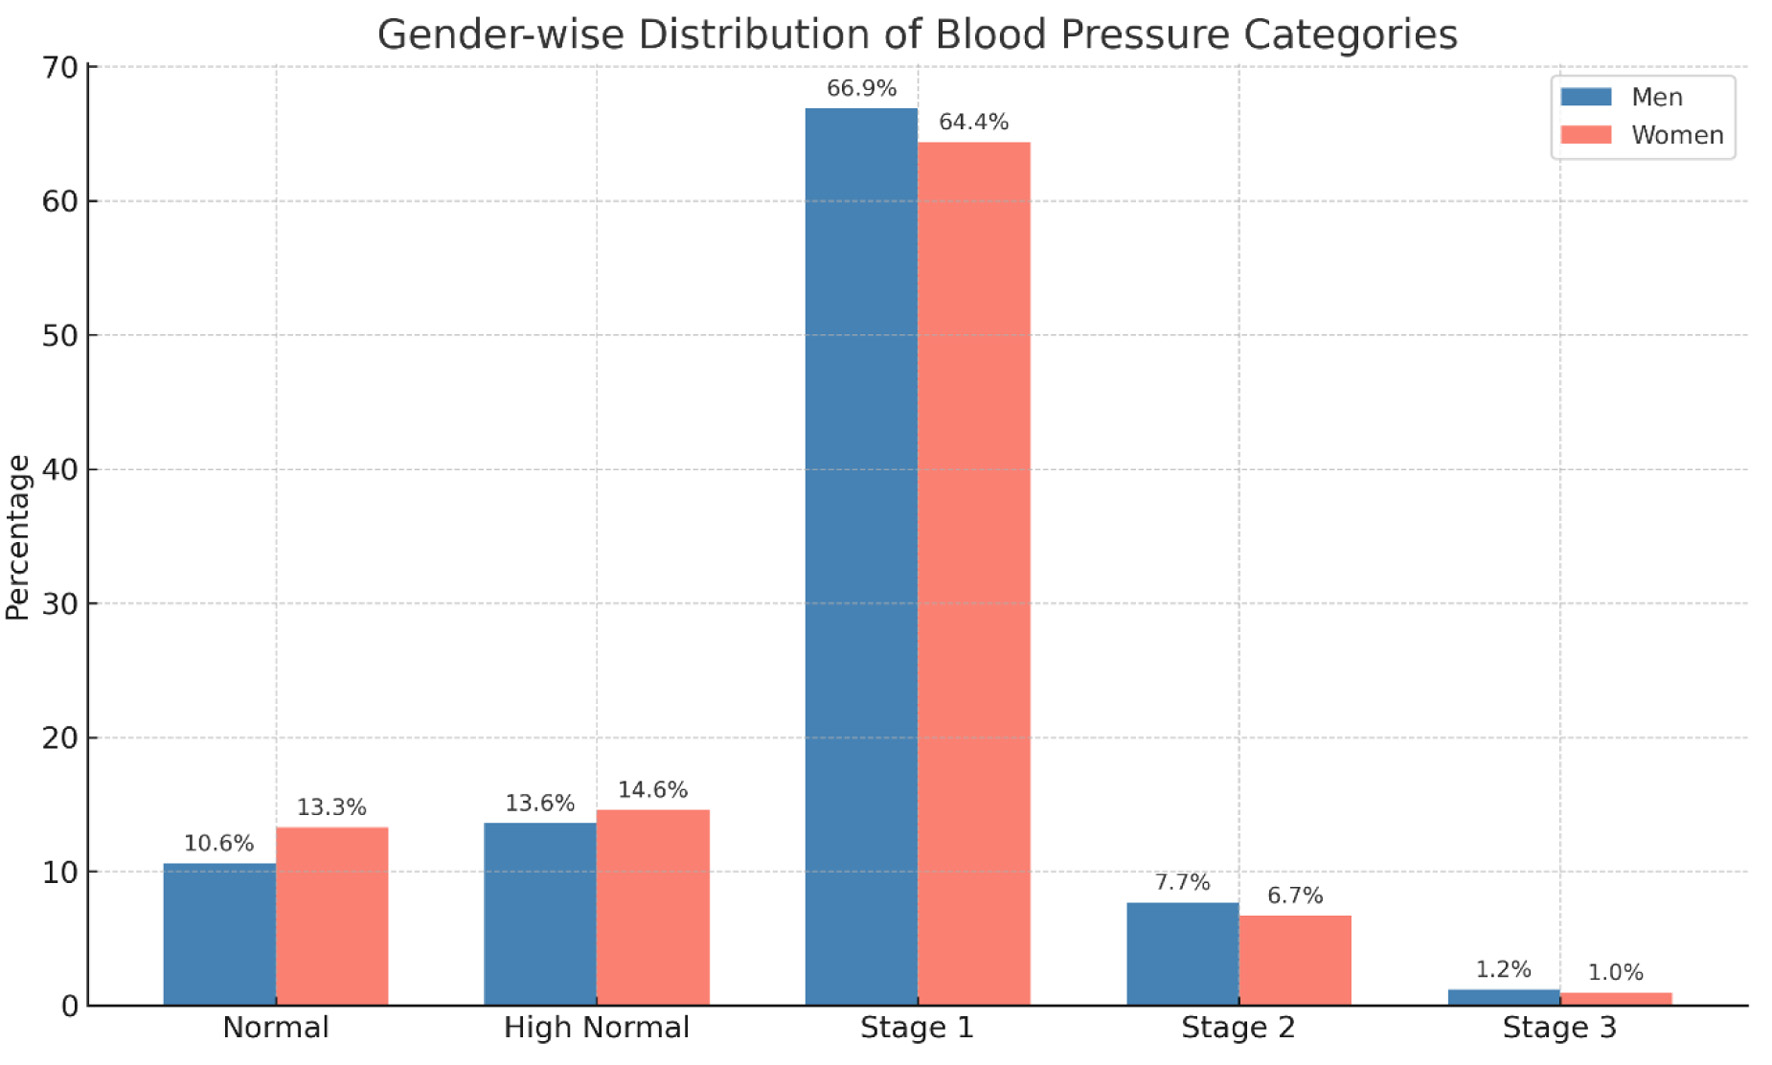
| Category | Systolic BP (mm Hg) | Diastolic BP (mm Hg) |
|---|---|---|
| BP: blood pressure. | ||
| Optimal | < 120 and | < 80 |
| Normal | < 130 and | < 85 |
| High-normal | 130 - 139 or | 85 - 89 |
| Stage 1 Hypertension | 140 - 159 or | 90 - 99 |
| Stage 2 Hypertension | 160 - 179 or | 100 - 109 |
| Stage 3 Hypertension | ≥ 180 or | > 110 |
| Characteristics | Men (n = 25,987) | Women (n = 15,383) | Total (n = 41,370) |
|---|---|---|---|
| BP: blood pressure; SD: standard deviation. | |||
| History of diabetes | 14,942 (57.5%) | 8,473 (55.1%) | 23,415 (56.6%) |
| Known history of HT | 19,145 (73.7%) | 10,854 (70.6%) | 29,999 (72.5%) |
| Mean age (years) | 53.6 (SD 12.0) | 53.0 (SD 11.9) | 53.4 (SD 11.9) |
| Average of SBP (mm Hg) | 146.2 (SD 18.3) | 144.8 (SD 18.8) | 145.7 (SD 18.5) |
| Average of DBP (mm Hg) | 89.8 (SD 10.9) | 88.8 (SD 11.2) | 89.4 (SD 11.0) |
| Average of heart rate (bpm) | 84.0 (SD 10.7) | 83.9 (SD 11.3) | 83.9 (SD 10.9) |
| Region | n | Normal | Prehypertensive | Hypertensive |
|---|---|---|---|---|
| North | 9,634 | 684 (7.1%) | 1,222 (12.7%) | 7,728 (80.2%) |
| South | 8,709 | 1,057 (12.1%) | 1,131 (13.0%) | 6,521 (74.9%) |
| East | 19,414 | 2,785 (14.3%) | 2,967 (15.3%) | 13,662 (70.4%) |
| West | 3,613 | 268 (7.4%) | 468 (13.0%) | 2,877 (79.6%) |
| State | n | Men | Women | % Men (> 140/90) | % Women (> 140/90) |
|---|---|---|---|---|---|
| Andhra Pradesh | 834 | 517 | 317 | 53% | 34% |
| Assam | 417 | 275 | 142 | 35% | 17% |
| Bihar | 1,652 | 1,057 | 595 | 48% | 24% |
| Chandigarh (UT) | 62 | 47 | 15 | 76% | 23% |
| Chhattisgarh | 181 | 112 | 69 | 51% | 33% |
| Delhi | 2,002 | 1,240 | 762 | 48% | 31% |
| Goa | 332 | 194 | 138 | 41% | 30% |
| Gujarat | 4,876 | 3,109 | 1,767 | 52% | 29% |
| Haryana | 386 | 278 | 108 | 58% | 22% |
| Himachal Pradesh | 58 | 40 | 18 | 69% | 31% |
| Jammu and Kashmir | 6 | 6 | 100% | 0% | |
| Jharkhand | 673 | 485 | 188 | 63% | 22% |
| Karnataka | 2,775 | 1,793 | 982 | 48% | 27% |
| Kerala | 1,624 | 978 | 646 | 50% | 30% |
| Madhya Pradesh | 1,279 | 867 | 412 | 56% | 27% |
| Maharashtra | 6,825 | 4,142 | 2,683 | 42% | 27% |
| Manipur | 20 | 11 | 9 | 40% | 30% |
| Meghalaya | 15 | 11 | 4 | 33% | 13% |
| Mizoram | 8 | 5 | 3 | 25% | 0% |
| Odisha | 2,271 | 1316 | 955 | 40% | 26% |
| Puducherry | 30 | 12 | 18 | 40% | 60% |
| Punjab | 237 | 148 | 89 | 53% | 31% |
| Rajasthan | 505 | 338 | 167 | 57% | 27% |
| Sikkim | 8 | 4 | 4 | 38% | 38% |
| Tamil Nadu | 2,148 | 1,152 | 996 | 42% | 33% |
| Telangana | 1,118 | 730 | 388 | 53% | 27% |
| Tripura | 69 | 41 | 28 | 32% | 20% |
| Uttar Pradesh | 2,173 | 1,401 | 772 | 51% | 28% |
| Uttarakhand | 289 | 203 | 86 | 55% | 25% |
| West Bengal | 8,497 | 5,475 | 3,022 | 47% | 23% |
| Overall | 18 - 30 years | 31 - 50 years | 51 - 65 years | > 65 years | |
|---|---|---|---|---|---|
| CI: confidence interval. | |||||
| Overall | 83.9 (83.8 - 84.1) | 80.0 (79.4 - 80.7) | 83.1 (83.0 - 83.3) | 84.6 (84.4 - 84.7) | 84.8 (84.5 - 85.1) |
| Men | 84.0 (83.8 - 84.1) | 80.4 (79.6 - 81.2) | 83.3 (83.1 - 83.5) | 84.4 (84.2 - 84.6) | 84.8 (84.5 - 85.2) |
| Women | 83.9 (83.7 - 84.1) | 79.5 (78.5 - 80.5) | 82.8 (82.6 - 83.1) | 84.8 (84.6 - 85.1) | 84.8 (84.3 - 85.3) |
| Group | n | Mean heart rate, bpm (95% CI) | Standard deviation |
|---|---|---|---|
| CI: confidence interval. | |||
| Diabetic hypertensives | 20,005 | 85.86 (85.70 - 86.02) | 11.2 |
| Others | 21,365 | 82.15 (82.01 - 82.29) | 10.5 |