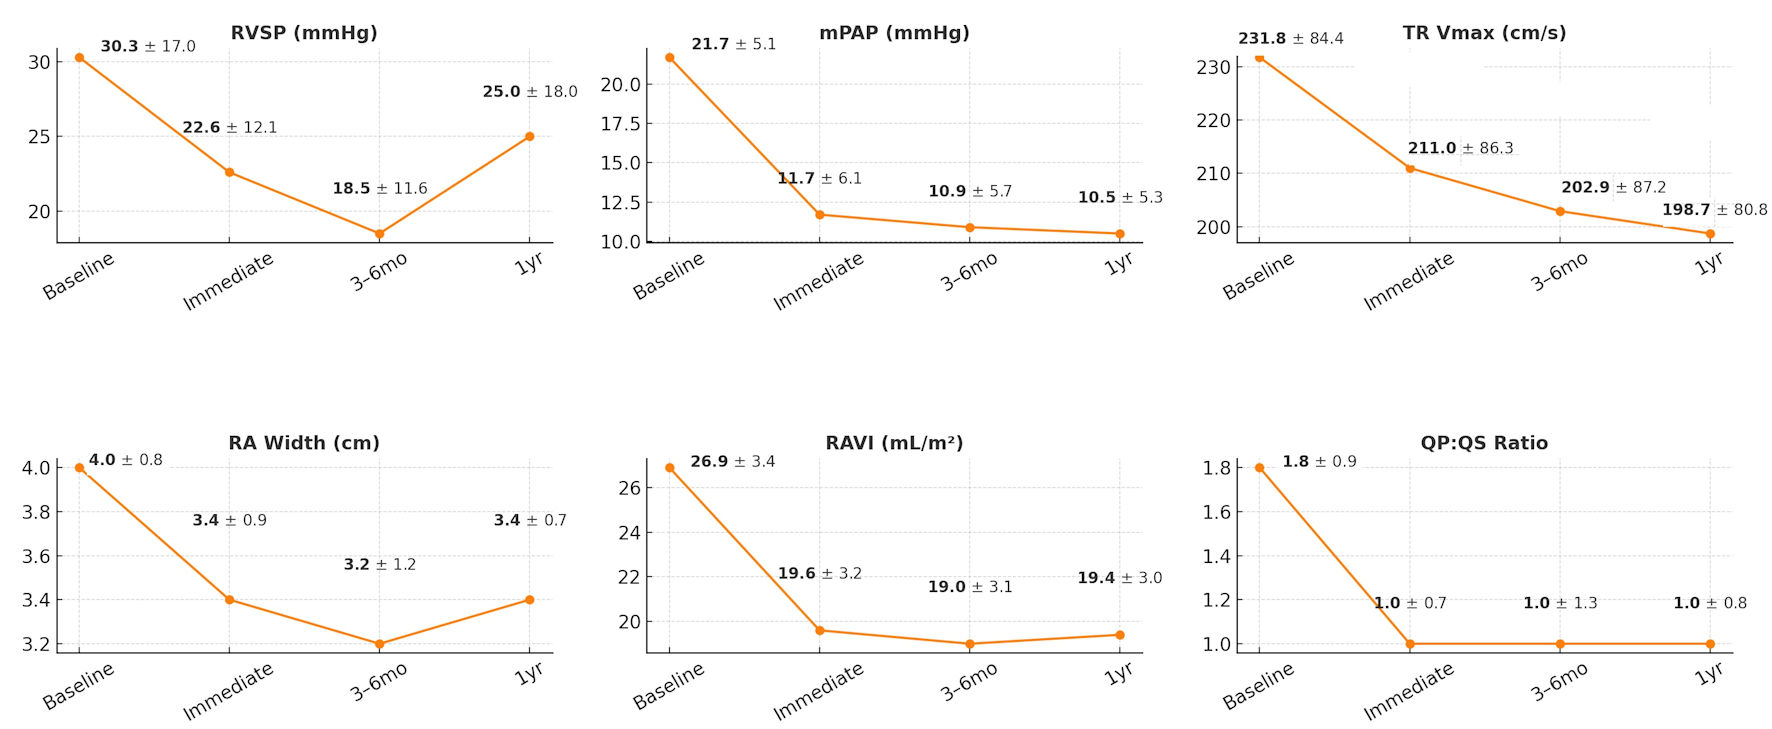
Cardiology Research, ISSN 1923-2829 print, 1923-2837 online, Open Access
Article copyright, the authors; Journal compilation copyright, Cardiol Res and Elmer Press Inc
Journal website https://cr.elmerpub.com

Original Article

Volume 16, Number 5, October 2025, pages 421-432


Echocardiographic Evaluation of Right Heart and Hemodynamic Changes After Transcatheter Secundum Atrial Septal Defect Closure in Adults: A Single-Center Retrospective Study

Figures

Figure 1.
Figure 1. Serial echocardiographic and hemodynamic changes following transcatheter ASD closure. Line graphs demonstrate changes in right ventricular systolic pressure (RVSP), mean pulmonary artery pressure (mPAP), tricuspid regurgitation velocity (TR Vmax), right atrial (RA) width, right atrial volume index (RAVI), and QP:QS ratio from baseline through immediate post-procedure, at 3 - 6 months, and at 1-year follow-up. Values are shown as mean ± standard deviation. Significant reductions were observed in RVSP, mPAP, TR Vmax, RA dimensions, and RAVI after ASD closure, with improvements maintained at follow-up. mo: months; yr: year; ASD: atrial septal defect.
Figure 2.
Figure 2. Distribution of tricuspid regurgitation (TR) severity before and after transcatheter ASD closure across follow-up intervals. The stacked bar graph illustrates the proportion of patients with normal, trace, mild, moderate, and severe TR at baseline (pre-procedure), immediately post-procedure, at early follow-up (3 - 6 months), and at 1-year follow-up. A significant reduction in moderate-to-severe TR was observed immediately after the procedure, with sustained improvement during follow-up. ASD: atrial septal defect.

Tables

Table 1. Baseline Demographic and Procedural Characteristics of Patients Undergoing Transcatheter ASD Closure (N = 80)
 
Values are expressed as mean ± SD or n (%). ASD: atrial septal defect; BSA: body surface area; SD: standard deviation.
Demographic characteristics
  Age (years)42.32 ± 15
    < 3020 (25.0%)
    30 - 4526 (32.5%)
    > 4534 (42.5%)
  Gender
    Male22 (27.5%)
    Female58 (72.5%)
  BSA (m2)1.72 ± 0.23
    < 1.621 (26.3%)
    1.6 - 1.837 (46.3%)
    > 1.822 (27.5%)
Procedural characteristics
  ASD size (cm)2.4 ± 0.6 (range 0.8 - 3.6)
    < 1.8 cm12 (15.0%)
    1.8 - 3.2 cm63 (79.0%)
    > 3.2 cm5 (6.0%)
  Device size (mm)Range 10 - 40 (most 24 - 36)
  Procedural success80 (100%)
  Residual shunt/major complications0 (0%)


Table 2. Immediate Post-Procedural Echocardiographic and Hemodynamic Changes (N = 80)
 
ParametersBeforeImmediateDifferenceWilcoxon signed-rank test
WP value
*P < 0.05; **P < 0.01. RA: right atrial; RAVI: right atrial volume index; RV: right ventricular; RVSP: RV systolic pressure; mPAP: mean pulmonary artery pressure; TAPSE: tricuspid annular plane systolic excursion; TR: tricuspid regurgitation; VTI: velocity time integral; RV S’ velocity: RV systolic velocity; LA: left atrial; LAVI: left atrial volume index; LV: left ventricular; LVEDVI: left ventricular end-diastolic volume index; EF: ejection fraction.
Blood flow velocities at the tricuspid valve orifice (TR Vmax, cm/s)231.8211.0-20.8-595.000.0005**
Pulmonary valve (Vmax, cm/s)148.0115.9-32.1-989.00< 0.0001**
Pulmonary valve (Vmean, cm/s)95.076.4-18.6-1,100.5< 0.0001**
Pulmonary valve (VTI, cm)31.124.2-6.9-1,076.5< 0.0001**
RA size (length, cm)5.15.0-0.1-488.000.018*
RA size (width, cm)4.03.4-0.6-972.50< 0.0001**
RA area (cm2)16.013.4-2.6698.0< 0.0001
RA volume index (RAVI, mL/m2)26.919.6-7.0583.0< 0.0001
RV size (length, cm)6.57.10.6754.50.0002**
RV size (base width, cm)4.14.20.1-250.500.2317
RV/LV ratio1.01.00.0351.50.0919
RV S’ velocity (cm/s)13.212.0-1.2-393.50.0586
TAPSE (cm)2.22.40.2814.5< 0.0001**
LA size (LAVI, mL/m2)28.627.3-1.3-274.50.1897
LV size (LVEDVI, mL/m2)43.941.2-2.7-299.500.152
EF (%)57.756.5-1.2-239.000.2542
RVSP (mm Hg)30.322.6-7.7-917.00< 0.0001**
mPAP (mm Hg)21.711.7-10.0-687.000.0007**
QP:QS1.81.0-0.8-903.5< 0.0001**


Table 3. Echocardiographic Changes at Early (3 - 6 Months) Follow-Up (N = 54)
 
ParametersBeforeEarly postDifferenceWilcoxon signed-rank test
WP value
*P < 0.05; **P < 0.01. RA: right atrial; RAVI: right atrial volume index; RV: right ventricular; RVSP: RV systolic pressure; mPAP: mean pulmonary artery pressure; TAPSE: tricuspid annular plane systolic excursion; TR: tricuspid regurgitation; VTI: velocity time integral; RV S’ velocity: RV systolic velocity; LA: left atrial; LAVI: left atrial volume index; LV: left ventricular; LVEDVI: left ventricular end-diastolic volume index; EF: ejection fraction.
Blood flow velocities at the tricuspid valve orifice (TR Vmax, cm/s)231.8202.9-28.9-695.000.0006**
Pulmonary valve (Vmax, cm/s)148.0113.8-34.2-350.000.003**
Pulmonary valve (Vmean, cm/s)95.073.6-21.4-345.000.0035**
Pulmonary valve (VTI, cm)31.122.2-8.9-347.000.0028**
RA size (length, cm)5.14.9-0.2-389.500.0007**
RA size (width, cm)4.03.2-0.8-470.00< 0.0001**
RA area (cm2)16.012.3-3.7275.0< 0.0001
RA volume index (RAVI, mL/m2)26.919.0-7.9232.0< 0.0001
RV size (length, cm)6.56.4-0.11880.1157
RV size (base width, cm)4.14.10.0-180.000.1322
RV/LV ratio1.00.9-0.111.50.9243
RV S’ velocity (cm/s)13.213.50.3-172.000.1512
TAPSE (cm)2.22.20.0-13.000.9144
LA size (LAVI, mL/m2)28.628.2-0.4-247.000.0373*
LV size (LVEDVI, mL/m2)43.943.2-0.7-217.000.0686
EF (%)57.758.60.9-9.000.9407
RVSP (mm Hg)30.318.5-11.8-390.000.0008**
mPAP (mm Hg)21.710.9-10.8-232.000.005**
QP:QS1.81.0-0.8-360.000.002**


Table 4. Echocardiographic Changes Between Early Follow-Up and at 1 year (N = 19)
 
ParametersEarly post1 YearDifferenceWilcoxon signed-rank test
WP value
*P < 0.05; **P < 0.01. RA: right atrial; RAVI: right atrial volume index; RV: right ventricular; RVSP: RV systolic pressure; mPAP: mean pulmonary artery pressure; TAPSE: tricuspid annular plane systolic excursion; TR: tricuspid regurgitation; VTI: velocity time integral; RV S’ velocity: RV systolic velocity; LA: left atrial; LAVI: left atrial volume index; LV: left ventricular; LVEDVI: left ventricular end-diastolic volume index; EF: ejection fraction.
Blood flow velocities at the tricuspid valve orifice (TR Vmax, cm/s)202.9198.7-4.2-50.000.050*
Pulmonary valve (Vmax, cm/s)113.895.9-17.9-65.000.006**
Pulmonary valve (Vmean, cm/s)73.667.4-6.2-60.000.008**
Pulmonary valve (VTI, cm)22.218.6-3.6-65.000.007**
RA size (length, cm)4.94.7-0.2-29.500.2574
RA size (width, cm)3.23.40.230.000.3000
RA area (cm2)12.312.60.38.00.6875
RA volume index (RAVI, mL/m2)19.019.40.47.00.56
RV size (length, cm)6.46.1-0.35.500.9174
RV size (base width, cm)4.13.6-0.5-47.500.0553
RV/LV ratio0.90.8-0.1-59.000.016*
RV S’ velocity (cm/s)13.513.3-0.2-4.000.8828
TAPSE (cm)2.22.1-0.1-13.000.5247
LA size (LAVI, mL/m2)28.228.0-0.2-18.500.4951
LV size (LVEDVI, mL/m2)43.243.20.0-11.500.7033
EF (%)58.658.0-0.6-7.500.8536
RVSP (mm Hg)18.525.06.550.000.0500
mPAP (mm Hg)10.910.5-0.4-59.000.0155*
QP:QS1.01.00.00.001.0000


Table 5. Comparison of Baseline and 1-Year Follow-Up Echocardiographic Parameters (N = 19)
 
ParametersBefore1 yearDifferenceWilcoxon signed-rank test
WP value
*P < 0.05; **P < 0.01. RA: right atrial; RAVI: right atrial volume index; RV: right ventricular; RVSP: RV systolic pressure; mPAP: mean pulmonary artery pressure; TAPSE: tricuspid annular plane systolic excursion; TR: tricuspid regurgitation; VTI: velocity time integral; RV S’ velocity: RV systolic velocity; LA: left atrial; LAVI: left atrial volume index; LV: left ventricular; LVEDVI: left ventricular end-diastolic volume index; EF: ejection fraction.
Blood flow velocities at the tricuspid valve orifice (TR Vmax, cm/s)231.8198.7-33.1-52.00.036*
Pulmonary valve (Vmax, cm/s)148.095.9-52.1-70.00.001**
Pulmonary valve (Vmean, cm/s)95.067.4-27.6-71.50.001**
Pulmonary valve (VTI, cm)31.118.6-12.5-70.50.001**
RA size (length, cm)5.14.7-0.4-38.00.123
RA size (width, cm)4.03.4-0.6-55.50.013*
RA area (cm2)16.012.6-3.444.00.040
RA volume index (RAVI, mL/m2)26.919.4-7.543.00.036
RV size (length, cm)6.56.1-0.4-3.00.952
RV size (base width, cm)4.13.6-0.5-44.50.059
RV/LV ratio1.00.8-0.2-55.50.013*
RV S’ velocity (cm/s)13.213.30.1-37.00.110
TAPSE (cm)2.22.1-0.1-30.00.186
LA size (LAVI, mL/m2)28.628.0-0.6-4.00.874
LV size (LVEDVI, mL/m2)43.943.2-0.736.00.129
EF (%)57.758.00.3-23.50.319
RVSP (mm Hg)30.325.0-5.3-55.00.013*
mPAP (mm Hg)21.710.5-10.2-51.00.024*
QP:QS1.81.0-0.8-55.50.013*


Table 6. Change in Tricuspid Regurgitation Severity Across Timepoints (Chi-square Analyses)
 
Comparison (n)TR SeverityNone, n (%)Trace, n (%)Mild, n (%)Moderate, n (%)Severe, n (%)Chi-square tests
χ2P value
*P < 0.05; **P < 0.01. TR: tricuspid regurgitation.
Baseline vs. immediate post (n = 80)Immediate0 (0)2 (2.5)3 (3.8)0 (0)0 (0)48.82< 0.0001**
Trace2 (2.5)11 (13.8)3 (3.8)1 (1.3)0 (0)
Mild0 (0)14 (17.5)13 (16.3)16 (20)3 (3.8)
Moderate0 (0)0 (0)1 (1.3)7 (8.8)1 (1.3)
Severe0 (0)0 (0)1 (1.3)0 (0)2 (2.5)
Baseline vs. early post (3 - 6 months) (n = 54)Early post0 (0)2 (3.7)0 (0)0 (0)0 (0)50.89< 0.0001**
Trace3 (5.6)10 (18.5)3 (5.6)0 (0)0 (0)
Mild3 (5.6)4 (7.4)7 (13.0)1 (1.9)1 (1.9)
Moderate0 (0)3 (5.6)6 (11.1)8 (14.8)0 (0)
Severe0 (0)0 (0)0 (0)1 (1.9)2 (3.7)
Early post (3 - 6 months) vs. one year (n = 19)1 year1 (5.3)2 (10.5)0 (0)0 (0)0 (0)35.820.003**
Trace5 (26.3)2 (10.5)1 (5.3)1 (5.3)0 (0)
Mild1 (5.3)0 (0)2 (10.5)1 (5.3)0 (0)
Moderate0 (0)0 (0)0 (0)2 (10.5)0 (0)
Severe0 (0)0 (0)0 (0)0 (0)1 (5.3)
Baseline vs. 1 year (n = 19)1 year2 (10.5)0 (0)0 (0)0 (0)2 (10.5)26.270.010**
Trace4 (21.1)2 (10.5)3 (15.8)0 (0)0 (0)
Mild1 (5.3)1 (5.3)3 (15.8)0 (0)0 (0)
Moderate0 (0)0 (0)2 (10.5)0 (0)0 (0)
Severe0 (0)0 (0)0 (0)1 (5.3)1 (5.3)


Table 7. Adjusted Mixed-Effects Models for Key Echocardiographic Parameters
 
OutcomeTimepoint (vs. baseline)Adjusted estimate (95% CI)P value
Adjusted mixed-effects models included age, sex, and baseline ASD size (and device size where available) as fixed covariates, with a random intercept for each subject. Estimates represent mean differences (95% CIs) from baseline for continuous variables. Additional sensitivity analyses incorporating medication category (Table 8) yielded similar results. CI: confidence interval; ASD: atrial septal defect; RAVI: right atrial volume index; RV: right ventricular; RVSP: RV systolic pressure; mPAP: mean pulmonary artery pressure; TR: tricuspid regurgitation; LV: left ventricular.
RVSP (mm Hg)Immediate post-7.4 (-9.8 to -5.0)< 0.001
3 - 6 months-8.1 (-10.7 to -5.5)< 0.001
1 year-5.2 (-9.8 to -0.6)0.027
mPAP (mm Hg)Immediate post-4.8 (-7.1 to -2.5)< 0.001
3 - 6 months-5.6 (-8.4 to -2.7)< 0.001
1 year-4.9 (-9.0 to -0.8)0.020
TR velocity (m/s)Immediate post-0.34 (-0.50 to -0.18)< 0.001
3 - 6 months-0.36 (-0.54 to -0.18)< 0.001
1 year-0.28 (-0.55 to -0.01)0.044
RAVI (mL/m2)Immediate post-6.8 (-9.5 to -4.1)< 0.001
3 - 6 months-7.5 (-10.4 to -4.6)< 0.001
1 year-6.2 (-10.1 to -2.3)0.003
RV/LV ratioImmediate post-0.12 (-0.16 to -0.08)< 0.001
3 - 6 months-0.15 (-0.20 to -0.10)< 0.001
1 year-0.11 (-0.19 to -0.03)0.007


Table 8. Cardio-Active Medication Use Across Follow-Up
 
Medication classBaseline (n = 80)Immediate post (n = 80)3 - 6 months (n = 54)1 year (n = 19)
Medication use was stable across follow-up and was included as a covariate in adjusted models (Table 7). ACEI/ARB/ARNI: angiotensin-converting enzyme inhibitors/angiotensin receptor blockers/angiotensin receptor-neprilysin inhibitors.
Beta-blockers24 (30%)23 (29%)15 (28%)5 (26%)
ACEI/ARB/ARNI20 (25%)19 (24%)14 (26%)4 (21%)
Diuretics28 (35%)26 (33%)17 (31%)7 (37%)
Pulmonary vasodilators6 (8%)5 (6%)3 (6%)1 (5%)
Antiarrhythmics9 (11%)9 (11%)6 (11%)2 (11%)
Other cardio-active medications5 (6%)4 (5%)3 (6%)1 (5%)