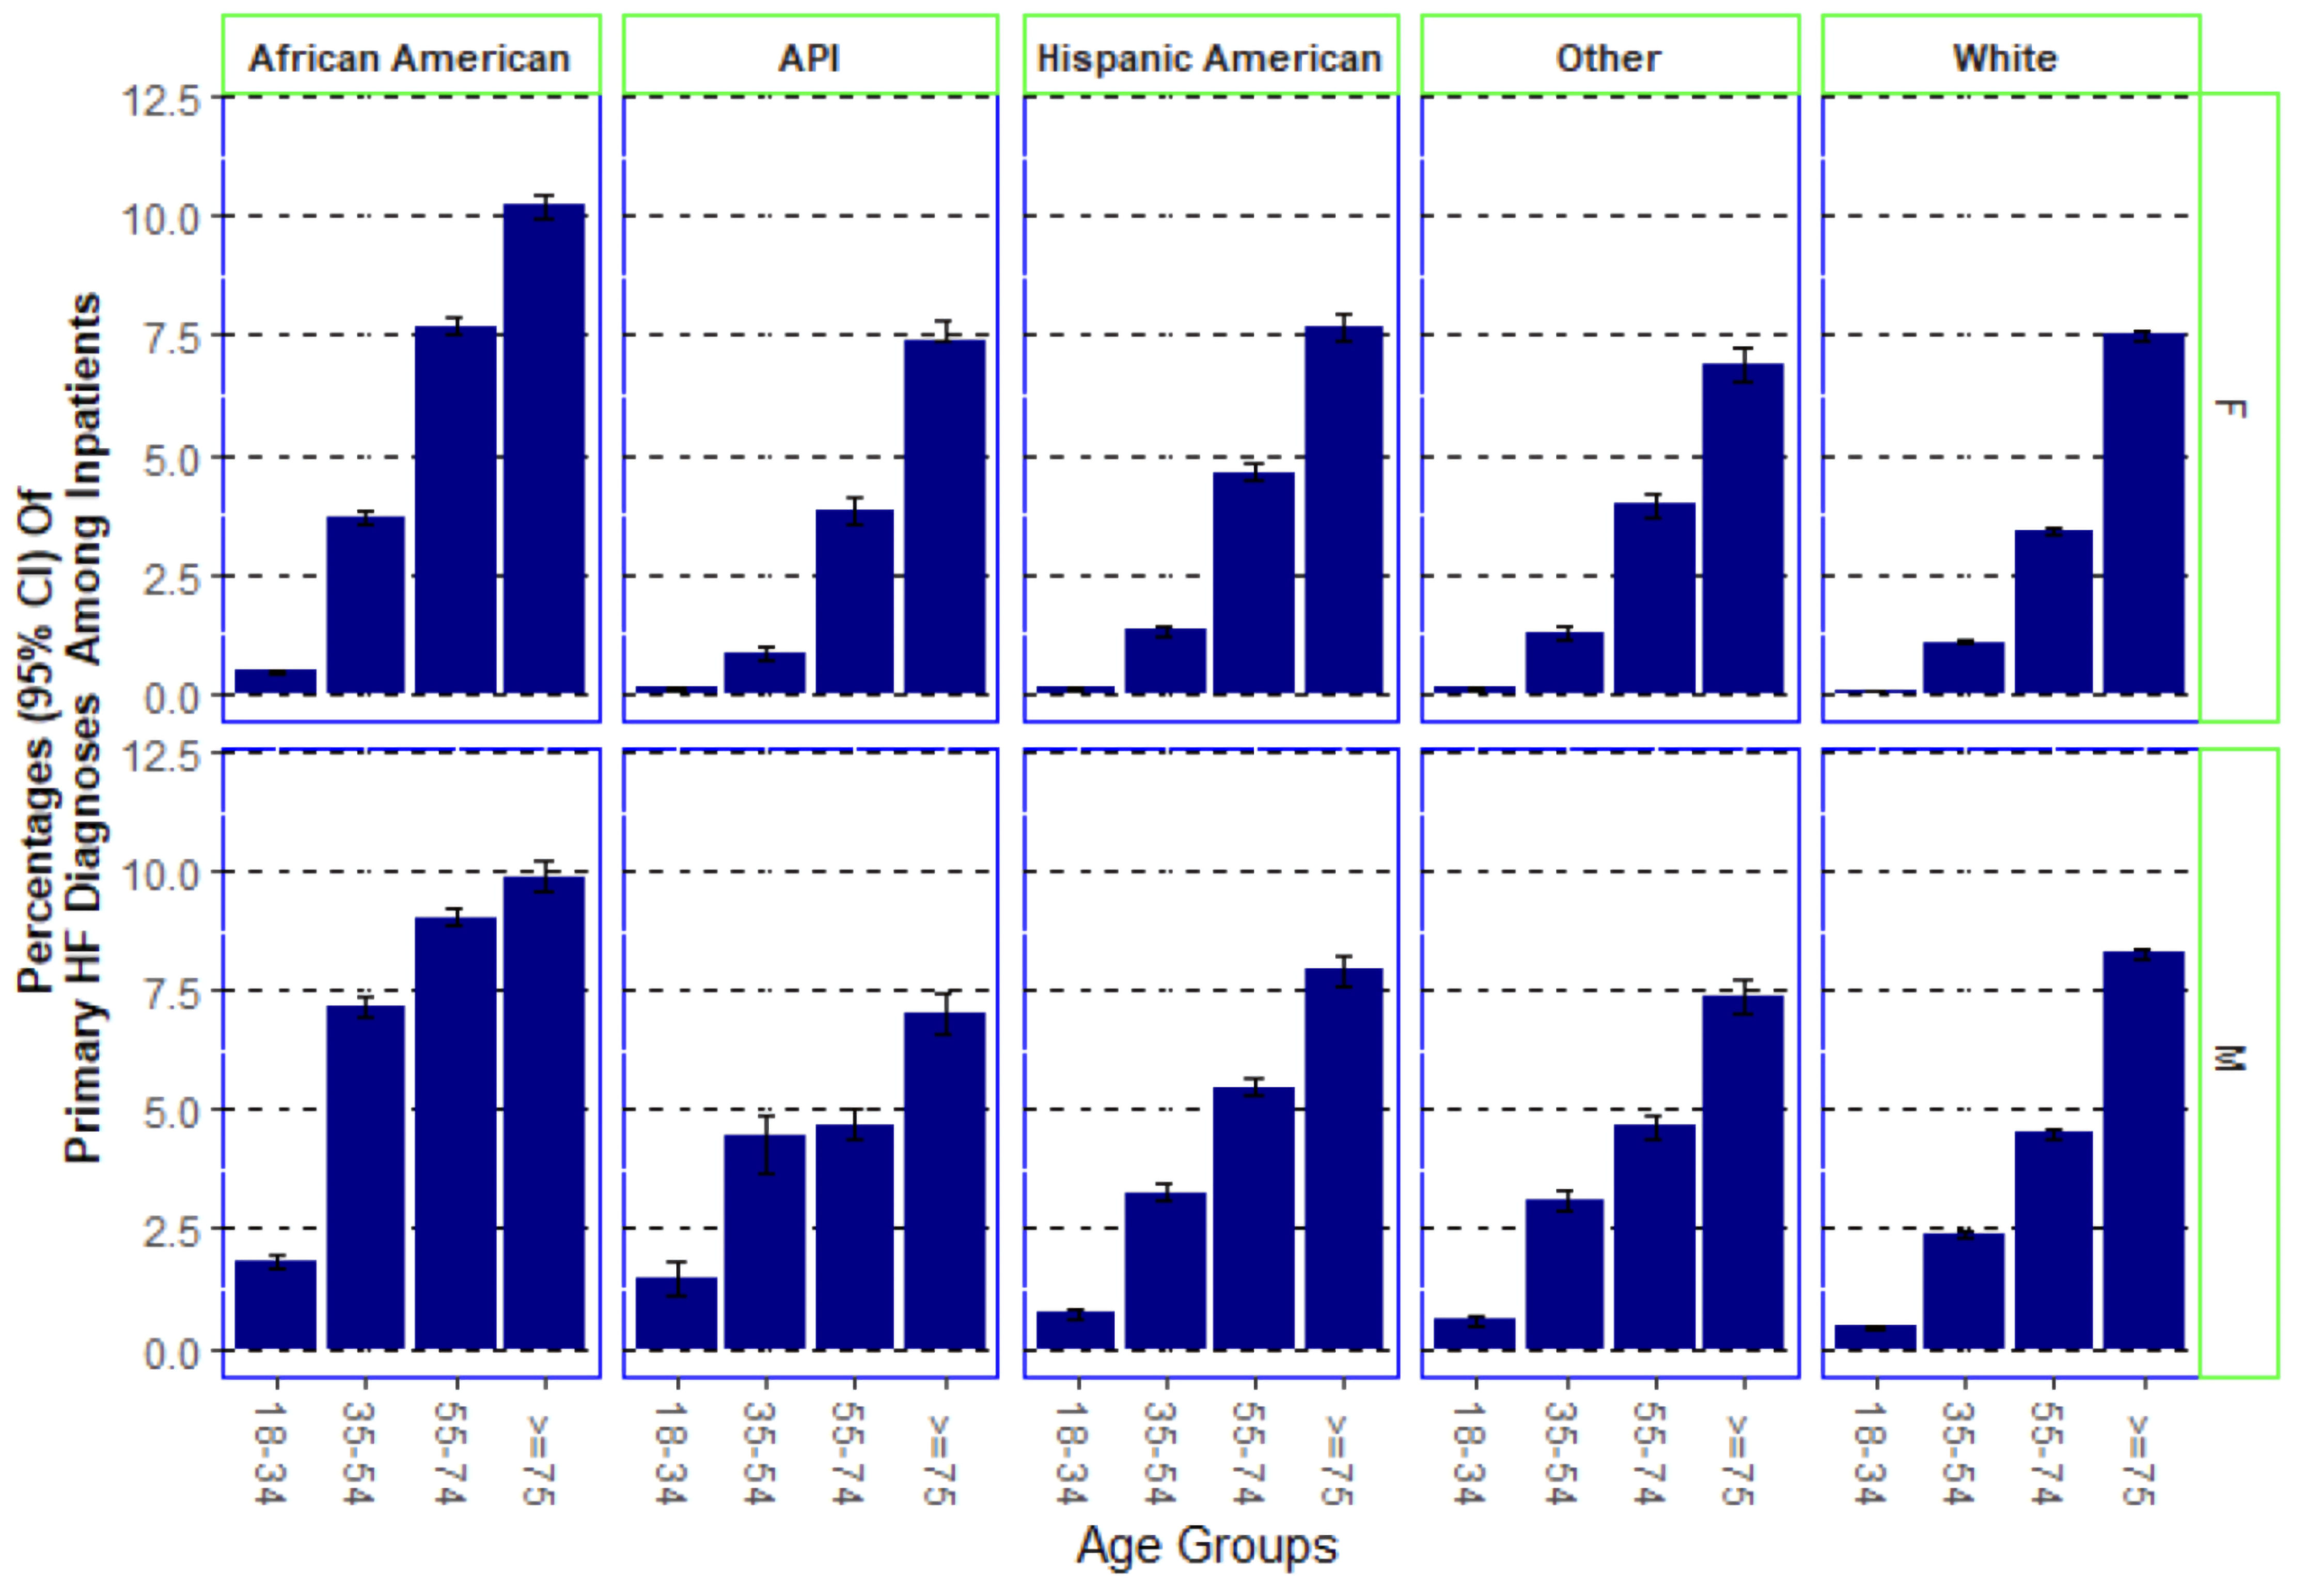
| Cardiology Research, ISSN 1923-2829 print, 1923-2837 online, Open Access |
| Article copyright, the authors; Journal compilation copyright, Cardiol Res and Elmer Press Inc |
| Journal website https://cr.elmerpub.com |
Original Article
Volume 16, Number 6, December 2025, pages 479-488
Epidemiological Trends of Heart Failure Subtypes, Characteristics, and Outcomes Within Inpatient Hospitalizations
Figure

Tables
| Demographics domain | Non-HF hospitalization | HF hospitalization | P value | ||||
|---|---|---|---|---|---|---|---|
| Sample size (105) | Weighted estimation (106) | % of inpatients | Sample size (105) | Weighted estimation (106) | % of inpatients | ||
| The weighted estimation has been represented as n (95% confidence interval). The term “sample size” refers to the number of inpatients included in the National Inpatient Sample (NIS) of the Healthcare Cost and Utilization Project (HCUP). Statistical significance was determined to be at P < 0.05, and the P value was determined from the Rao-Scott Chi-square test for the sample-weighted national estimations. HF: heart failure; AA: African American, API: Asian-American and Pacific Islander. | |||||||
| Overall | 57.85 | 28.92 (27.87 - 29.98) | 95.70 | 2.59 | 1.30 (1.25 - 1.34) | 4.30 | < 0.0001 |
| Race/ethnicity | |||||||
| White | 38.05 | 19.02 (18.28 - 19.76) | 95.83 | 1.66 | 0.83 (0.80 - 0.86) | 4.17 | < 0.0001 |
| AA | 8.49 | 4.24 (3.99 - 4.50) | 93.91 | 0.55 | 0.28 (0.26 - 0.29) | 6.09 | |
| Hispanic | 6.32 | 3.16 (2.94 - 3.38) | 96.79 | 0.21 | 0.10 (0.10 - 0.11) | 3.21 | |
| API | 1.60 | 0.80 (0.73 - 0.87) | 96.57 | 0.06 | 0.03 (0.02 - 0.03) | 3.43 | |
| Other racial/ethnic background | 3.40 | 1.70 (1.56 - 1.84) | 96.65 | 0.12 | 0.06 (0.05 - 0.06) | 3.35 | |
| Sex | |||||||
| Male | 24.60 | 12.30 (11.83 - 12.76) | 94.76 | 1.36 | 0.68 (0.65 - 0.71) | 5.24 | <0.0001 |
| Female | 33.24 | 16.62 (16.02 - 17.22) | 96.43 | 1.23 | 0.62 (0.59 - 0.64) | 3.57 | |
| Age group | |||||||
| 18 - 34 | 10.98 | 5.49 (5.27 - 5.72) | 99.69 | 0.03 | 0.02 (0.02 - 0.02) | 0.31 | < 0.0001 |
| 35 - 54 | 11.88 | 5.94 (5.70 - 6.18) | 97.52 | 0.30 | 0.15 (0.14 - 0.16) | 2.48 | |
| 55 - 74 | 21.03 | 10.51 (10.11 - 10.91) | 95.27 | 1.04 | 0.52 (0.50 - 0.54) | 4.73 | |
| ≥ 75 | 13.96 | 6.98 (6.73 - 7.23) | 92.01 | 1.21 | 0.61 (0.58 - 0.63) | 7.99 | |
| Variables | Relative risk (RR) | 95% CI of RR | P value |
|---|---|---|---|
| The data were represented as relative risk with 95% CI. Statistical significance was determined to be at P < 0.05, and P value was tested by a Poison regression. HF: heart failure; CI: confidence interval; RR: rate ratio. | |||
| Race/ethnicity | |||
| White (reference) | 1.00 | ||
| African American | 2.49 | 2.06 - 2.98 | < 0.0001 |
| Hispanic American | 0.88 | 0.66 - 1.15 | 0.38 |
| Asian American and Pacific Islander | 0.50 | 0.29 - 0.80 | 0.01 |
| Other racial/ethnic background | 3.48 | 2.39 - 4.87 | < 0.0001 |
| Sex | |||
| Female (reference) | 1.00 | ||
| Male | 1.38 | 1.19 - 1.59 | 0.0002 |
| Age group | |||
| ≥ 75 (reference) | 1.00 | ||
| 55 - 74 | 0.25 | 0.21 - 0.29 | < 0.0001 |
| 35 - 54 | 0.06 | 0.05 - 0.08 | < 0.0001 |
| 18 - 34 | 0.01 | 0.00 - 0.01 | < 0.0001 |
| HF definitions | Sample size | Weighted estimation (103) | Hospital outcomes | |||
|---|---|---|---|---|---|---|
| Presentative size (95% CI) | Percent (%) | Length of stay (days) | Total charge ($103) | In-hospital mortality (%) | ||
| The weighted estimates are presented as n with a 95% CI. The term “sample size” refers to the number of inpatients included in the National Inpatient Sample (NIS) of the Healthcare Cost and Utilization Project (HCUP). HF: heart failure; CI: confidence interval. | ||||||
| Types of HF defined by affected organ location and function | ||||||
| Systolic HF | 77,931 | 389.66 (374.70 - 404.61) | 30.09 | 5.16 (5.09 - 5.24) | 59.25 (57.06 - 61.44) | 2.27 (2.20 - 2.40) |
| Diastolic HF | 92,300 | 461.50 (444.97 - 478.03) | 35.63 | 5.17 (5.13 - 5.21) | 47.84 (46.72 - 48.96) | 1.89 (1.80 - 2.00) |
| Combined systolic-diastolic HF | 48,529 | 242.65 (231.53 - 253.76) | 18.74 | 5.95 (5.85 - 6.05) | 63.79 (60.32 - 67.25) | 2.68 (2.50 - 2.80) |
| Right HF | 3,063 | 15.32 (14.40 - 16.23) | 1.18 | 6.49 (6.24 - 6.73) | 63.65 (58.70 - 68.61) | 3.56 (2.90 - 4.60) |
| Biventricular HF | 2,579 | 12.90 (11.82 - 13.97) | 1.00 | 7.63 (7.29 - 7.96) | 85.55 (75.34 - 95.75) | 4.46 (3.60 - 5.30) |
| End-stage HF | 4,030 | 20.15 (18.03 - 22.27) | 1.56 | 10.77 (10.14 - 11.40) | 174.29 (154.76 - 193.81) | 10.33 (9.30 - 11.40) |
| Other | 30,593 | 152.97 (147.03 - 158.90) | 11.81 | 5.34 (5.23 - 5.44) | 60.49 (58.44 - 62.54) | 3.30 (3.10 - 3.50) |
| HF defined and specified by phenotypes of acuity | ||||||
| Acute | 27,948 | 139.74 (134.74 - 144.74) | 10.79 | 4.62 (4.56 - 4.67) | 51.73 (50.33 - 53.12) | 1.53 (1.38 - 1.68) |
| Acute on chronic | 188,106 | 940.53 (905.79 - 975.27) | 72.68 | 5.57 (5.51 - 5.64) | 57.85 (55.83 - 59.87) | 2.41 (2.33 - 2.49) |
| Chronic | 4,778 | 23.89 (22.66 - 25.12) | 1.84 | 4.96 (4.72 - 5.19) | 61.64 (57.45 - 65.83) | 2.83 (2.17 - 3.48) |
| Undefined or unspecified | 38,193 | 190.97 (183.64 - 198.29) | 14.69 | 5.58 (5.47 - 5.70) | 64.83 (62.05 - 67.60) | 3.57 (3.34 - 3.79) |
| Total | 259,025 | 1,295.13 (1,249.1 - 1,341) | 100 | 5.46 (5.40 - 5.52) | 58.28 (56.35 - 60.22) | 2.49 (2.42 - 2.57) |
| Sociodemographic characteristics | Systolic HF | Combined systolic-diastolic HF | Right HF | Biventricular HF | End-stage HF | Other undefined types | ||||||
|---|---|---|---|---|---|---|---|---|---|---|---|---|
| OR (95% CI) | P value | OR (95% CI) | P value | OR (95% CI) | P value | OR (95% CI) | P value | OR (95% CI) | P value | OR (95% CI) | P value | |
| The data were represented as OR (95% CI). Statistical significance was determined to be at P <0.05, which was obtained via survey-based logistic regressions. ICD-10: International Classification of Diseases, 10th Revision; AA: African American; API: Asian-American and Pacific Islander; HF: heart failure; OR: odds ratio; CI: confidence interval. | ||||||||||||
| Race/ethnicity | ||||||||||||
| White as the control group | ||||||||||||
| AA | 1.53 (1.48 - 1.59) | < 0.0001 | 1.59 (1.52 - 1.66) | < 0.0001 | 0.95 (0.84 - 1.07) | 0.41 | 1.50 (1.31 - 1.72) | < 0.0001 | 1.71 (1.46 - 2.00) | < 0.0001 | 1.99 (1.89 - 2.09) | < 0.0001 |
| Hispanic | 1.29 (1.23 - 1.35) | < 0.0001 | 1.20 (1.12 - 1.28) | < 0.0001 | 0.86 (0.73 - 1.02) | 0.01 | 0.91 (0.75 - 1.10) | 0.40 | 1.30 (1.07 - 1.57) | 0.007 | 2.45 (2.29 - 2.62) | < 0.0001 |
| API | 1.21 (1.12 - 1.31) | < 0.0001 | 1.20 (1.06 - 1.35) | 0.0047 | 1.10 (0.85 - 1.44) | 0.46 | 0.94 (0.68 - 1.29) | 0.70 | 1.12 (0.84 - 1.45) | 0.40 | 2.34 (2.12 - 2.57) | < 0.0001 |
| Other racial/ethnic background | 1.28 (1.19 - 1.38) | < 0.0001 | 1.14 (1.06 - 1.24) | 0.0007 | 1.12 (0.92 - 1.36) | 0.28 | 1.03 (0.82 - 1.30) | 0.81 | 1.26 (1.03 - 1.54) | 0.02 | 1.76 (1.60 - 1.93) | < 0.0001 |
| Sex | ||||||||||||
| Male as the control group | ||||||||||||
| Female | 0.39 (0.38 - 0.40) | < 0.0001 | 0.48 (0.47 - 0.49) | < 0.0001 | 0.81 (0.75 - 0.87) | < 0.0001 | 0.47 (0.44 - 0.51) | < 0.0001 | 0.36 (0.33 - 0.38) | < 0.0001 | 0.66 (0.65 - 0.68) | < 0.0001 |
| Age group | ||||||||||||
| ≥ 75 as the control group | ||||||||||||
| 18 - 34 | 4.43 (3.93 - 5.00) | < 0.0001 | 3.07 (2.69 - 3.50) | < 0.0001 | 8.40 (6.47 - 10.90) | < 0.0001 | 5.68 (4.14 - 7.79) | < 0.0001 | 7.56 (5.74 - 9.95) | < 0.0001 | 5.76 (5.03 - 6.59) | < 0.0001 |
| 35 - 54 | 2.48 (2.38 - 2.58) | < 0.0001 | 1.98 (1.88 - 2.07) | < 0.0001 | 3.23 (2.84 - 3.67) | < 0.0001 | 3.14 (2.78 - 3.55) | < 0.0001 | 2.68 (2.35 - 3.07) | < 0.0001 | 2.80 (2.66 - 2.94) | < 0.0001 |
| 55 - 74 | 1.50 (1.46 - 1.53) | < 0.0001 | 1.35 (1.31 - 1.39) | < 0.0001 | 1.72 (1.58 - 1.87) | < 0.0001 | 1.76 (1.60 - 1.93) | < 0.0001 | 1.60 (1.45 - 1.77) | < 0.0001 | 1.82 (1.76 - 1.88) | < 0.0001 |
| Sociodemographic characteristics | Acute vs. chronic | Acute on chronic vs. chronic | Unspecified acute or chronic vs. chronic | |||
|---|---|---|---|---|---|---|
| Adjusted OR (95% CI) | P value | Adjusted OR (95% CI) | P value | Adjusted OR (95% CI) | P value | |
| The data were represented as OR (95% CI). Statistical significance was determined to be at P <0.05, which was obtained via survey-based logistic regressions. AA: African American; API: Asian-American and Pacific Islander; HF: heart failure; OR: odds ratio; CI: confidence interval. | ||||||
| Race/ethnicity | ||||||
| White as the control group | ||||||
| African American | 0.67 (0.61 - 0.74) | < 0.0001 | 0.99 (0.91 - 1.08) | 0.86 | 1.36 (1.23 - 1.49) | < 0.0001 |
| Hispanic | 0.76 (0.67 - 0.86) | < 0.0001 | 0.85 (0.76 - 0.95) | 0.005 | 1.73 (1.50 - 2.00) | < 0.0001 |
| API | 1.08 (0.85 - 1.37) | 0.53 | 0.91 (0.72 - 1.14) | 0.42 | 2.02 (1.52 - 2.69) | < 0.0001 |
| Other racial/ethnic background | 0.79 (0.67 - 0.93) | 0.004 | 0.81 (0.71 - 0.92) | 0.0017 | 1.22 (1.04 - 1.44) | 0.02 |
| Sex | ||||||
| Male as the control group | ||||||
| Female | 1.21 (1.14 - 1.29) | < 0.0001 | 1.07 (1.01 - 1.13) | 0.03 | 1.16 (1.07 - 1.25) | 0.0003 |
| Age group | ||||||
| ≥ 75 as the control group | ||||||
| 18 - 34 | 2.30 (1.74 - 3.04) | < 0.0001 | 0.82 (0.63 - 1.07) | 0.13 | 2.03 (1.51 - 2.74) | < 0.0001 |
| 35 - 54 | 1.58 (1.42 - 1.77) | < 0.0001 | 0.86 (0.77 - 0.95) | 0.004 | 1.50 (1.33 - 1.70) | < 0.0001 |
| 55 - 74 | 1.14 (1.06 - 1.22) | 0.0005 | 0.91 (0.85 - 0.97) | 0.004 | 1.30 (1.20 - 1.42) | < 0.0001 |
| Types of HF | ||||||
| Diastolic HF as the control diagnosis | ||||||
| Systolic HF | 1.10 (1.02 - 1.18) | 0.02 | 0.99 (0.92 - 1.06) | 0.74 | 0.73 (0.64 - 0.81) | < 0.0001 |
| Combined systolic-diastolic HF | 0.76 (0.69 - 0.84) | < 0.0001 | 1.49 (1.36 - 1.63) | < 0.0001 | 11.36 (10.10 - 12.77) | < 0.0001 |
| Right HF | 0.85 (0.66 - 1.10) | 0.25 | 0.75 (0.59 - 0.95) | 0.02 | 10.01 (7.71 - 13.00) | < 0.0001 |
| Biventricular HF | 0.46 (0.35 - 0.61) | < 0.0001 | 0.79 (0.62 - 1.00) | 0.05 | 6.60 (5.02 - 8.67) | < 0.0001 |
| End-stage HF | 0.07 (0.05 - 0.10) | < 0.0001 | 0.51 (0.42 - 0.62) | < 0.0001 | 5.54 (4.41 - 6.94) | < 0.0001 |