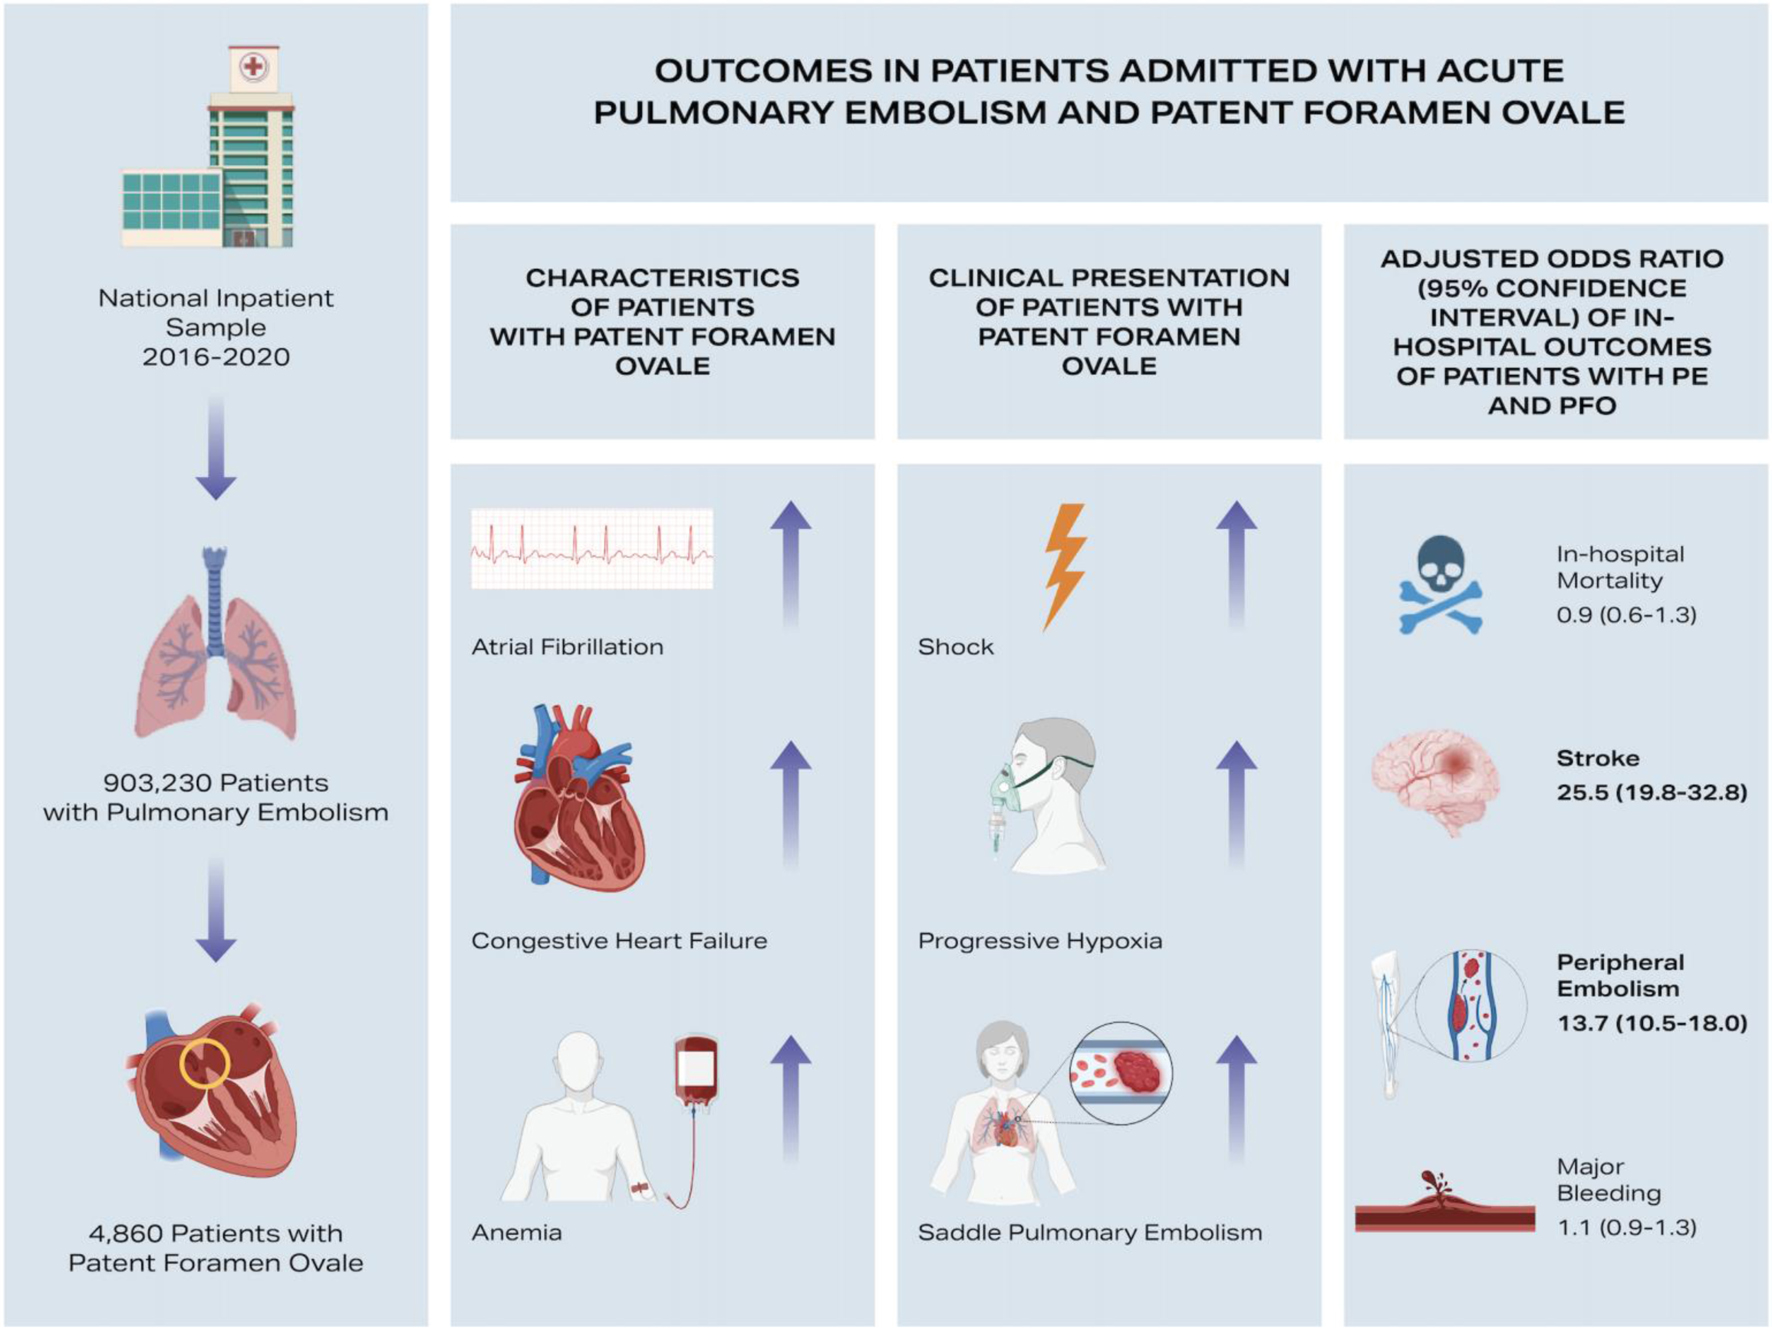
↓ Figure 1. Clinical characteristics, severity of presentation, and in-hospital outcomes of patients admitted with acute pulmonary embolism (PE) and concomitant patent foramen ovale (PFO).
| Cardiology Research, ISSN 1923-2829 print, 1923-2837 online, Open Access |
| Article copyright, the authors; Journal compilation copyright, Cardiol Res and Elmer Press Inc |
| Journal website https://cr.elmerpub.com |
Original Article
Volume 16, Number 6, December 2025, pages 499-506
Impact of Patent Foramen Ovale on In-Hospital Outcomes in Acute Pulmonary Embolism
Figure
Tables
| PE only (N = 898,370) | PE with PFO (N = 4,860) | P-value | |
|---|---|---|---|
| Values are expressed as mean ± SD for continuous variables or percentages for categorical variables. PE: pulmonary embolism; PFO: patent foramen ovale; SD: standard deviation. | |||
| Saddle PE | 81,135 (9) | 860 (17.7) | < 0.001 |
| Cor pulmonale | 74,245 (8.3) | 870 (17.9) | < 0.001 |
| Shock | 25,560 (2.9) | 470 (9.7) | < 0.001 |
| Progressive hypoxia | 52,275 (5.8) | 700 (14.4) | < 0.001 |
| Pressors | 7,385 (0.8) | 170 (3.5) | < 0.001 |
| PE with high-risk features | 64,525 (7.2) | 940 (19.3) | < 0.001 |
| PE only (N = 898,370) | PE with PFO (N = 4,860) | P-value | |
|---|---|---|---|
| Values are expressed as mean ± SD for continuous variables or percentages for categorical variables. PE: pulmonary embolism; PFO: patent foramen ovale; SD: standard deviation. | |||
| Systemic thrombolysis | 22,185 (2.5) | 180 (3.7) | 0.010 |
| Catheter directed thrombolysis | 34,380 (3.8) | 360 (7.4) | < 0.001 |
| Catheter directed embolectomy | 12,000 (1.3) | 210 (4.3) | < 0.001 |
| Surgical embolectomy | 1,445 (0.2) | 365 (7.5) | < 0.001 |
| PE only (N = 898,370) | PE with PFO (N = 4,860) | P-value | |
|---|---|---|---|
| Adjusted for demographics, and all comorbidities listed in Table 1. CI: confidence interval; MI: myocardial infarction; OR: odds ratio; PE: pulmonary embolism; PFO: patent foramen ovale. | |||
| In-hospital mortality | |||
| % | 3.1% | 5.8% | |
| Unadjusted OR (95% CI) | Ref. | 1.8 (1.5 - 2.5) | < 0.001 |
| Adjusted OR (95% CI) | Ref. | 0.9 (0.6 - 1.3) | 0.702 |
| MI | |||
| % | 3.6% | 1.8% | |
| Unadjusted OR (95% CI) | Ref. | 2 (1.4 - 2.9) | < 0.001 |
| Adjusted OR (95% CI) | Ref. | 1.6 (1.1 - 2.3) | 0.02 |
| Stroke | |||
| % | 0.5% | 13.5% | |
| Unadjusted OR (95% CI) | Ref. | 30.4 (25 - 37) | < 0.001 |
| Adjusted OR (95% CI) | Ref. | 25.5 (19.8 - 32.8) | < 0.001 |
| Peripheral embolism | |||
| % | 0.6% | 9.6% | |
| Unadjusted OR (95% CI) | Ref. | 18.7 (15 - 23.4) | < 0.001 |
| Adjusted OR (95% CI) | Ref. | 13.7 (10.5 - 18) | < 0.001 |
| Bleeding | |||
| % | 9.3% | 16.7% | |
| Unadjusted OR (95% CI) | Ref. | 1.9 (1.6 - 2.3) | < 0.001 |
| Adjusted OR (95% CI) | Ref. | 1.1 (0.9 - 1.3) | 0.409 |
| PE without PFO | PE with PFO | P-value | |
|---|---|---|---|
| aAdjusted for inflation. Values are expressed as mean ± SD and median (IQR). IQR: interquartile range; LOS: length of stay; PE: pulmonary embolism; PFO: patent foramen ovale; SD: standard deviation. | |||
| LOS (days) | 4.3 (3.4 - 4.6) | 7.4 (6.1 - 8.9) | < 0.001 |
| Total costa ($) | 12,008 ± 15,116 | 30,723 ± 57,305 | < 0.001 |
| Total chargea ($) | 49,677 ± 70,313 | 126,355 ± 238,335 | < 0.001 |