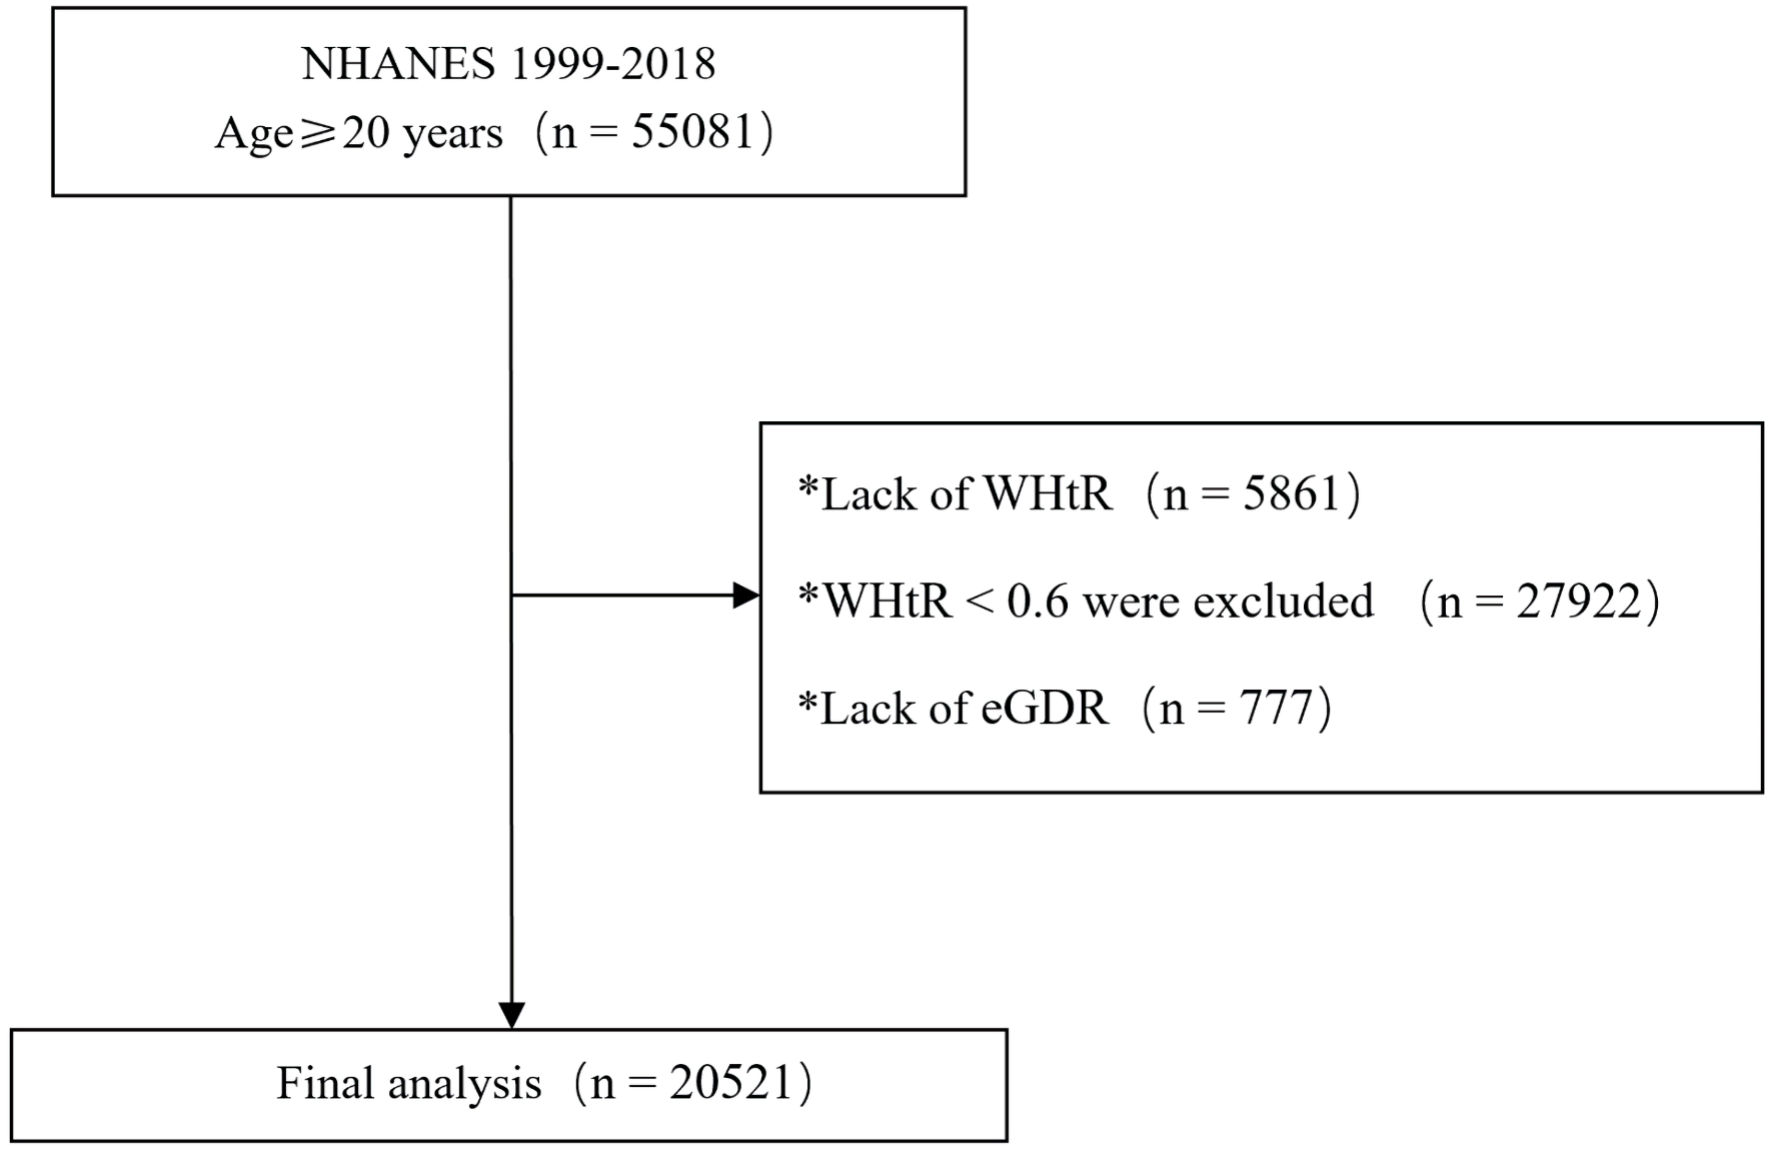
↓ Figure 1. Participant flowchart. eGDR: estimated glucose disposal rate; NHANES: National Health and Nutrition Examination Survey; WHtR: waist-to-height ratio.
| Cardiology Research, ISSN 1923-2829 print, 1923-2837 online, Open Access |
| Article copyright, the authors; Journal compilation copyright, Cardiol Res and Elmer Press Inc |
| Journal website https://cr.elmerpub.com |
Original Article
Volume 17, Number 1, February 2026, pages 43-53
Association Between Insulin Resistance Marker Estimated Glucose Disposal Rate and Cardiovascular Risk in Obesity: Insights From the National Health and Nutrition Examination Survey 1999 to 2018
Figures
Tables
| Variables | Overall (n = 20,521) | eGDR | P value | |||
|---|---|---|---|---|---|---|
| ≤ 4 (n = 4,000) | 4 - 6 (n = 6,205) | 6 - 8 (n = 3,984) | > 8 (n = 6,332) | |||
| BMI: body mass index; WC: waist circumference; HbA1c: glycated hemoglobin; TG: triglycerides; TC: total cholesterol; LDL-C: low-density lipoprotein cholesterol; HDL-C: high-density lipoprotein cholesterol; CRP: C-reactive protein; Cr: creatinine; eGDR: estimated glucose disposal rate; WHtR: waist-to-height ratio; CVD: cardiovascular disease; NHANES: National Health and Nutrition Examination Survey. | ||||||
| Age (year) | 54 (39, 67) | 60 (49, 68) | 62 (49, 72) | 49 (34, 64) | 44 (32, 60) | < 0.001 |
| Female, n (%) | 11,979 (58.4%) | 1,936 (48.4%) | 3,662 (59.0%) | 2,095 (52.6%) | 4,286 (67.7%) | < 0.001 |
| Race, n (%) | < 0.001 | |||||
| Mexican American | 4,352 (21.2%) | 576 (14.4%) | 1,060 (17.1%) | 847 (21.3%) | 1,869 (29.5%) | |
| Non-Hispanic Black | 4,265 (20.8%) | 1,217 (30.4%) | 1,380 (22.2%) | 762 (19.1%) | 906 (14.3%) | |
| Non-Hispanic White | 8,846 (43.1%) | 1,758 (44.0%) | 2,889 (46.6%) | 1,807 (45.4%) | 2,392 (37.8%) | |
| Hispanic | 1,874 (9.1%) | 284 (7.1%) | 534 (8.6%) | 343 (8.6%) | 713 (11.3%) | |
| Other | 1,184 (5.8%) | 165 (4.1%) | 342 (5.5%) | 225 (5.6%) | 452 (7.1%) | |
| BMI (kg/m2) | 33.0 (30.0, 37.0) | 38.1 (34.2, 42.8) | 31.8 (29.4, 35.1) | 35.1 (31.7, 38.7) | 31.1 (29.0, 33.4) | < 0.001 |
| WC (cm) | 110 (103, 119) | 124 (118, 132) | 108 (103, 113) | 117 (112, 122) | 104 (100, 108) | < 0.001 |
| HbA1c (%) | 5.70 (5.30, 6.10) | 6.40 (5.80, 7.70) | 5.70 (5.40, 6.10) | 5.60 (5.40, 6.00) | 5.40 (5.20, 5.70) | < 0.001 |
| Fasting glucose (mg/dL) | 104 (96, 119) | 122 (105, 165) | 106 (98, 119) | 104 (96, 115) | 98 (91, 105) | < 0.001 |
| TG (mmol/L) | 1.63 (1.12, 2.41) | 1.74 (1.21, 2.59) | 1.64 (1.13, 2.39) | 1.65 (1.14, 2.45) | 1.55 (1.06, 2.29) | < 0.001 |
| TC (mg/dL) | 195 (169, 224) | 185 (158, 216) | 195 (169, 224) | 196 (170, 223) | 201 (175, 230) | < 0.001 |
| LDL-C (mmol/L) | 2.97 (2.38, 3.60) | 2.74 (2.15, 3.39) | 2.95 (2.33, 3.57) | 3.05 (2.46, 3.65) | 3.10 (2.56, 3.70) | < 0.001 |
| HDL-C (mmol/L) | 1.22 (1.01, 1.47) | 1.14 (0.96, 1.37) | 1.24 (1.03, 1.50) | 1.16 (0.98, 1.40) | 1.27 (1.06, 1.53) | < 0.001 |
| CRP (mmol/L) | 0.60 (0.25, 1.81) | 0.93 (0.36, 2.96) | 0.56 (0.23, 1.66) | 0.64 (0.27, 2.07) | 0.50 (0.21, 1.35) | < 0.001 |
| Serum Cr (mmol/L) | 72 (62, 88) | 80 (66, 97) | 77 (63, 91) | 72 (62, 88) | 67 (55, 80) | < 0.001 |
| eGDR | 6.03 (4.40, 8.31) | 3.03 (2.16, 3.58) | 4.95 (4.54, 5.40) | 7.27 (6.65, 7.68) | 8.77 (8.40, 9.19) | < 0.001 |
| WHtR | 0.66 (0.63, 0.71) | 0.74 (0.69, 0.79) | 0.65 (0.63, 0.69) | 0.69 (0.65, 0.73) | 0.63 (0.61, 0.66) | < 0.001 |
| Hypertension, n (%) | 9,782 (47.7%) | 3,886 (97.2%) | 5,453 (87.9%) | 443 (11.1%) | 0 (0.0%) | < 0.001 |
| CVD, n (%) | 2,994 (14.6%) | 1,048 (26.2%) | 1,256 (20.2%) | 352 (8.8%) | 338 (5.3%) | < 0.001 |
| Heart failure, n (%) | 942 (4.6%) | 407 (10.2%) | 366 (5.9%) | 89 (2.2%) | 80 (1.3%) | < 0.001 |
| Coronary artery disease, n (%) | 1,125 (5.5%) | 412 (10.4%) | 480 (7.8%) | 130 (3.3%) | 103 (1.6%) | < 0.001 |
| Angina (%) | 839 (4.1%) | 308 (7.8%) | 346 (5.6%) | 89 (2.2%) | 96 (1.5%) | < 0.001 |
| Myocardial infarction, n (%) | 1,177 (5.7%) | 439 (11.0%) | 457 (7.4%) | 147 (3.7%) | 134 (2.1%) | < 0.001 |
| Stroke, n (%) | 962 (4.7%) | 310 (7.8%) | 452 (7.3%) | 98 (2.5%) | 102 (1.6%) | < 0.001 |
| Diabetes status, n (%) | < 0.001 | |||||
| Normal | 7,609 (37.1%) | 485 (12.1%) | 1,875 (30.2%) | 1,569 (39.4%) | 3,680 (58.1%) | |
| Prediabetes | 7,640 (37.2%) | 1,132 (28.3%) | 2,619 (42.2%) | 1,607 (40.3%) | 2,282 (36.0%) | |
| Diabetes | 5,272 (25.7%) | 2,383 (59.6%) | 1,711 (27.6%) | 808 (20.3%) | 370 (5.8%) | |
| Smoking status, n (%) | < 0.001 | |||||
| Current | 3,533 (17.2%) | 675 (16.9%) | 1,002 (16.2%) | 751 (18.9%) | 1,105 (17.5%) | |
| Former | 5,883 (28.7%) | 1,423 (35.6%) | 2,024 (32.6%) | 1,062 (26.7%) | 1,374 (21.7%) | |
| Never | 11,088 (54.1%) | 1,901 (47.5%) | 3,174 (51.2%) | 2,166 (54.4%) | 3,847 (60.8%) | |
| Alcohol consumption, n (%) | < 0.001 | |||||
| Heavy | 759 (3.8%) | 132 (3.5%) | 196 (3.3%) | 182 (4.7%) | 249 (4.0%) | |
| Moderate | 5,130 (25.8%) | 1,074 (28.2%) | 1,482 (24.8%) | 1,165 (30.0%) | 1,409 (22.7%) | |
| Mild | 10,869 (54.7%) | 2,043 (53.6%) | 3,328 (55.6%) | 1,972 (50.9%) | 3,526 (56.9%) | |
| Never | 3,121 (15.7%) | 566 (14.8%) | 981 (16.4%) | 559 (14.4%) | 1,015 (16.4%) | |
| NHANES cycle, n (%) | < 0.001 | |||||
| 1999 - 2000 | 1,603 (7.8%) | 235 (5.9%) | 485 (7.8%) | 295 (7.4%) | 588 (9.3%) | |
| 2001 - 2002 | 1,717 (8.4%) | 253 (6.3%) | 490 (7.9%) | 338 (8.5%) | 636 (10.0%) | |
| 2003 - 2004 | 1,748 (8.5%) | 284 (7.1%) | 569 (9.2%) | 327 (8.2%) | 568 (9.0%) | |
| 2005 - 2006 | 1,780 (8.7%) | 307 (7.7%) | 496 (8.0%) | 337 (8.5%) | 640 (10.1%) | |
| 2007 - 2008 | 2,266 (11.0%) | 455 (11.4%) | 701 (11.3%) | 427 (10.7%) | 683 (10.8%) | |
| 2009 - 2010 | 2,414 (11.8%) | 505 (12.6%) | 745 (12.0%) | 493 (12.4%) | 671 (10.6%) | |
| 2011 - 2012 | 1,974 (9.6%) | 429 (10.7%) | 603 (9.7%) | 395 (9.9%) | 547 (8.6%) | |
| 2013 - 2014 | 2,250 (11.0%) | 479 (12.0%) | 681 (11.0%) | 424 (10.6%) | 666 (10.5%) | |
| 2015 - 2016 | 2,388 (11.6%) | 508 (12.7%) | 720 (11.6%) | 469 (11.8%) | 691 (10.9%) | |
| 2017 - 2018 | 2,381 (11.6%) | 545 (13.6%) | 715 (11.5%) | 479 (12.0%) | 642 (10.1%) | |
| Variables | Univariable | Multivariable | ||||
|---|---|---|---|---|---|---|
| OR | 95% CI | P value | OR | 95% CI | P value | |
| CVD: cardiovascular disease; TG: triglycerides; TC: total cholesterol; LDL-C: low-density lipoprotein cholesterol; HDL-C: high-density lipoprotein cholesterol; CRP: C-reactive protein; Cr: creatinine; eGDR: estimated glucose disposal rate; WHtR: waist-to-height ratio; CVD: cardiovascular disease; NHANES: National Health and Nutrition Examination Survey. | ||||||
| eGDR | ||||||
| Q1 (> 8) | - | - | - | - | ||
| Q2 (6 - 8) | 1.72 | 1.47, 2.01 | < 0.001 | 1.35 | 1.02, 1.78 | 0.035 |
| Q3 (4 - 6) | 4.50 | 3.97, 5.10 | < 0.001 | 2.11 | 1.67, 2.66 | < 0.001 |
| Q4 (≤ 4) | 6.30 | 5.53, 7.17 | < 0.001 | 2.48 | 1.90, 3.22 | < 0.001 |
| Male | 1.66 | 1.54, 1.80 | < 0.001 | 1.10 | 0.89, 1.35 | 0.379 |
| Age | 1.06 | 1.06, 1.07 | < 0.001 | 1.05 | 1.05, 1.06 | < 0.001 |
| Race | ||||||
| Other | - | - | - | - | ||
| Mexican American | 0.76 | 0.62, 0.94 | 0.011 | 0.64 | 0.42, 0.98 | 0.039 |
| Non-Hispanic Black | 1.30 | 1.07, 1.59 | 0.010 | 1.01 | 0.67, 1.53 | 0.968 |
| Non-Hispanic White | 1.80 | 1.50, 2.18 | < 0.001 | 1.02 | 0.69, 1.50 | 0.936 |
| Hispanic | 0.99 | 0.79, 1.25 | 0.960 | 0.94 | 0.60, 1.48 | 0.797 |
| Serum Cr | 1.01 | 1.01, 1.02 | < 0.001 | 1.01 | 1.01, 1.01 | < 0.001 |
| TG | 1.01 | 0.99, 1.03 | 0.280 | 0.91 | 0.56, 1.48 | 0.704 |
| Fasting glucose | 1.01 | 1.01, 1.01 | < 0.001 | 1.00 | 1.00, 1.00 | 0.709 |
| TC | 0.99 | 0.99, 0.99 | < 0.001 | 1.01 | 0.98, 1.03 | 0.711 |
| LDL-C | 0.61 | 0.57, 0.66 | < 0.001 | 0.63 | 0.22, 1.78 | 0.381 |
| HDL-C | 0.70 | 0.63, 0.79 | < 0.001 | 0.58 | 0.20, 1.66 | 0.307 |
| CRP | 1.01 | 1.00, 1.02 | 0.003 | 1.01 | 1.00, 1.02 | 0.229 |
| Diabetes status | ||||||
| Normal | - | - | - | - | ||
| Prediabetes | 1.86 | 1.67, 2.07 | < 0.001 | 1.09 | 0.87, 1.37 | 0.449 |
| Diabetes | 4.41 | 3.97, 4.89 | < 0.001 | 1.57 | 1.19, 2.06 | 0.001 |
| Smoking status, n (%) | ||||||
| Current | - | - | - | - | ||
| Former | 2.33 | 2.13, 2.54 | < 0.001 | 1.40 | 1.17, 1.67 | < 0.001 |
| Never | 1.46 | 1.31, 1.63 | < 0.001 | 2.36 | 1.89, 2.94 | < 0.001 |
| Alcohol consumption, n (%) | ||||||
| Never | - | - | - | - | ||
| Mild | 1.09 | 0.98, 1.23 | 0.124 | 1.13 | 0.90, 1.42 | 0.302 |
| Moderate | 1.06 | 0.93, 1.20 | 0.391 | 0.99 | 0.74, 1.32 | 0.935 |
| Heavy | 0.66 | 0.51, 0.86 | 0.002 | 0.82 | 0.51, 1.32 | 0.409 |
| Variables | Model 1 | Model 2 | Model 3 | ||||||
|---|---|---|---|---|---|---|---|---|---|
| OR | 95% CI | P value | OR | 95% CI | P value | OR | 95% CI | P value | |
| CVD: cardiovascular disease; TG: triglycerides; TC: total cholesterol; LDL-C: low-density lipoprotein cholesterol; HDL-C: high-density lipoprotein cholesterol; CRP: C-reactive protein; Cr: creatinine; Q: quartile; eGDR: estimated glucose disposal rate; OR: odds ratio; CI: confidence interval. | |||||||||
| eGDR | |||||||||
| Q1 (> 8) | - | - | - | - | - | - | |||
| Q2 (6 - 8) | 1.41 | 1.20, 1.66 | < 0.001 | 1.40 | 1.19, 1.65 | < 0.001 | 1.62 | 1.25, 2.10 | < 0.001 |
| Q3 (4 - 6) | 3.37 | 2.95, 3.84 | < 0.001 | 2.59 | 2.27, 2.95 | < 0.001 | 3.39 | 2.73, 4.22 | < 0.001 |
| Q4 (≤ 4) | 3.58 | 3.10, 4.14 | < 0.001 | 4.10 | 3.57, 4.70 | < 0.001 | 3.89 | 3.06, 4.94 | < 0.001 |
| Male | 1.39 | 1.28, 1.52 | < 0.001 | ||||||
| Age | 1.06 | 1.06, 1.06 | < 0.001 | ||||||
| Race | |||||||||
| Other | - | - | |||||||
| Mexican American | 0.75 | 0.60, 0.94 | 0.012 | ||||||
| Non-Hispanic Black | 1.00 | 0.81, 1.24 | 0.994 | ||||||
| Non-Hispanic White | 1.12 | 0.91, 1.36 | 0.291 | ||||||
| Hispanic | 0.86 | 0.67, 1.10 | 0.219 | ||||||
| Serum Cr | 1.01 | 1.01, 1.02 | < 0.001 | ||||||
| Fasting glucose | 1.00 | 1.00, 1.00 | 0.917 | ||||||
| TG | 0.95 | 0.62, 1.45 | 0.806 | ||||||
| TC | 1.00 | 0.98, 1.03 | 0.694 | ||||||
| LDL-C | 0.60 | 0.24, 1.49 | 0.269 | ||||||
| HDL-C | 0.83 | 0.33, 2.10 | 0.692 | ||||||
| CRP | 1.00 | 0.99, 1.01 | 0.463 | ||||||
| Diabetes status | |||||||||
| Normal | - | - | |||||||
| Prediabetes | 1.46 | 1.31, 1.64 | < 0.001 | ||||||
| Diabetes | 2.55 | 2.27, 2.87 | < 0.001 | ||||||
| Smoking status, n (%) | |||||||||
| Current | - | - | |||||||
| Former | 2.06 | 1.87, 2.27 | < 0.001 | ||||||
| Never | 1.54 | 1.37, 1.74 | < 0.001 | ||||||
| Alcohol consumption, n (%) | |||||||||
| Never | - | - | |||||||
| Mild | 0.90 | 0.80, 1.02 | 0.113 | ||||||
| Moderate | 0.82 | 0.71, 0.94 | 0.005 | ||||||
| Heavy | 0.58 | 0.44, 0.76 | < 0.001 | ||||||
| Variables | Age | Sex | Diabetes status | ||||
|---|---|---|---|---|---|---|---|
| ≤ 60 | > 60 | Male | Female | Normal | Prediabetes | Diabetes | |
| Q: quartile; eGDR: estimated glucose disposal rate. | |||||||
| eGDR Q1 | - | - | - | - | - | - | - |
| eGDR Q2 | 1.79 (1.35 - 2.36) | 1.40 (1.15 - 1.71) | 1.16 (0.93 - 1.46) | 2.19 (1.77 - 2.72) | 1.34 (1.02 - 1.77) | 1.49 (1.16 - 1.92) | 1.04 (0.74 - 1.45) |
| P < 0.001 | P < 0.001 | P = 0.182 | P < 0.001 | P = 0.036 | P = 0.002 | P = 0.833 | |
| eGDR Q3 | 5.73 (4.56 - 7.20) | 2.17 (1.86 - 2.55) | 3.60 (2.99 - 4.33) | 5.09 (4.28 - 6.05) | 4.40 (3.57 - 5.41) | 3.92 (3.21 - 4.80) | 1.91 (1.42 - 2.56) |
| P < 0.001 | P < 0.001 | P < 0.001 | P < 0.001 | P < 0.001 | P < 0.001 | P < 0.001 | |
| eGDR Q4 | 8.84 (7.03 - 11.12) | 3.23 (2.73 - 3.81) | 5.04 (4.19 - 6.07) | 6.53 (5.42 - 7.86) | 3.26 (2.37 - 4.50) | 4.51 (3.60 - 5.66) | 2.35 (1.76 - 3.15) |
| P < 0.001 | P < 0.001 | P < 0.001 | P < 0.001 | P < 0.001 | P < 0.001 | P < 0.001 | |