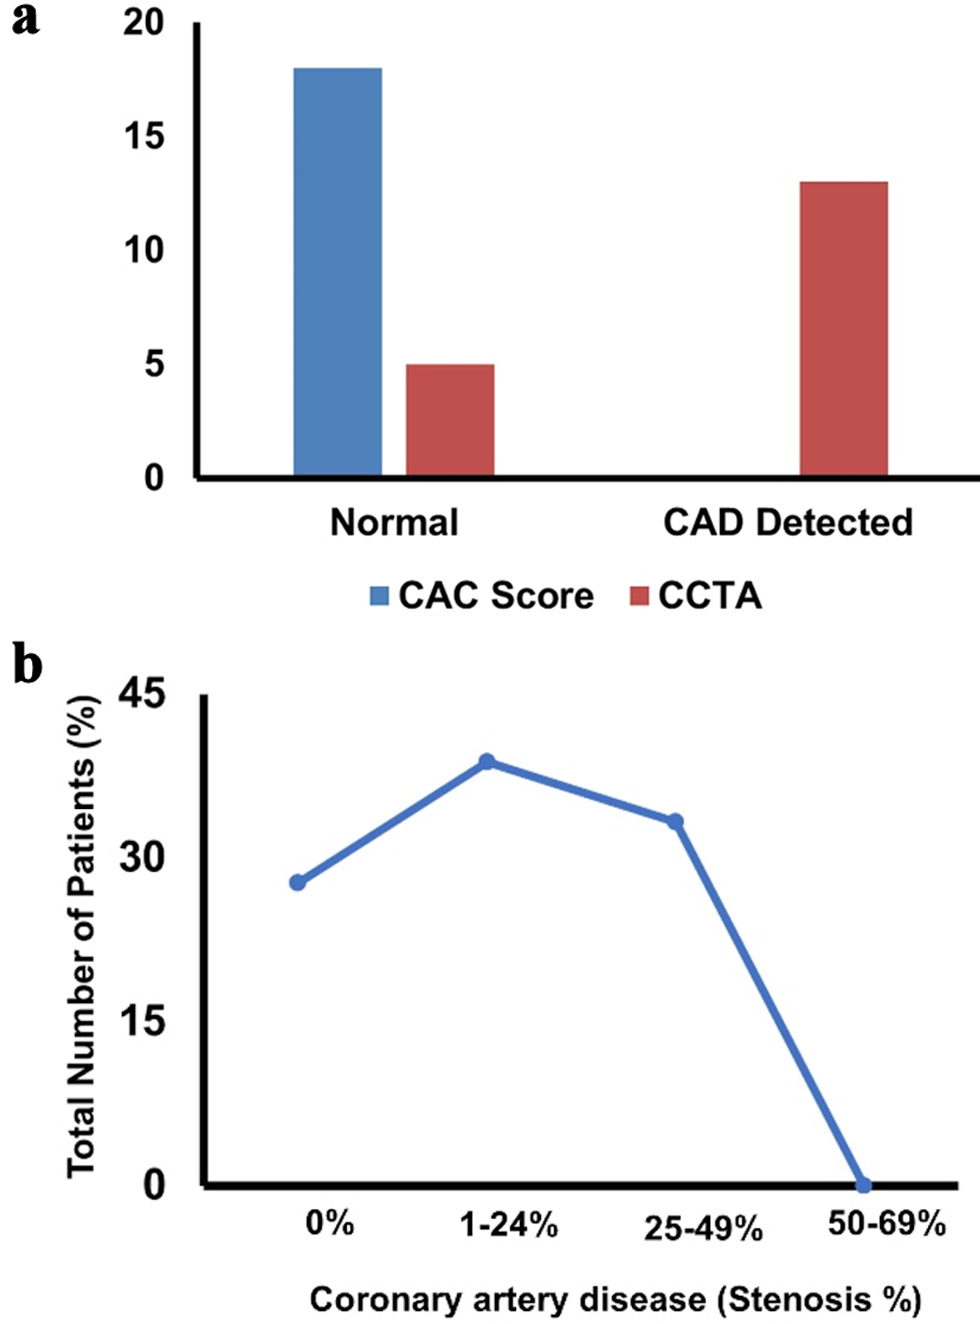
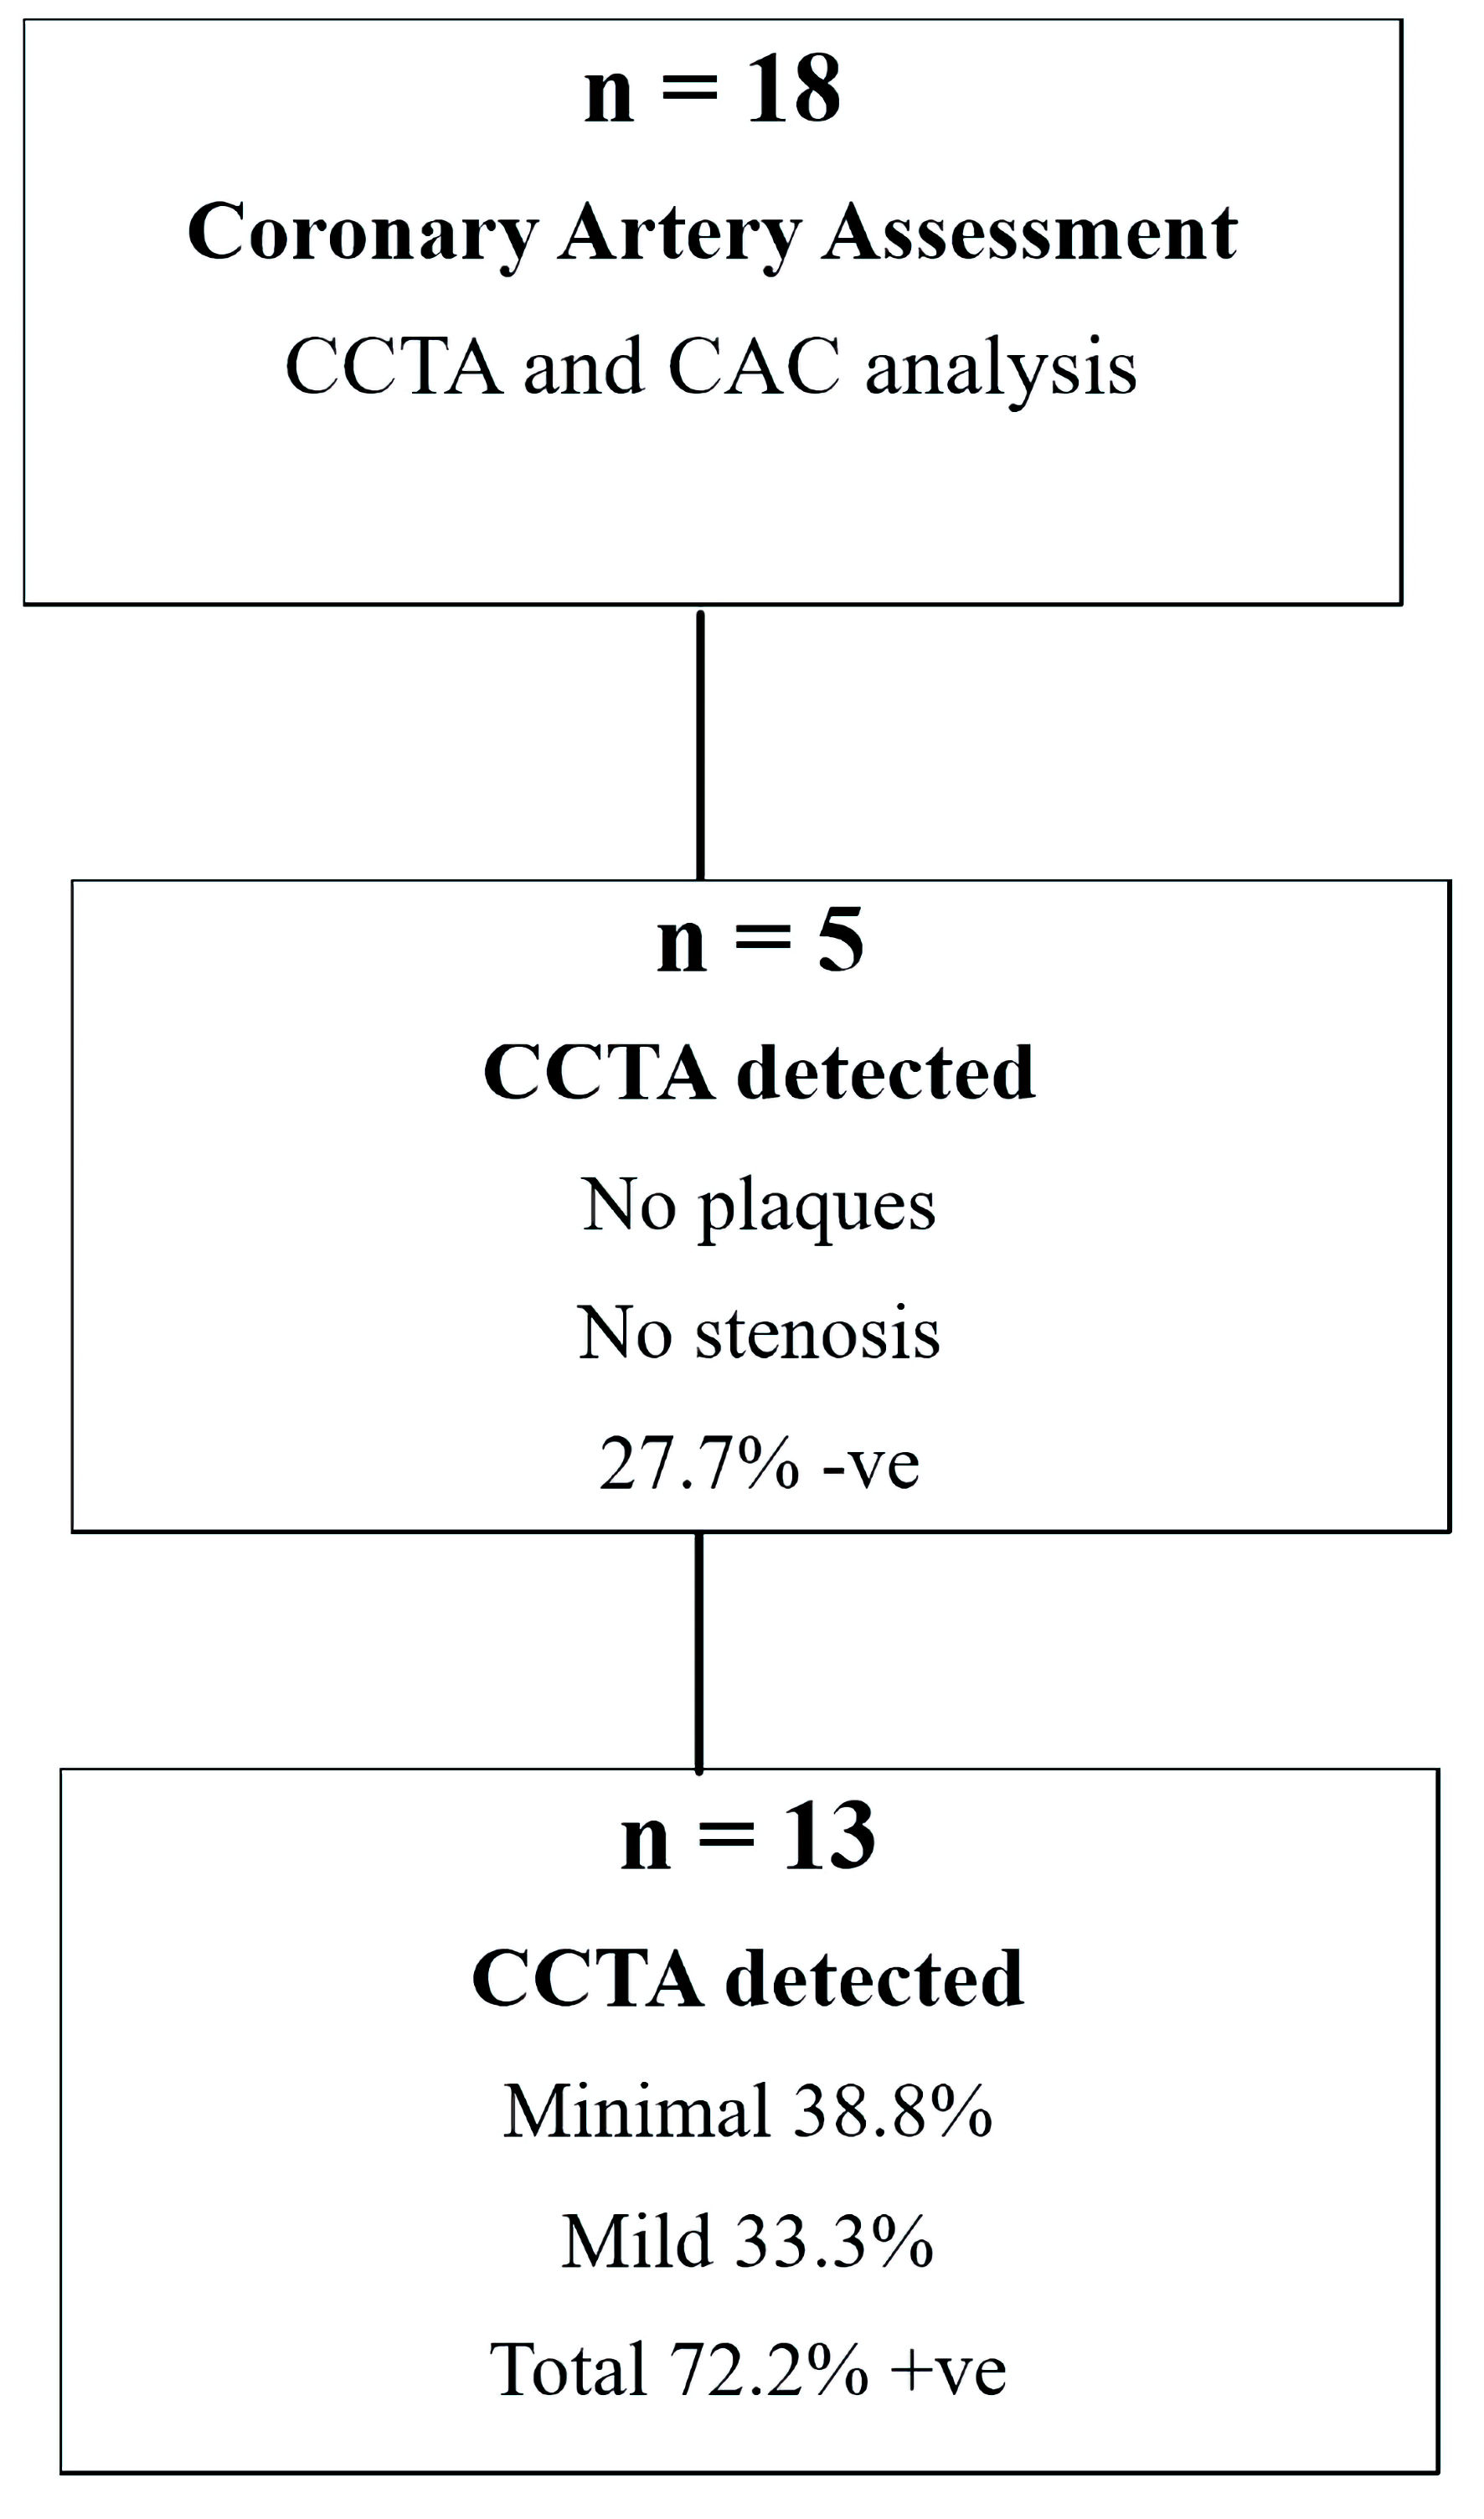
Cardiology Research, ISSN 1923-2829 print, 1923-2837 online, Open Access
Article copyright, the authors; Journal compilation copyright, Cardiol Res and Elmer Press Inc
Journal website https://cr.elmerpub.com

Original Article

Volume 16, Number 6, December 2025, pages 518-524


Preliminary Observations on Discordance Between Coronary Artery Calcium Score of Zero and Coronary Computed Tomography Angiography Findings in Asymptomatic Adults

Figures

Figure 1.
Figure 1. Coronary artery assessment based on CCTA findings in the study population (n = 18). Positive CCTA results were observed in 13 patients (72.2%), including minimal stenosis in 38.8% and mild stenosis in 33.3%. Negative findings were present in five patients (27.7%), with no plaques or stenosis detected. CCTA: coronary computed tomography angiography; +ve: positive; -ve: negative.
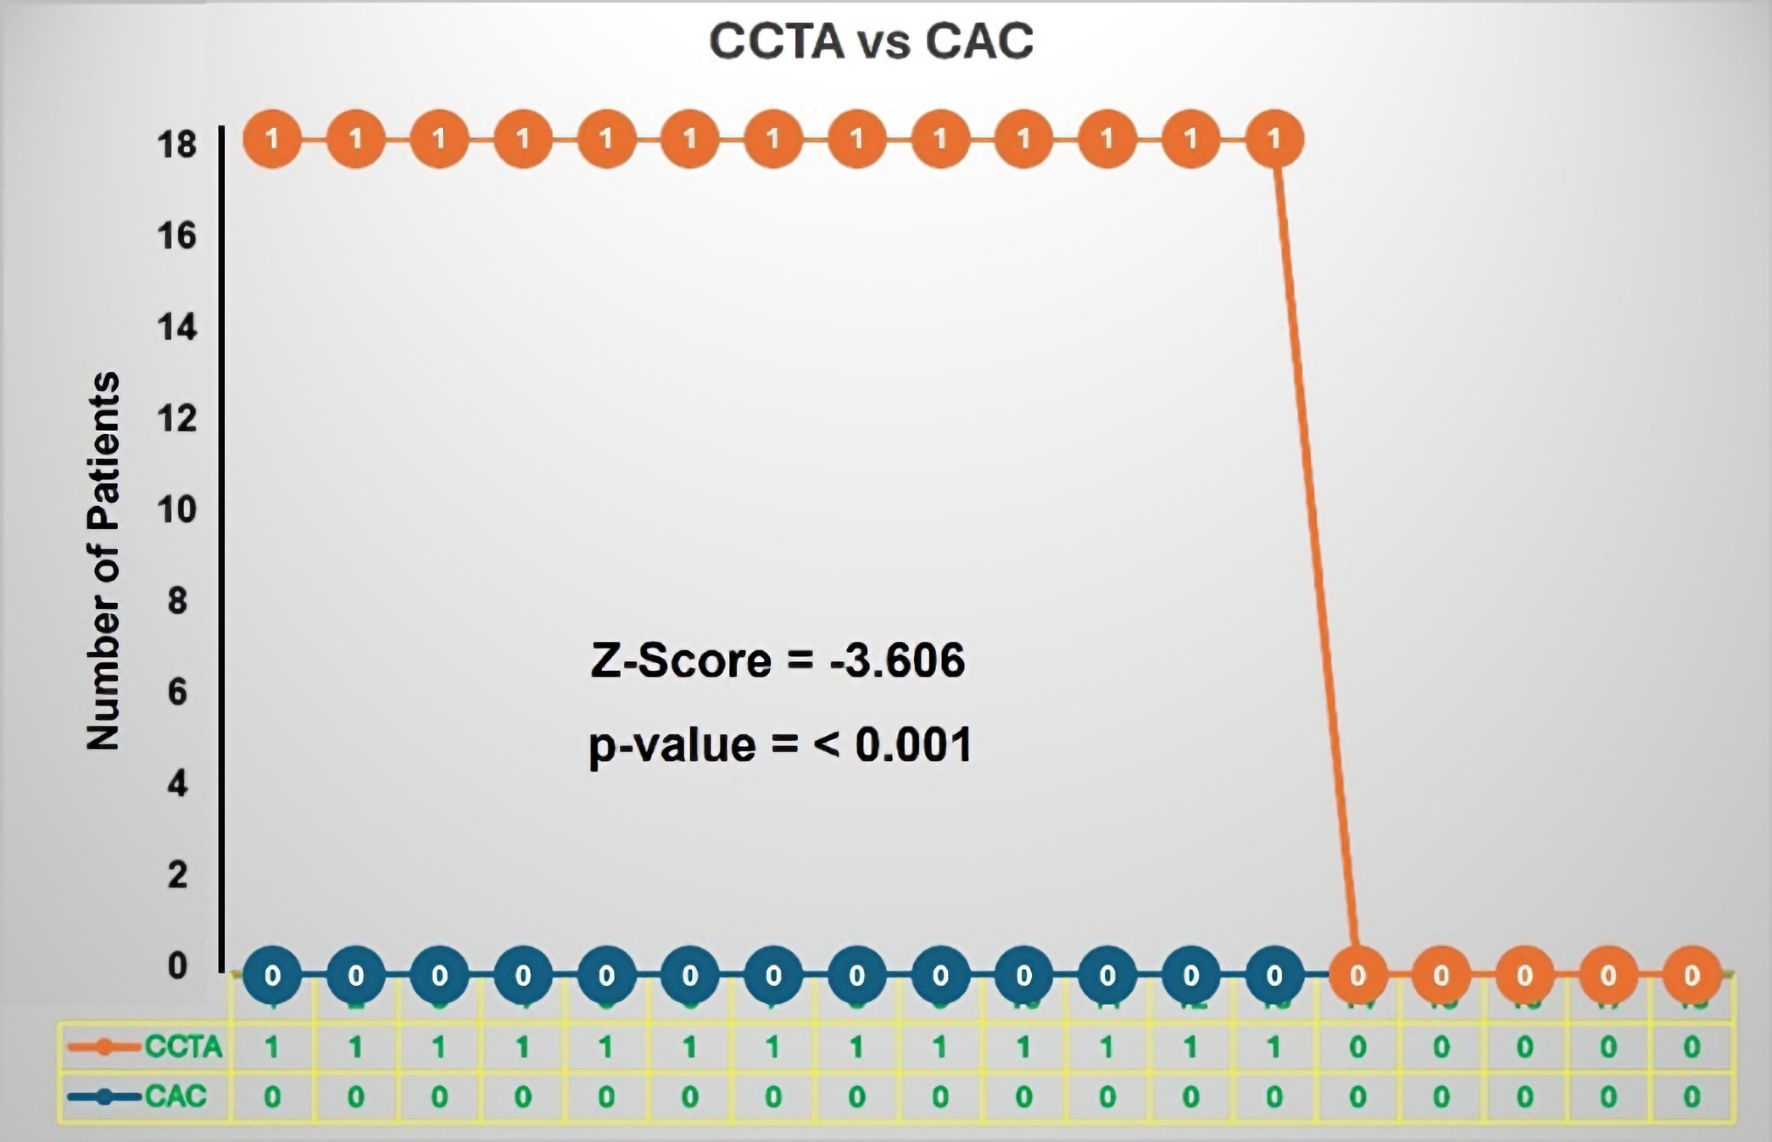
Figure 2.
Figure 2. The diagnostic comparison between CAC scoring and CCTA in 18 asymptomatic individuals. All patients had a CAC score of 0, suggesting no coronary artery disease. However, subsequent CCTA revealed that 13 out of 18 individuals had significant coronary artery disease. A Wilcoxon signed rank test demonstrated statistically significant difference between the two diagnostic modalities (Z = -3.606, P < 0.001). CAC: coronary artery calcium; CCTA: coronary computed tomography angiography.
Figure 3.
Figure 3. (a) Bar chart showing the comparison of CAC score and CCTA in detecting CAD. (b) Curve showing the percentage of patients with stenosis. CAC: coronary artery calcium; CAD: coronary artery disease; CCTA: coronary computed tomography angiography.

Tables

Table 1. Basic Demographic Information of the Participants
 
CharacteristicValue
BMI: body mass index.
Age (years)51.4 ± 10.6
Male16 (88.8%)
Female2 (11.1%)
BMI (kg/m2)27.7 ± 3.6
Normal (BMI ≤ 25)4 (22.2%)
Overweight (25 < BMI ≤ 30)11 (64.7%)
Obese (BMI ≥ 30)2 (11.7%)
Ethnicity (Asian)5 (29.4%)
Ethnicity (White)11 (64.7%)
Ethnicity (Black)1 (5.8%)


Table 2. Lifestyle Factors Information of the Participants
 
CharacteristicValue
CAD: coronary artery disease.
Smoker12 (70.5%)
Alcoholic6 (35.2%)
Positive family history for CAD9 (56.25%)
Diabetes2 (11.76%)
Body fat percentage (19-30%)5 (29.4%)
Body fat percentage (30-40%)5 (29.4%)
Body fat percentage (40-51%)5 (29.4%)
Dietary habits (low carbohydrate)6 (35.2%)
Dietary habits (high carbohydrate)2 (11.76%)
Physical activity level (low)5 (29.41%)
Physical activity level (high)12 (70.58%)


Table 3. Medical History of the Participants
 
CharacteristicValue
History of kidney disease0
History of autoimmune disease0
History of sleep apnea8 (47.05%)
History of hypertension7 (41.17%)


Table 4. Biochemical Markers
 
CharacteristicValue
LDL: low-density lipoprotein; HDL: high-density lipoprotein; HOMA-IR: homeostatic model assessment for insulin resistance; apoB: apolipoprotein B; Lp(a): lipoprotein(a); eGFR: estimated glomerular filtration rate; HbA1c: glycated hemoglobin; CD: cluster of differentiation; anti-TPO: anti-thyroid peroxidase; RDW-CV: red blood cell distribution width-coefficient of variation; VO2 max: maximal oxygen consumption; hs-CRP: high-sensitivity C-reactive protein.
Creatinine (mg/dL)1.16 ± 0.5
Urea (mmol/L)9.36 ± 2.70
eGFR (mL/min)115 ± 14.34
LDL (mg/dL)125.6 ± 52.96
HDL (mg/dL)54.3 ± 11.99
Lp(a) (nmol/L)71.33
HbA1c5.35 ± 0.4
High-sensitivity cardiac troponin T (pg/mL)18.91 ± 5.05
apoB (mg/dL)100.91 ± 34.28
hs-CRP (mg/L)1.61 ± 1.35
Homocysteine (µmol/L)10.41 ± 2.76
CD28 (cells/µL)1.94 ± 0.56
CD25 (cells/µL)1.72 ± 0.65
RDW-CV (%)13.4 ± 1.2
Triglycerides (mg/dL)90.01 ± 24.96
Uric acid (mg/dL)4.11 ± 0.92
HOMA-IR0.78 ± 0.95
Anti-TPO (IU/mL)25.22 ± 27.57
Copper (µg/dL)67.5 ±15.77
VO2 max (mL/kg/min)30 ± 10


Table 5. Distribution of Different Coronary Artery Disease (Stenosis %) Subgroups in Relation to the Total Number of Patients %
 
Coronary artery disease (stenosis %)Total number of patients (%)
None (0%)5 (27.7%)
Minimal (1-24%)7 (38.8%)
Mild (25-49%)6 (33.3%)
Moderate (50-69%)0