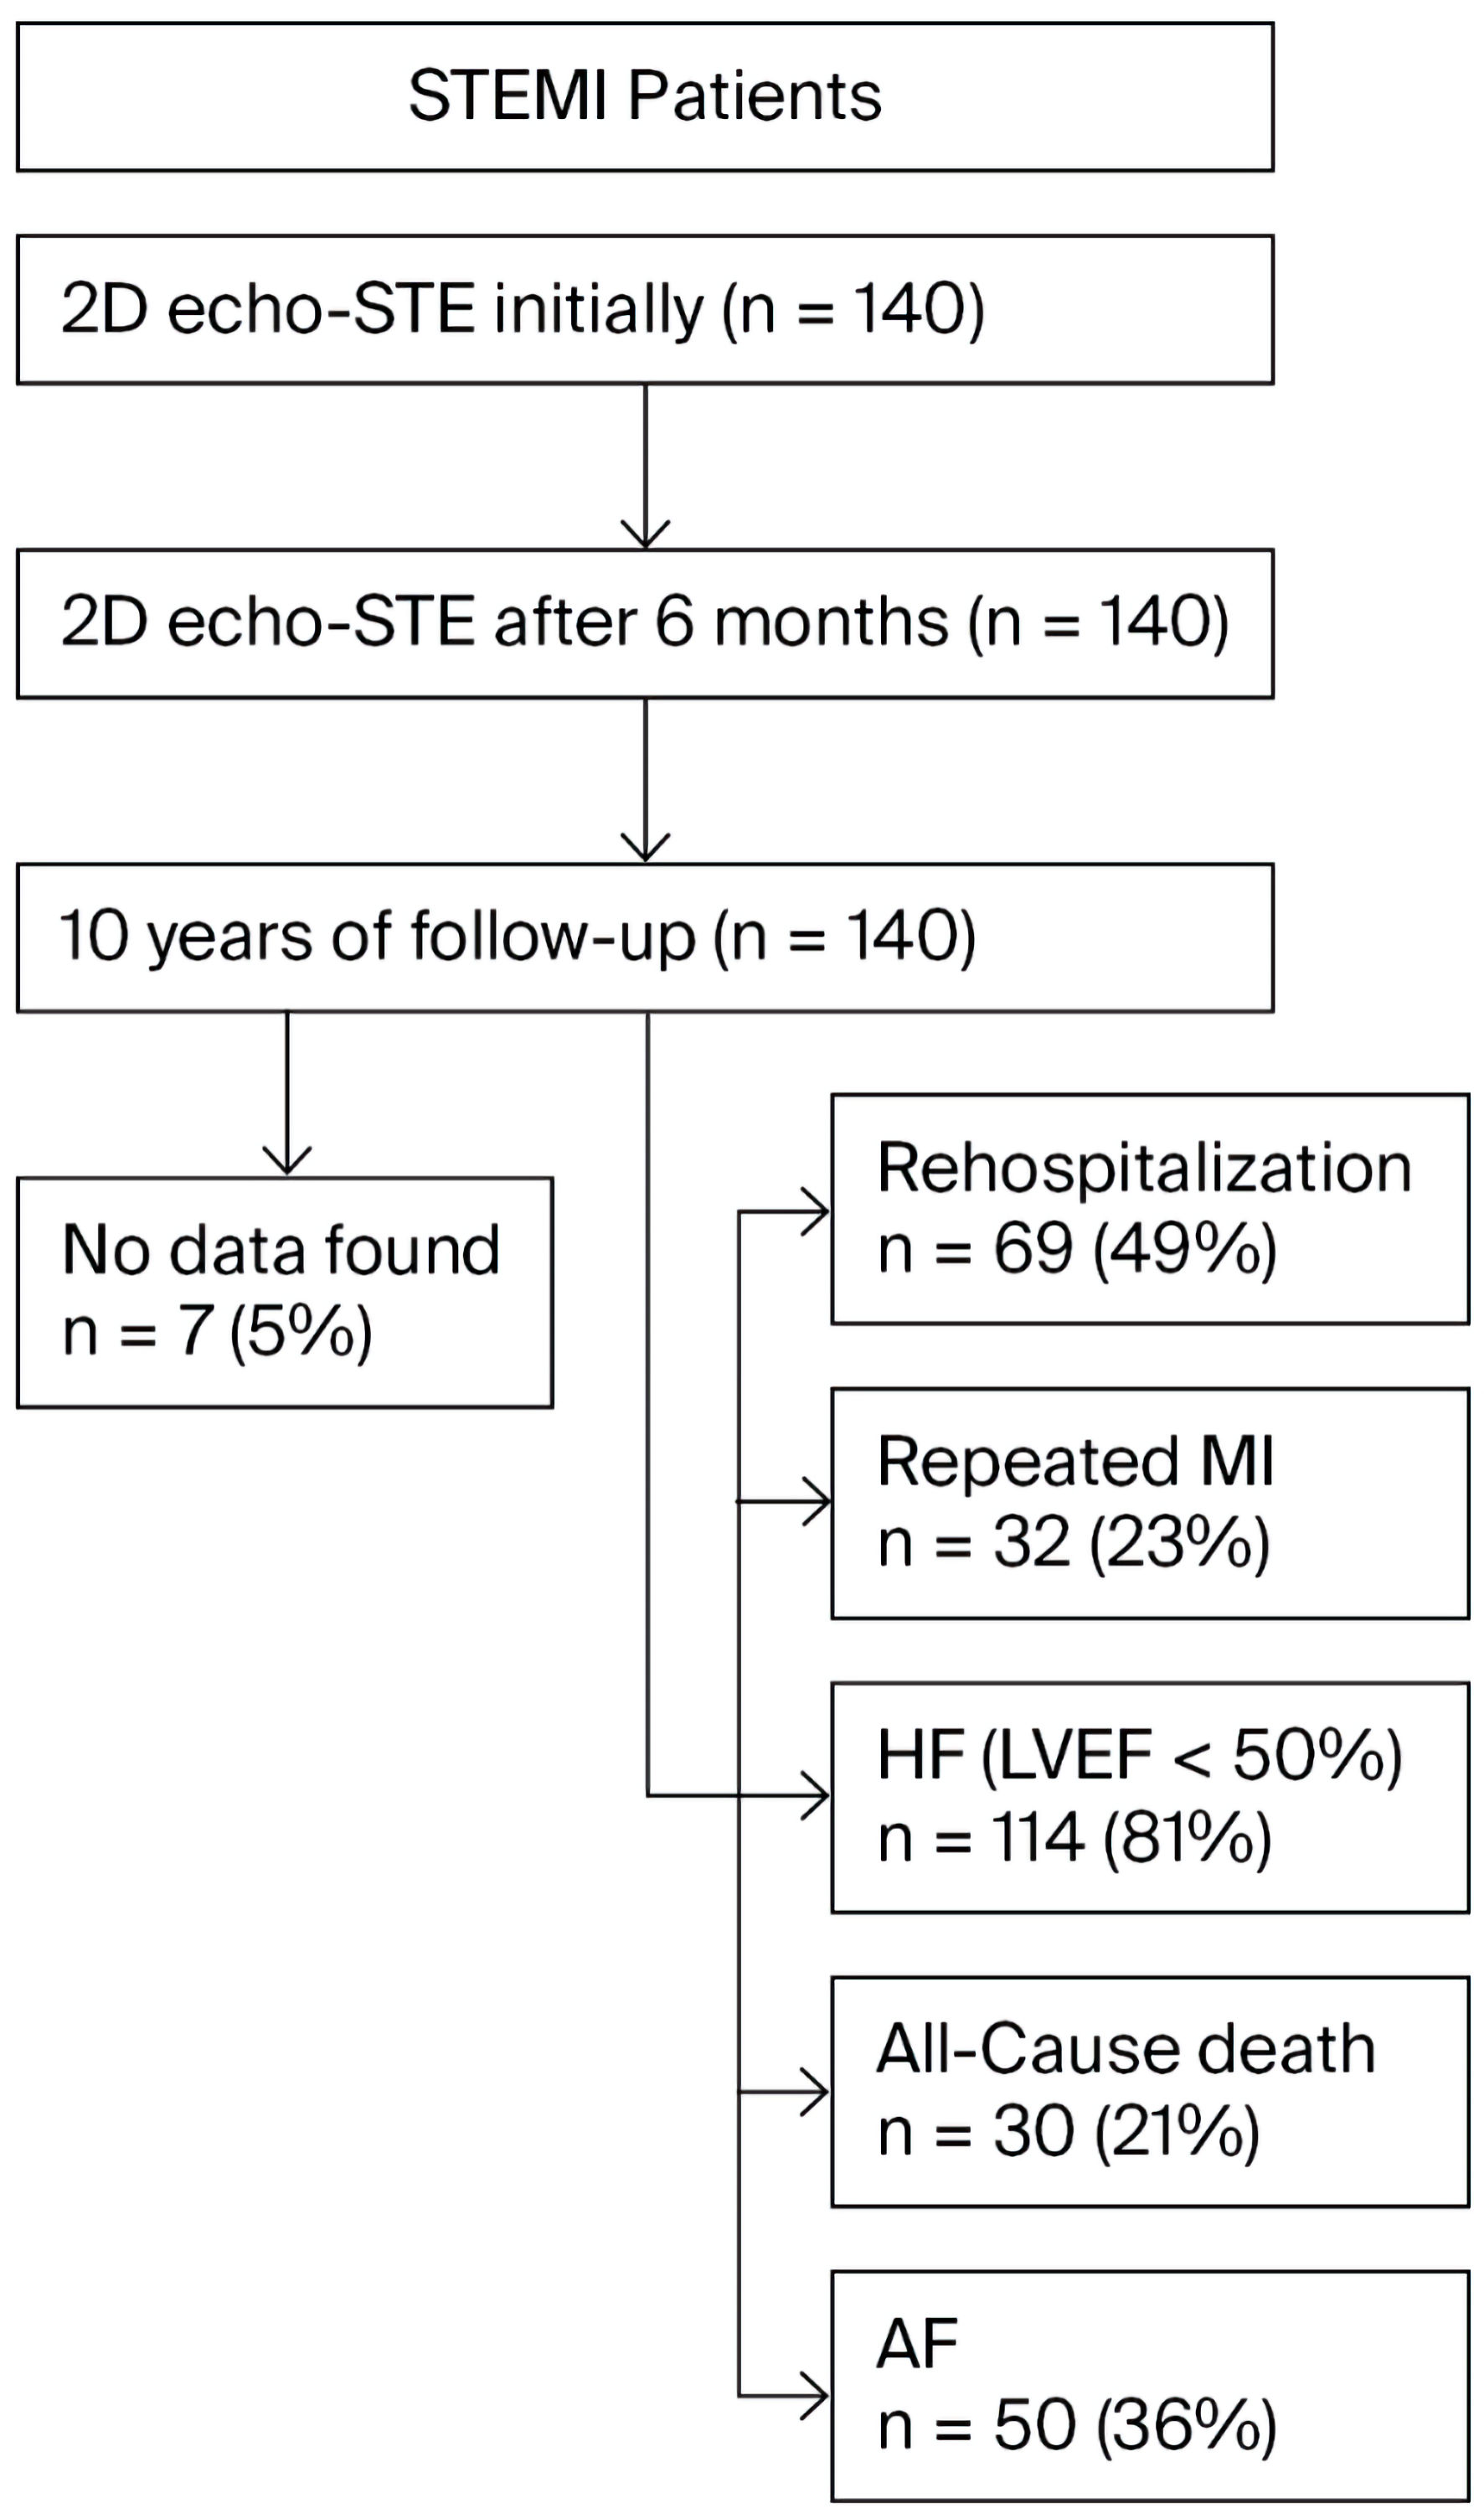
Cardiology Research, ISSN 1923-2829 print, 1923-2837 online, Open Access
Article copyright, the authors; Journal compilation copyright, Cardiol Res and Elmer Press Inc
Journal website https://cr.elmerpub.com

Original Article

Volume 17, Number 1, February 2026, pages 32-42


Left Atrial Deformation Parameters After Myocardial Infarction With Low Triiodothyronine Syndrome and Their Prognostic Value

Figures

Figure 1.
Figure 1. The study design. STEMI: ST-segment elevation myocardial infarction; 2D echo-STE: 2D echocardiography, speckle-tracking echocardiography; MI: myocardial infarction; HF: heart failure; LVEF: left ventricular ejection fraction; AF: atrial fibrillation; 2D: two-dimensional.
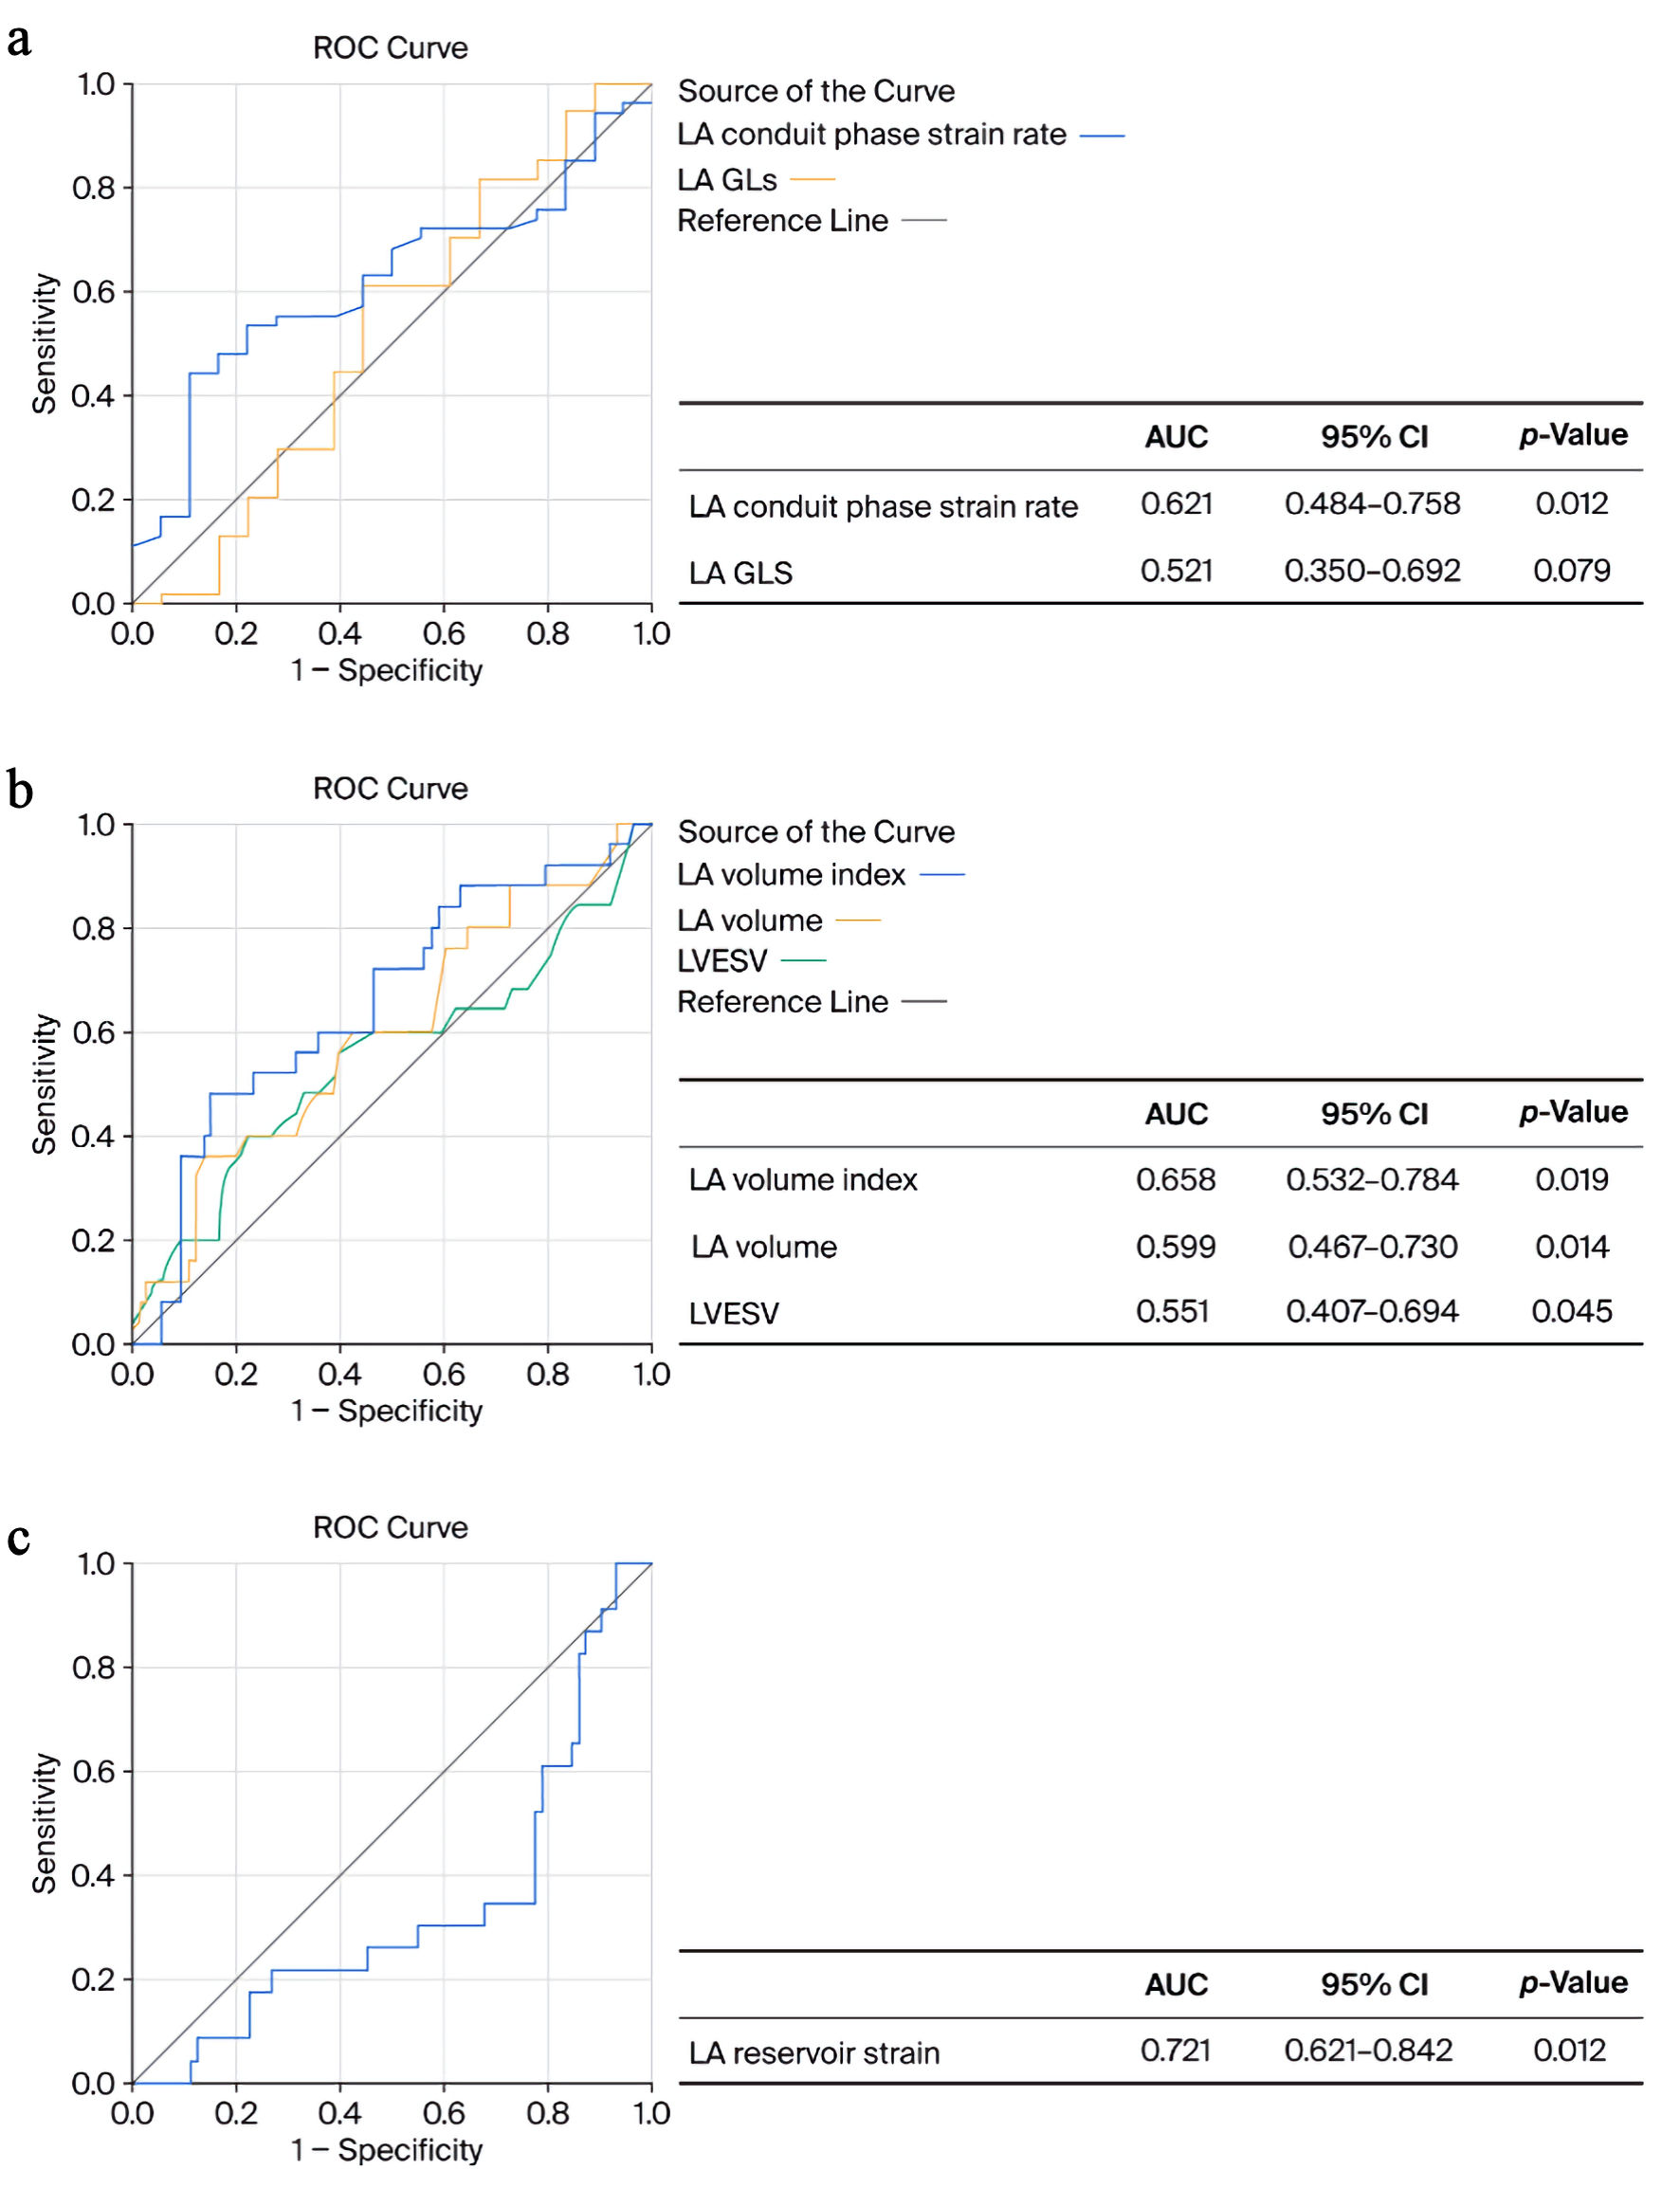
Figure 2.
Figure 2. ROC curves for left atrium (LA) conduit phase strain rate and LA global longitudinal strain (GLS) predicting heart failure (a). LA volume index, LA volume, left ventricular end systolic volume (LVESV) (b), and LA reservoir strain (c) predicting all-cause death. AUC: area under the curve; CI: confidence interval; ROC: receiver operating characteristic.

Tables

Table 1. Clinical Characteristics of the Study Population
 
CharacteristicsLow T3 group (fT3 < 3.2 pmol/L)Control group (fT3 ≥ 3.2 pmol/L)P value
aValues are presented as mean ± standard deviation. BMI: body mass index; CRP: C-reactive protein; fT3: free triiodothyronine; fT4: free thyroxine; TSH: thyroid-stimulating hormone.
Male, n (%)29 (65.9)84 (87.5)0.75
Female, n (%)15 (34.1)12 (12.5)
Age (years)62.7 ± 9.956.3 ± 12.30.008
History of hypertension, n (%)21 (61.8)58 (60.4)0.87
Hyperlipidemia, n (%)21 (61.8)36 (37.5)0.014
BMI (kg/m2)27.9 ± 5.527.9 ± 4.80.96
Troponin I (µg/mL)41.1 ± 58.253.3 ± 84.40.46
High sensitivity CRP (mg/L)23.4 ± 6.9a18.8 ± 3.7a0.03
fT3 (pmol/L)3.12 ± 0.24.05 ± 0.10.029
fT4 (pmol/L)13.75 ± 2.314.7 ± 2.80.47
TSH (mU/L), median (Q1; Q3)1.86 (0.82; 3.48)1.67 (1.23; 8.78)0.51


Table 2. Two-Dimensional, Transvalvular, Tissue Doppler, and Left Atrial Myocardial Deformation Parameters in the Acute Period of Myocardial Infarction
 
ParametersMean values (95% CI)P value
Low T3 group (fT3 < 3.2 pmol/L), n = 44Control group (fT3 ≥ 3.2 pmol/L), n = 96
fT3: free triiodothyronine; T3: triiodothyronine; CI: confidence interval; LVEDD: left ventricular end-diastolic diameter; LVESD: left ventricular end-systolic diameter; LVEDV: left ventricular end-diastolic volume; LVESV: left ventricular end-systolic volume; LVEF: left ventricular ejection fraction; LA: left atrium; E/E’: ratio of early diastolic transmitral flow velocity and early diastolic mitral annular velocity; GLS: global longitudinal strain.
LVEDD (mm)48.9 (46.9 ± 50.8)48.8 (47.8 ± 49.7)0.634
LVESD (mm)39.9 (37.7 ± 42.2)39.4 (38.5 ± 40.2)0.549
LVEDV (mL)101.2 (95.1 ± 107.2)107.9 (104.9 ± 110.7)0.040
LVESV (mL)37.9 (34.0 ± 41.8)43.3 (41.1 ± 45.6)0.006
LVEF (%)40.9 (39.2 ± 42.5)42.0 (38.5 ± 45.6)0.364
LA volume (mL)39.3 (34.9 ± 43.7)38.6 (36.6 ± 40.6)0.987
LA volume index (mL/m2)20.1 (17.7 ± 22.6)19.2 (18.3 ± 20.1)0.845
E/E’8.6 (7.1 ± 10.1)8.4 (7.8 ± 8.9)0.648
LA reservoir strain (%)23.1 (18.6 ± 27.7)22.3 (19.9 ± 24.6)0.434
LA GLS (%)22.1 (15.8 ± 28.5)21.7 (18.4 ± 24.9)0.641
LA conduit phase strain rate (s−1)0.8 (0.6 ± 0.9)0.94 (0.85 ± 1.0)0.040
LA contractile phase strain rate(s−1)0.9 (0.6 ± 1.2)1.05 (0.9 ± 1.2)0.425


Table 3. Left Ventricular and Atrial Parameters 6 Months After Myocardial Infarction
 
ParametersMean values (95% CI)P value
Low T3 group (fT3 < 3.2), n = 44Control group (fT3 ≥ 3.2), n = 96
fT3: free triiodothyronine; T3: triiodothyronine; CI: confidence interval; LVEDD: left ventricular end-diastolic diameter; LVESD: left ventricular end-systolic diameter; LVEDV: left ventricular end-diastolic volume; LVESV: left ventricular end-systolic volume; EF: ejection fraction; LA: left atrium; E/E’: ratio of early diastolic transmitral flow velocity and early diastolic mitral annular velocity.
LVEDD (mm)51.0 (47.4 ± 54.6)51.3 (50.1 ± 52.4)0.588
LVESD (mm)42.9 (39.4 ± 46.6)42.3 (41.3 ± 43.4)0.641
LVESV (mL)43.6 (34.4 ± 52.7)47.4 (44.6 ± 50.3)0.312
LVEDV (mL)107.3 (94.3 ± 120.3)111.1 (107.4 ± 114.8)0.443
EF (%)40.4 (34.7 ± 46.1)40.0 (38.2 ± 41.8)0.451
LA volume (mL)56.1 (40.9 ± 71.3)50.9 (47.4 ± 54.5)0.030
LA index volume (mL/m2)28.5 (21.6 ± 35.3)25.2 (23.6 ± 26.7)0.040
E/E’9.4 (6.9 ± 11.9)8.6 (7.3 ± 9.9)0.061


Table 4. Two-Dimensional, Transvalvular and Tissue Doppler Parameters Between Group 1 and Group 2 in the Acute Period of Myocardial Infarction and After 6 Months of Myocardial Infarction
 
ParametersMean values (95% CI)P value
Group 1(EF ≥ 50%), n = 26Group 2 (EF ≤ 40%), n = 68
CI: confidence interval; EF: ejection fraction; LVEDD: left ventricular end-diastolic diameter; LVESD: left ventricular end-systolic diameter; LVEDV: left ventricular end-diastolic volume; LVESV: left ventricular end-systolic volume; LVEF: left ventricular ejection fraction; LA: left atrium; E/E’: ratio of early diastolic transmitral flow velocity and early diastolic mitral annular velocity.
LVEDD (mm)At baseline45.7 (44.0 ± 46.5)50.4 (49.3 ± 51.1)< 0.0001
After 6 months47.7 (46.0 ± 49.5)52.8 (48.4 ± 53.6)< 0.0001
LVESD (mm)At baseline36.6 (35.1 ± 37.3)40.7 (39.6 ± 41.3)< 0.0001
After 6 months39.6 (37.7 ± 41.9)44.3 (43.8 ± 45.2)0.0003
LVEDV (mL)At baseline107.1 (100.5 ± 113.8)107.4 (104.1 ± 110.8)0.94
After 6 months108.4 (101.2 ± 115.9)111.6 (106.3 ± 116.9)0.512
LVESV (mL)At baseline33.0 (29.5 ± 34.5)46.8 (43.9 ± 48.1)< 0.0001
After 6 months37.3 (34.1 ± 40.0)51.5 (48.8 ± 53.2)< 0.0001
LVEF (%)At baseline54.3 (52.3 ± 55.3)33.8 (32.7 ± 34.1)< 0.0001
After 6 months51.5 (48.9 ± 54.1)35.1 (33.9 ± 37.1)< 0.0001
LA volume (mL)At baseline34.3 (30.4 ± 38.2)40.2 (37.9 ± 42.1)0.008
After 6 months45.1 (37.7 ± 48.3)53.1 (48.8 ± 57.1)0.034
LA volume index (mL/m2)At baseline17.6 (15.9 ± 19.3)19.8 (18.7 ± 20.9)0.034
After 6 months20.9 (18.6 ± 23.3)27.0 (24.1 ± 28.8)0.014
E/E’At baseline8.0 (6.7 ± 9.4)8.5 (7.8 ± 9.3)0.486
After 6 months8.2 (6.2 ± 9.8)9.3 (7.1 ± 11.5)0.521


Table 5. Left Atrial Myocardial Deformation Parameters Between Group 1 and Group 2 in the Acute Period of Myocardial Infarction and After 6 Months of Myocardial Infarction
 
ParametersMean values (95% CI)P value
Group 1 (EF ≥ 50%), n = 26Group 2 (EF ≤ 40%), n = 68
CI: confidence interval; EF: ejection fraction; LA: left atrial; GLS: global longitudinal strain.
LA reservoir strain (%)At baseline30.7 (22.1 ± 39.3)21.6 (19.8 ± 23.1)0.019
After 6 months28.1 (19.3 ± 36.9)23.4 (19.7 ± 27.1)0.234
LA GLS (%)At baseline26.9 (19.4 ± 34.5)21.1 (17.4 ± 24.8)0.116
After 6 months25.05 (14.5 ± 35.5)14.35 (9.3 ± 19.3)0.048
LA conduit phase strain rate (s−1)At baseline0.8 (0.6 ± 1.0)0.92 (0.8 ± 1.1)0.275
After 6 months1.14 (0.8 ± 1.4)0.79 (0.7 ± 0.9)0.018
LA contractile phase strain rate (s−1)At baseline1.2 (0.9 ± 1.5)0.98 (0.8 ± 1.2)0.104
After 6 months1.39 (0.9 ± 1.8)0.92 (0.7 ± 1.1)0.036


Table 6. Two-Dimensional and Left Atrial Myocardial Deformation Parameters Between Group 1 and Group 3 in the Acute Period and After 6 Months of Myocardial Infarction
 
ParametersMean values (95% CI)P value
Group 1 (EF ≥ 50%), n = 26Group 3 (EF 41–49%), n = 46
CI: confidence interval; EF: ejection fraction; LA: left atrial; LVESV: left ventricular end-systolic volume; LVEF: left ventricular ejection fraction.
LA reservoir strain (%) in the acute period30.7 (22.1 ± 39.3)22.2 (17.8 ± 26.6)0.045
LVESV (mL) after 6 months37.3 (34.1 ± 40.0)42.9 (39.8 ± 45.9)0.039
LVEF (%) after 6 months51.5 (48.9 ± 54.1)42.9 (40.5 ± 45.1)< 0.0001
LA volume index (mL/m2) after 6 months20.9 (18.6 ± 23.3)25.8 (22.9 ± 28.6)0.037
LA conduit phase strain rate (s−1) after 6 months1.14 (0.8 ± 1.4)0.82 (0.7 ± 0.9)0.018
LA contractile phase strain rate (s−1) after 6 months1.39 (0.9 ± 1.8)0.86 (0.6 ± 1.1)0.022


Table 7. Multivariate Logistic Regression Analysis Data for Predicting MACEs
 
ParametersExp(B)95% CIP
CI: confidence interval; LA: left atrial; LVEF: left ventricular ejection fraction.
LA conduit phase strain rate9.9718.72–11.340.008
LA volume index1.1860.84–1.260.004
LA reservoir strain0.9580.72–1.270.042
LVEF0.9440.81–1.320.021