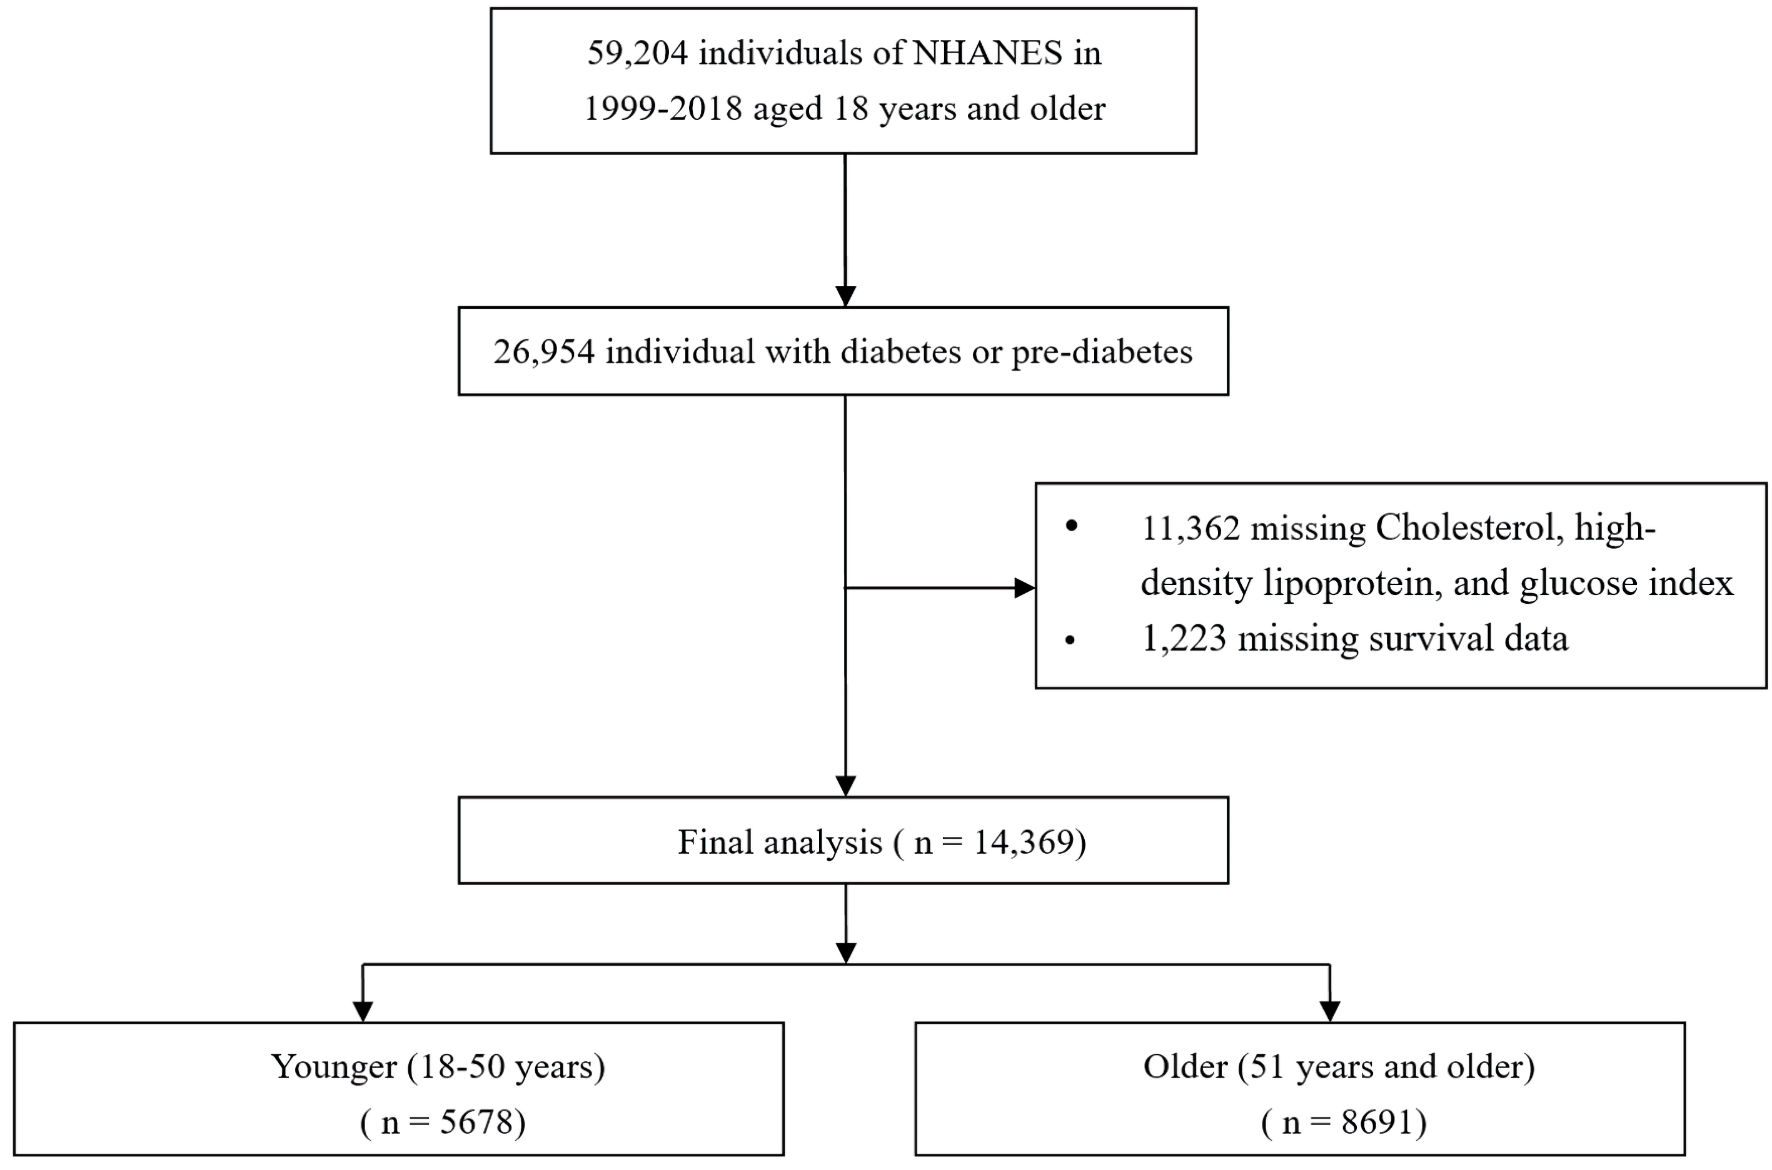
↓ Figure 1. Flow chart of study participants. NHANES: National Health and Nutrition Examination Survey.
| Cardiology Research, ISSN 1923-2829 print, 1923-2837 online, Open Access |
| Article copyright, the authors; Journal compilation copyright, Cardiol Res and Elmer Press Inc |
| Journal website https://cr.elmerpub.com |
Original Article
Volume 17, Number 2, April 2026, pages 136-148
The Association Between Cholesterol, High-Density Lipoprotein, and Glucose Index and Mortality in Young and Middle-Aged Adults With Diabetes or Prediabetes: NHANES Data (1999–2018)
Figures
Tables
| Characteristic | Quartiles of CHG index | P value | ||||
|---|---|---|---|---|---|---|
| Overall | Q1 (3.07, 5.12) | Q2 (5.12, 5.37) | Q3 (5.37, 5.64) | Q4 (5.64, 8.02) | ||
| ALT: alanine aminotransferase; AST: aspartate aminotransferase; BUN: blood urea nitrogen; CHG: cholesterol, high-density lipoprotein, and glucose; HDL: high-density lipoprotein cholesterol; LDH: lactate dehydrogenase; LDL-C: low-density lipoprotein cholesterol; HbA1C: hemoglobin A1c; TBil: total bilirubin; TC: total cholesterol; UA: uric acid; GGT: γ-glutamyl transferase; CRP: C-reactive protein; SCr: serum creatinine. | ||||||
| N | 5,678 | 1,420 | 1,419 | 1,419 | 1,420 | |
| Age, years | 38 (29, 45) | 34 (24, 43) | 36 (27, 44) | 39 (31, 45) | 40 (33, 45) | < 0.001 |
| Family poverty income ratio | 1.83 (0.96, 3.69) | 1.86 (0.95, 3.72) | 1.83 (0.94, 3.74) | 1.87 (1.02, 3.81) | 1.77 (0.95, 3.42) | 0.202 |
| BMI, kg/m2 | 29 (25, 34) | 26 (23, 31) | 29 (25, 34) | 30 (27, 35) | 31 (28, 36) | < 0.001 |
| Waist circumference, cm | 99 (90, 111) | 90 (80, 102) | 98 (89, 109) | 102 (94, 113) | 106 (97, 118) | < 0.001 |
| Gender, n (%) | < 0.001 | |||||
| Female | 2,380 (41.9%) | 822 (57.9%) | 629 (44.3%) | 501 (35.3%) | 428 (30.1%) | |
| Male | 3,298 (58.1%) | 598 (42.1%) | 790 (55.7%) | 918 (64.7%) | 992 (69.9%) | |
| Race, n (%) | < 0.001 | |||||
| Mexican American | 1,321 (23.3%) | 266 (18.7%) | 336 (23.7%) | 349 (24.6%) | 370 (26.1%) | |
| Non-Hispanic Black | 1,241 (21.9%) | 453 (31.9%) | 319 (22.5%) | 246 (17.3%) | 223 (15.7%) | |
| Non-Hispanic White | 1,955 (34.4%) | 408 (28.7%) | 481 (33.9%) | 519 (36.6%) | 547 (38.5%) | |
| Other race | 1,161 (20.4%) | 293 (20.6%) | 283 (19.9%) | 305 (21.5%) | 280 (19.7%) | |
| Education, n (%) | 5,258/5,678 | 1,247/1,420 | 1,246/1,419 | 1,355/1,419 | 1,374/1,420 | < 0.001 |
| Less than 9th grade | 525 (10.0%) | 88 (7.1%) | 113 (8.8%) | 143 (10.6%) | 181 (13.2%) | |
| 9th–11th grade | 895 (17.0%) | 178 (14.3%) | 219 (17.1%) | 244 (18.0%) | 254 (18.5%) | |
| High school graduate or equivalent | 1,244 (23.7%) | 270 (21.7%) | 287 (22.4%) | 332 (24.5%) | 355 (25.8%) | |
| Some college or above | 2,594 (49.3%) | 711 (57.0%) | 663 (51.7%) | 636 (46.9%) | 584 (42.5%) | |
| Miss | 420 | 173 | 137 | 64 | 46 | |
| Cerebrovascular disease, n (%) | < 0.001 | |||||
| Congestive heart failure | 59 (1.1%) | 12 (1.0%) | 12 (0.9%) | 11 (0.8%) | 24 (1.7%) | |
| Coronary heart disease | 41 (0.8%) | 8 (0.6%) | 8 (0.6%) | 9 (0.7%) | 16 (1.2%) | |
| Angina pectoris | 49 (0.9%) | 8 (0.6%) | 8 (0.6%) | 7 (0.5%) | 26 (1.9%) | |
| Myocardial infarction | 69 (1.3%) | 11 (0.9%) | 11 (0.9%) | 12 (0.9%) | 35 (2.5%) | |
| Stroke | 63 (1.2%) | 14 (1.1%) | 9 (0.7%) | 13 (1.0%) | 27 (2.0%) | |
| Diabetes status, n (%) | < 0.001 | |||||
| Diabetes | 926 (16.3%) | 72 (5.1%) | 110 (7.8%) | 175 (12.3%) | 569 (40.1%) | |
| Prediabetes | 4,752 (83.7%) | 1,348 (94.9%) | 1,309 (92.2%) | 1,244 (87.7%) | 851 (59.9%) | |
| Smoking status, n (%) | 5,384/5,678 | 1,306/1,420 | < 0.001 | |||
| Current | 1,430 (26.6%) | 275 (21.1%) | 352 (26.6%) | 360 (26.2%) | 443 (32.1%) | |
| Former | 914 (17.0%) | 196 (15.0%) | 208 (15.7%) | 257 (18.7%) | 253 (18.3%) | |
| Never | 3,040 (56.5%) | 835 (63.9%) | 763 (57.7%) | 756 (55.1%) | 686 (49.6%) | |
| Miss | 294 | 114 | 96 | 46 | 38 | |
| Hypertension, n (%) | < 0.001 | |||||
| No | 4,298 (76.0%) | 1,162 (82.2%) | 1,097 (77.5%) | 1,085 (77.1%) | 954 (67.3%) | |
| Yes | 1,357 (24.0%) | 252 (17.8%) | 319 (22.5%) | 323 (22.9%) | 463 (32.7%) | |
| Miss | 23 | 6 | 3 | 11 | 3 | |
| Alcohol consumption, n (%) | < 0.001 | |||||
| Heavy | 319 (6.0%) | 85 (6.6%) | 97 (7.4%) | 70 (5.2%) | 67 (4.9%) | |
| Moderate | 2,102 (39.6%) | 382 (29.5%) | 499 (38.3%) | 593 (44.1%) | 628 (46.1%) | |
| Mild | 2,276 (42.9%) | 665 (51.3%) | 556 (42.7%) | 525 (39.0%) | 530 (38.9%) | |
| Never | 609 (11.5%) | 164 (12.7%) | 151 (11.6%) | 157 (11.7%) | 137 (10.1%) | |
| Miss | 372 | 124 | 116 | 74 | 58 | |
| Laboratory measurements | ||||||
| TC, mg/dL | 190 (165, 219) | 166 (145, 189) | 183 (162, 205) | 197 (177, 223) | 218 (192, 245) | < 0.001 |
| TG, mmol/L | 1.25 (0.85, 1.92) | 0.75 (0.58, 1.03) | 1.08 (0.82, 1.47) | 1.45 (1.11, 1.94) | 2.21 (1.58, 3.29) | < 0.001 |
| HDLC, mmol/L | 1.22 (1.01, 1.45) | 1.58 (1.37, 1.81) | 1.29 (1.14, 1.45) | 1.11 (1.01, 1.24) | 0.96 (0.84, 1.09) | < 0.001 |
| LDLC, mmol/L | 2.97 (2.38, 3.60) | 2.30 (1.91, 2.73) | 2.92 (2.46, 3.36) | 3.28 (2.77, 3.83) | 3.57 (2.97, 4.19) | < 0.001 |
| HbA1C, % | 5.60 (5.30, 5.80) | 5.40 (5.20, 5.70) | 5.50 (5.20, 5.70) | 5.50 (5.30, 5.80) | 5.80 (5.40, 7.00) | < 0.001 |
| Fasting glucose, mg/dL | 104 (101, 112) | 101 (97, 105) | 103 (100, 108) | 105 (101, 111) | 114 (105, 156) | < 0.001 |
| Insulin, pmol/L | 13 (8, 21) | 9 (6, 14) | 12 (7, 19) | 14 (9, 22) | 18 (12, 28) | < 0.001 |
| TBil, umol/L | 10.3 (8.6, 13.7) | 10.3 (8.6, 13.7) | 10.3 (8.6, 13.7) | 10.3 (8.6, 13.7) | 10.3 (8.6, 13.7) | 0.024 |
| LDH, mmol/L | 127 (112, 145) | 124 (110, 142) | 126 (111, 145) | 128 (113, 146) | 129 (114, 147) | < 0.001 |
| BUN, mmol/L | 4.28 (3.21, 5.00) | 3.93 (3.21, 5.00) | 3.93 (3.21, 5.00) | 4.28 (3.57, 5.00) | 4.28 (3.57, 5.36) | < 0.001 |
| UA, µmol/L | 327 (274, 387) | 286 (244, 339) | 327 (274, 381) | 345 (292, 405) | 351 (296, 410) | < 0.001 |
| SCr, µmol/L | 72 (62, 84) | 71 (59, 81) | 72 (62, 85) | 73 (63, 86) | 72 (62, 86) | 0.006 |
| Serum iron, µmol/L | 15 (11, 19) | 14 (10, 19) | 15 (11, 19) | 15 (11, 19) | 15 (11, 19) | 0.401 |
| Serum potassium, mmol/L | 4.00 (3.80, 4.20) | 3.98 (3.80, 4.20) | 4.00 (3.80, 4.20) | 4.00 (3.80, 4.20) | 4.00 (3.80, 4.20) | < 0.001 |
| GGT, IU/L | 23 (16, 35) | 17 (12, 24) | 21 (15, 30) | 25 (18, 37) | 31 (22, 48) | < 0.001 |
| AST, IU/L | 23 (19, 28) | 21 (18, 26) | 22 (19, 27) | 23 (19, 29) | 25 (20, 31) | < 0.001 |
| ALT, IU/L | 23 (17, 34) | 18 (14, 24) | 22 (17, 31) | 26 (19, 37) | 30 (21, 44) | < 0.001 |
| CRP, mmol/L | 0.42 (0.14, 1.45) | 0.31 (0.08, 1.13) | 0.42 (0.12, 1.51) | 0.46 (0.15, 1.42) | 0.51 (0.21, 1.62) | 0.177 |
| Characteristic | Model 1 | Model 2 | Model 3 | ||||||
|---|---|---|---|---|---|---|---|---|---|
| HR | 95% CI | P value | HR | 95% CI | P value | HR | 95% CI | P value | |
| Model 1: no covariates were adjusted. Model 2 accounted for age, race, gender, education level, and family income-poverty ratio. Model 3: model 2 + hypertension, CVD (coronary heart disease, congestive heart failure, myocardial infarction, angina pectoris, stroke), smoking status, and alcohol consumption. HR: hazard ratio; CI: confidence interval; CHG: cholesterol, high-density lipoprotein, and glucose; CV: cardiovascular. | |||||||||
| All–cause mortality | |||||||||
| Diabetes or prediabetes with 18–50 years | |||||||||
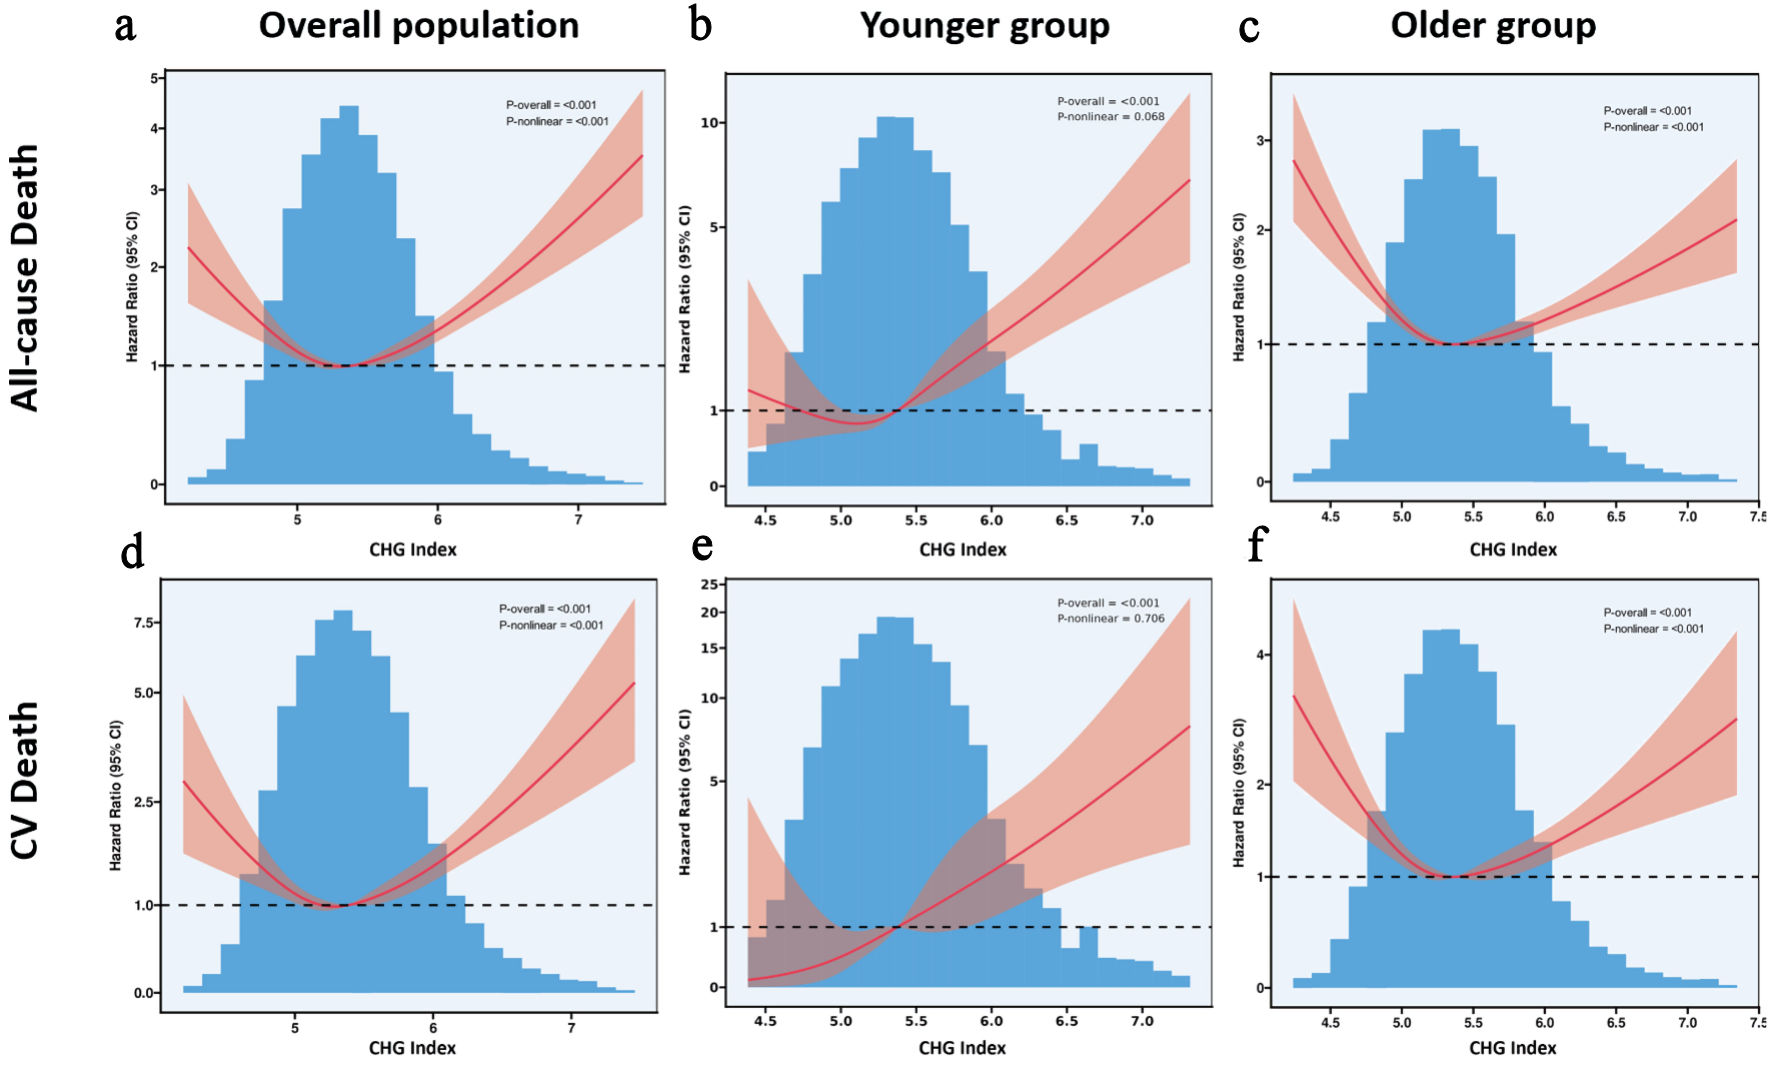
| CHG index (continuous) | 2.46 | 1.94–3.12 | < 0.001 | 2.06 | 1.57–2.69 | < 0.001 | 1.86 | 1.40–2.47 | < 0.001 |
| CHG index | |||||||||
| Q1 | 1 (reference) | 1 (reference) | 1 (reference) | ||||||
| Q2 | 1.23 | 0.77–1.95 | 0.383 | 1.05 | 0.64–1.72 | 0.841 | 0.96 | 0.58–1.59 | 0.885 |
| Q3 | 1.24 | 0.79–1.95 | 0.359 | 1.03 | 0.63–1.66 | 0.920 | 0.95 | 0.58–1.56 | 0.840 |
| Q4 | 2.66 | 1.78–3.96 | < 0.001 | 2.02 | 1.30–3.12 | 0.002 | 1.68 | 1.06–2.65 | 0.026 |
| P for trend | < 0.001 | < 0.001 | 0.005 | ||||||
| Diabetes or prediabetes with 51–85 years | |||||||||
| CHG index (continuous) | 1.00 | 0.92–1.10 | 0.929 | 1.21 | 1.09–1.33 | < 0.001 | 1.21 | 1.09–1.35 | < 0.001 |
| CHG index | |||||||||
| Q1 | 1 (reference) | 1 (reference) | 1 (reference) | ||||||
| Q2 | 0.80 | 0.71–0.90 | < 0.001 | 0.84 | 0.74–0.94 | 0.004 | 0.84 | 0.74–0.95 | 0.005 |
| Q3 | 0.77 | 0.68–0.86 | < 0.001 | 0.81 | 0.72–0.92 | < 0.001 | 0.82 | 0.72–0.93 | 0.002 |
| Q4 | 0.92 | 0.83–1.03 | 0.149 | 1.09 | 0.97–1.23 | 0.134 | 1.10 | 0.97–1.24 | 0.144 |
| P for trend | 0.209 | 0.139 | 0.125 | ||||||
| CV mortality | |||||||||
| Diabetes or prediabetes with 18–50 years | |||||||||
| CHG index (continuous) | 3.26 | 2.11–5.04 | < 0.001 | 2.81 | 1.76–4.49 | < 0.001 | 2.54 | 1.55–4.15 | < 0.001 |
| CHG index | |||||||||
| Q1 | 1 (reference) | 1 (reference) | 1 (reference) | ||||||
| Q2 | 1.72 | 0.58–5.13 | 0.332 | 1.48 | 0.49–4.45 | 0.485 | 1.23 | 0.40–3.81 | 0.723 |
| Q3 | 2.10 | 0.74–5.96 | 0.164 | 1.62 | 0.56–4.69 | 0.372 | 1.46 | 0.50–4.29 | 0.494 |
| Q4 | 4.77 | 1.84–12.3 | 0.001 | 3.45 | 1.29–9.22 | 0.013 | 2.69 | 0.98–7.36 | 0.054 |
| P for trend | < 0.001 | 0.003 | 0.015 | ||||||
| Diabetes or prediabetes with 51–85 years | |||||||||
| CHG index (continuous) | 1.09 | 0.93–1.27 | 0.281 | 1.41 | 1.19–1.67 | < 0.001 | 1.32 | 1.10–1.59 | 0.003 |
| CHG index | |||||||||
| Q1 | 1 (reference) | 1 (reference) | 1 (reference) | ||||||
| Q2 | 0.78 | 0.64, 0.95 | 0.013 | 0.80 | 0.65, 0.99 | 0.036 | 0.78 | 0.63, 0.97 | 0.028 |
| Q3 | 0.76 | 0.63, 0.93 | 0.006 | 0.83 | 0.67, 1.02 | 0.074 | 0.79 | 0.63, 0.98 | 0.031 |
| Q4 | 0.96 | 0.79, 1.15 | 0.634 | 1.20 | 0.98, 1.47 | 0.072 | 1.14 | 0.92, 1.41 | 0.221 |
| P for trend | 0.795 | 0.053 | 0.180 | ||||||
| Subgroup | N | HR (95% CI) | P value | P for interaction |
|---|---|---|---|---|
| CHG: cholesterol, high-density lipoprotein, and glucose; HR: hazard ratio; CI: confidence interval. | ||||
| Overall | 5,678 | 2.46 (1.94–3.12) | < 0.001 | |
| Age (years) | 0.054 | |||
| < 35 | 2,283 | 3.54 (2.05–6.09) | < 0.001 | |
| ≥ 35 | 3,395 | 1.94 (1.46–2.56) | < 0.001 | |
| Gender | 0.641 | |||
| Female | 2,380 | 2.66 (1.77–4.00) | < 0.001 | |
| Male | 3,298 | 2.34 (1.73–3.16) | < 0.001 | |
| Race | 0.75 | |||
| Mexican American | 1,321 | 2.89 (1.50–5.58) | 0.001 | |
| Non-Hispanic Black | 1,241 | 2.17 (1.42–3.32) | < 0.001 | |
| Non-Hispanic White | 1,955 | 2.90 (2.03–4.15) | < 0.001 | |
| Other race | 1,161 | 2.25 (1.01–4.99) | 0.047 | |
| Education level | 0.2 | |||
| Less than 9th grade | 525 | 1.26 (0.52–3.09) | 0.611 | |
| 9th–11th grade | 895 | 1.96 (1.21–3.18) | 0.006 | |
| High school graduate or equivalent | 1,244 | 3.24 (1.97–5.32) | < 0.001 | |
| Some college or above | 2,594 | 2.64 (1.75–3.97) | < 0.001 | |
| Cerebrovascular disease | 0.051 | |||
| No | 5,482 | 2.50 (1.93–3.24) | < 0.001 | |
| Yes | 196 | 1.23 (0.63–2.42) | 0.543 | |
| Smoking status | 0.206 | |||
| Current | 1,430 | 2.01 (1.41–2.87) | < 0.001 | |
| Former | 914 | 1.75 (0.93–3.31) | 0.082 | |
| Never | 3,040 | 3.15 (2.04–4.84) | < 0.001 | |
| Hypertension | 0.3 | |||
| No | 4,298 | 2.49 (1.79–3.45) | < 0.001 | |
| Yes | 1,357 | 1.91 (1.31–2.77) | 0.001 | |
| Alcohol consumption | 0.283 | |||
| Heavy | 319 | 0.88 (0.08–10.12) | 0.92 | |
| Moderate | 2,102 | 1.98 (1.30–3.03) | 0.001 | |
| Mild | 2,276 | 2.67 (1.88–3.80) | < 0.001 | |
| Never | 609 | 3.93 (2.12–7.28) | < 0.001 | |
| Subgroup | N | HR (95% CI) | P value | P for interaction |
|---|---|---|---|---|
| CHG: cholesterol, high-density lipoprotein, and glucose; HR: hazard ratio; CI: confidence interval. | ||||
| Overall | 5,678 | 3.26 (2.11–5.04) | < 0.001 | |
| Age (years) | 0.037 | |||
| < 35 | 2,283 | 6.57 (2.93–14.71) | < 0.001 | |
| ≥ 35 | 3,395 | 2.33 (1.36–3.99) | 0.002 | |
| Gender | 0.927 | |||
| Female | 2,380 | 3.02 (1.08–8.42) | 0.035 | |
| Male | 3,298 | 3.10 (1.89–5.10) | < 0.001 | |
| Race | 0.403 | |||
| Mexican American | 1,321 | 6.05 (2.14–17.06) | 0.001 | |
| Non-Hispanic Black | 1,241 | 2.33 (1.14–4.76) | 0.02 | |
| Non-Hispanic White | 1,955 | 4.13 (2.00–8.55) | < 0.001 | |
| Other race | 1,161 | 5.12 (1.09–24.09) | 0.039 | |
| Education level | 0.229 | |||
| Less than 9th grade | 525 | 1.76 (0.18–17.05) | 0.624 | |
| 9th–11th grade | 895 | 1.68 (0.67–4.22) | 0.27 | |
| High school graduate or equivalent | 1,244 | 5.26 (2.21–12.50) | < 0.001 | |
| Some college or above | 2,594 | 4.05 (2.08–7.88) | < 0.001 | |
| Cerebrovascular disease | 0.082 | |||
| No | 5,482 | 3.53 (2.19–5.69) | < 0.001 | |
| Yes | 196 | 1.23 (0.40–3.73) | 0.718 | |
| Smoking status | 0.249 | |||
| Current | 1,430 | 2.36 (1.16–4.83) | 0.018 | |
| Former | 914 | 1.93 (0.54–6.89) | 0.309 | |
| Never | 3,040 | 4.76 (2.47–9.14) | < 0.001 | |
| Hypertension | 0.096 | |||
| No | 4,298 | 4.14 (2.34–7.34) | < 0.001 | |
| Yes | 1,357 | 1.91 (0.94–3.88) | 0.072 | |
| Alcohol consumption | 0.725 | |||
| Moderate/heavy | 2,421 | 2.58 (1.23–5.44) | 0.013 | |
| Mild | 2,276 | 3.66 (1.84–7.27) | < 0.001 | |
| Never | 609 | 3.77 (1.44–9.81) | 0.007 | |