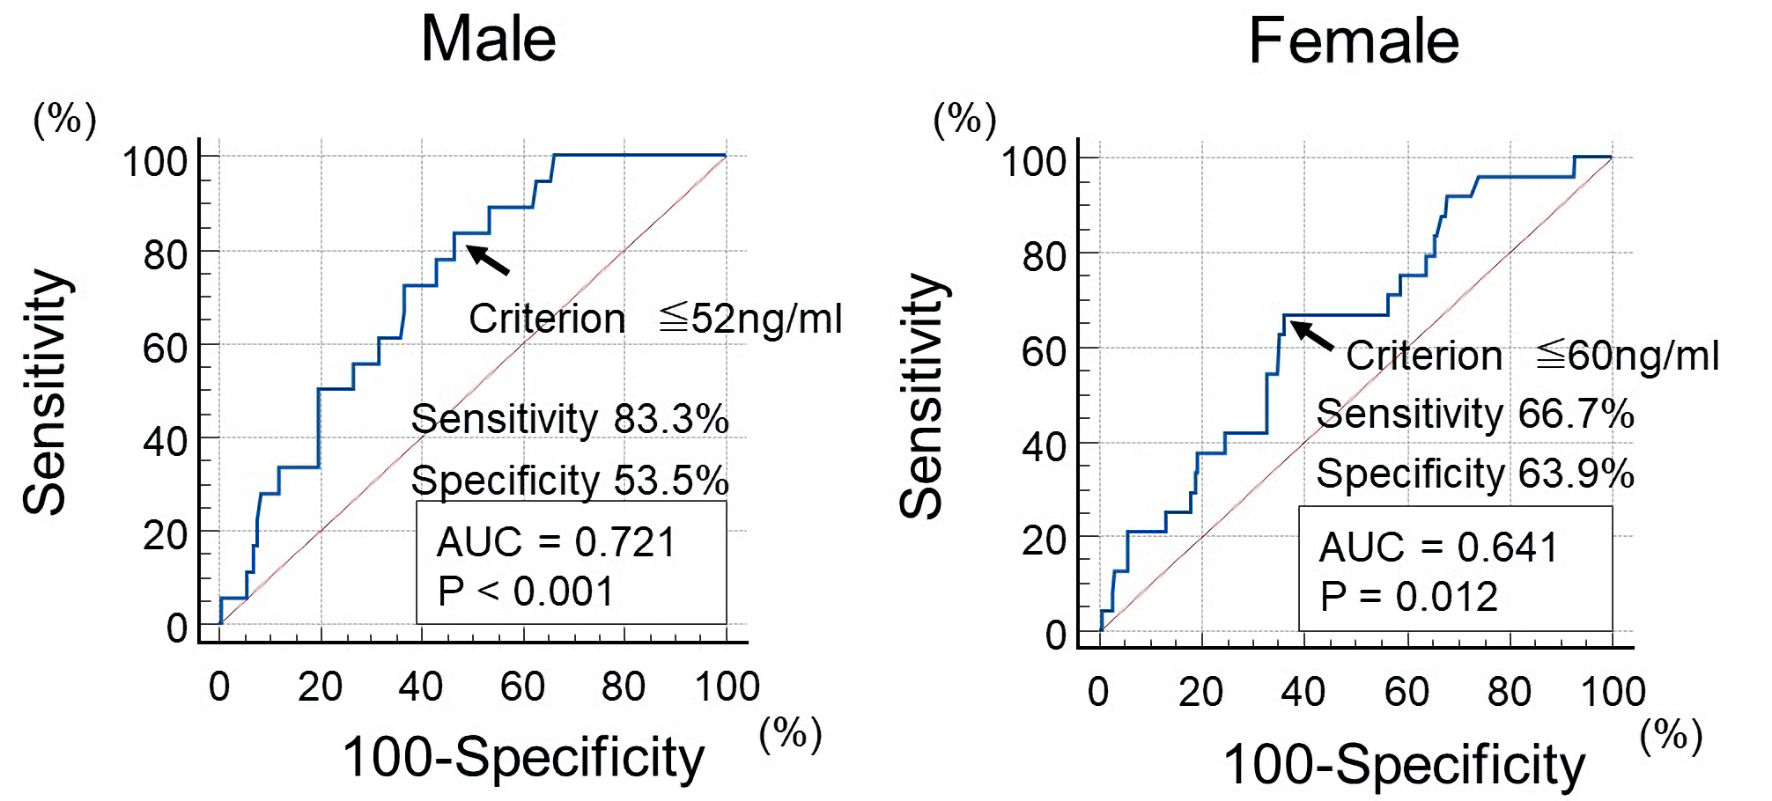
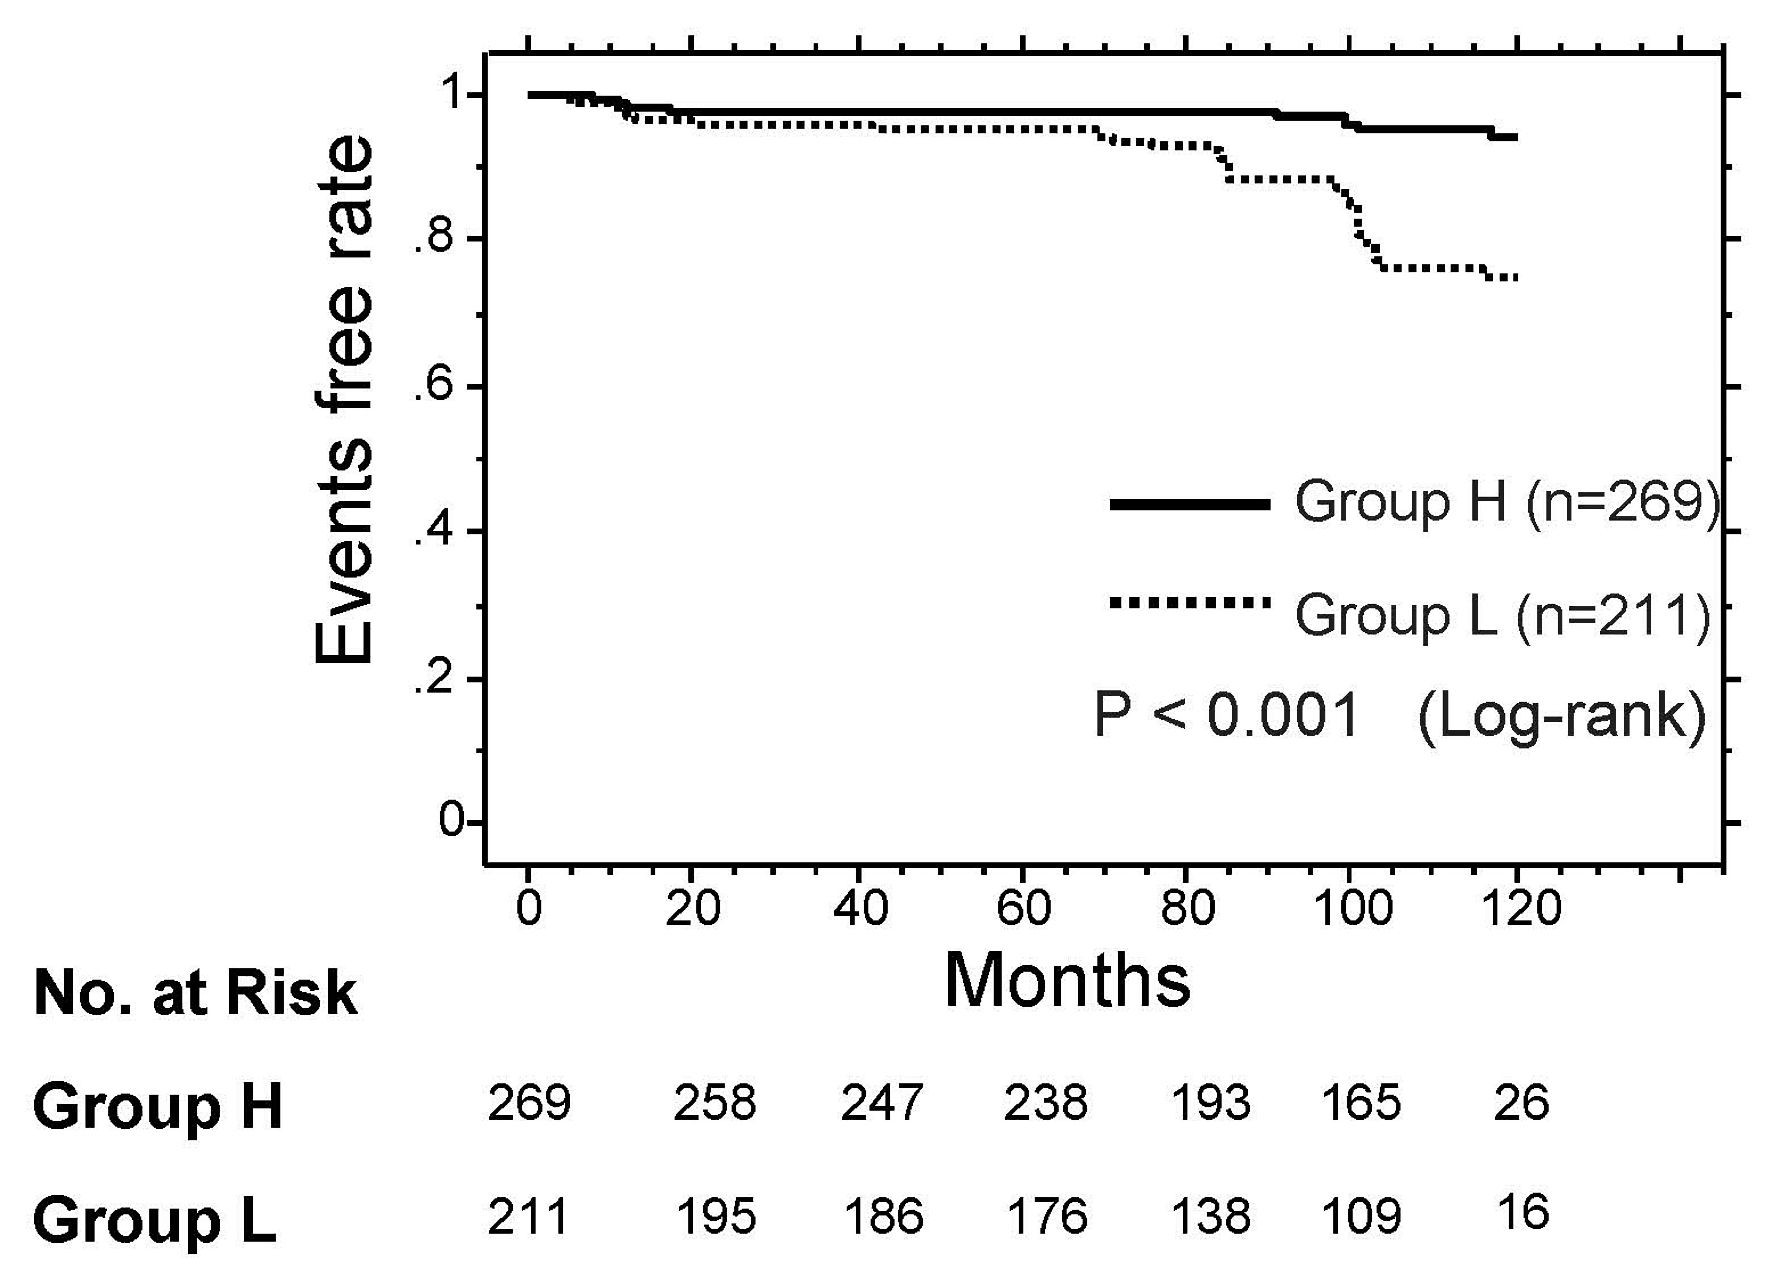
Cardiology Research, ISSN 1923-2829 print, 1923-2837 online, Open Access
Article copyright, the authors; Journal compilation copyright, Cardiol Res and Elmer Press Inc
Journal website https://cr.elmerpub.com

Original Article

Volume 17, Number 1, February 2026, pages 1-9


Preheparin Serum Lipoprotein Lipase Mass as a Coronary Risk Factor in Patients With Chronic Kidney Disease

Figures

Figure 1.
Figure 1. The optimal cut-off value of pre-LpL mass for initial CAD event using ROC curve analysis. Using ROC curve analysis, participants were divided into two groups (low pre-LpL mass (group L) or high pre-LpL mass (group H)) by pre-LpL mass (cut-off value: 52 ng/mL for men, 60 ng/mL for women). The arrows indicate the optimal cut-off point value. CAD: coronary artery disease, pre-LpL mass: preheparin serum lipoprotein lipase mass; ROC: receiver operating characteristic; AUC: area under the curve.
Figure 2.
Figure 2. Kaplan–Meier curve analysis for the incidence of CAD event. During the observation period, group L (low pre-LpL mass) had a significantly higher incidence of a CAD event than group H (high pre-LpL mass, P < 0.001, log-rank test). CAD: coronary artery disease; pre-LpL mass: preheparin serum lipoprotein lipase mass.

Tables

Table 1. Clinical Characteristics of the Studied Groups
 
CharacteristicsOverallGroup HGroup LP value
Continuous values are presented as mean ± SD or median (25th–75th percentile). LpL: lipoprotein lipase; BMI: body mass index; SBP: systolic blood pressure; DBP: diastolic blood pressure; eGFR: estimated glomerular filtration rate; LDL: low-density lipoprotein; HDL: high-density lipoprotein; FBG: fasting blood glucose; hs-CRP: high-sensitivity C-reactive protein; TyG: triglyceride-glucose; AF: autofluorescence; AU: arbitrary unit; RAS: renin-angiotensin system.
N (male/female)480 (160/320)269 (75/194)211 (85/126)0.004
Age (years)75 ± 1275 ± 1276 ± 120.582
Serum LpL (ng/mL)61 ± 1773 ± 1246 ± 8< 0.001
Risk factors
  BMI (kg/m2)23.1 ± 3.623.1 ± 3.523.1 ± 3.60.876
  Smoker, n (%)83 (17)36 (13)47 (22)0.011
  Hypertension, n (%)338 (70)190 (71)148 (70)0.907
  SBP (mm Hg)137 ± 15137 ± 15137 ± 160.971
  DBP (mm Hg)84 ± 1184 ± 1185 ± 110.663
  Dyslipidemia, n (%)334 (70)189 (70)145 (69)0.717
  Diabetes mellitus, n (%)162 (34)76 (28)86 (41)0.004
Clinical parameters
  eGFR (mL/min/1.73 m2)47 ± 947 ± 946 ± 90.075
  LDL cholesterol (mg/dL)134 ± 35132 ± 32138 ± 380.113
  Triglyceride (mg/dL)130 ± 66120 ± 63143 ± 680.001
  HDL cholesterol (mg/dL)59 ± 1563 ± 1554 ± 13< 0.001
  Non-HDL cholesterol (mg/dL)160 ± 37156 ± 33166 ± 410.004
  FBG (mg/dL)112 ± 22109 ± 21116 ± 230.007
  hs-CRP (mg/L)0.6 (0.2–1.2)0.5 (0.1–0.8)0.9 (0.4–1.7)< 0.001
  TyG index8.8 ± 0.58.6 ± 0.68.9 ± 0.5< 0.001
  Albuminuria, n (%)148 (31)72 (27)76 (36)0.029
  Skin AF (AU)2.8 ± 0.52.6 ± 0.52.9 ± 0.50.001
Medication
  RAS inhibitor, n (%)217 (45)133 (49)84 (40)0.035
  Statin, n (%)199 (42)123 (46)76 (36)0.032


Table 2. Characteristics at Registration of Patients With and Without CAD Event
 
CharacteristicsCAD event (–)CAD event (+)P value
Continuous values are presented as mean ± SD or median (25th–75th percentile). CAD: coronary artery disease; BMI: body mass index; SBP: systolic blood pressure; DBP: diastolic blood pressure; eGFR: estimated glomerular filtration rate; LDL: low-density lipoprotein; HDL: high-density lipoprotein; FBG: fasting blood glucose; hs-CRP: high sensitivity C reactive protein; TyG: triglyceride-glucose; AF: autofluorescence; AU: arbitrary unit; RAS: renin-angiotensin system.
N (male/female)438 (142/296)42 (18/24)0.171
Age (years)75 ± 1280 ± 100.009
BMI (kg/m2)23.1 ± 3.523.3 ± 4.10.697
Smoker, n (%)74 (17)9 (21)0.459
Hypertension, n (%)306 (70)32 (76)0.392
SBP (mm Hg)137 ± 16141 ± 120.112
DBP (mm Hg)85 ± 1183 ± 110.382
Dyslipidemia, n (%)307 (70)27 (64)0.436
Diabetes mellitus, n (%)140 (30)22 (52)0.007
eGFR (mL/min/1.73 m2)47 ± 940 ± 9< 0.001
LDL cholesterol (mg/dL)133 ± 35144 ± 360.059
Triglyceride (mg/dL)128 ± 68152 ± 440.026
HDL cholesterol (mg/dL)59 ± 1558 ± 110.528
Non-HDL cholesterol (mg/dL)159 ± 37174 ± 380.011
FBG (mg/dL)112 ± 21116 ± 250.307
hs-CRP (mg/L)0.6 (0.2–1.2)1.2 (0.5–1.3)< 0.001
TyG index8.7 ± 0.59.0 ± 0.3< 0.001
Albuminuria n (%)129 (30)19 (45)0.034
Skin AF (AU)2.7 ± 0.53.1 ± 0.5< 0.001
RAS inhibitor, n (%)205 (47)12 (29)0.023
Statin, n (%)191 (44)8 (19)0.002


Table 3. Multivariate Cox Regression Analysis for CAD Event
 
VariableHR95% CIP value
CAD: coronary artery disease; HR: hazard ratio; CI: confidence interval; AF: autofluorescence; AU: arbitrary unit; hs-CRP: high-sensitivity C-reactive protein; eGFR: estimated glomerular filtration rate.
Skin AF (≥ 2.8 AU)2.961.53–5.750.001
Group L (vs. group H)2.81.39–5.640.003
Age (≥ 80 years)2.451.35–3.910.004
hs-CRP (≥ 1 mg/L)2.171.19–3.170.011
eGFR (≤ 46)2.110.88–5.040.092