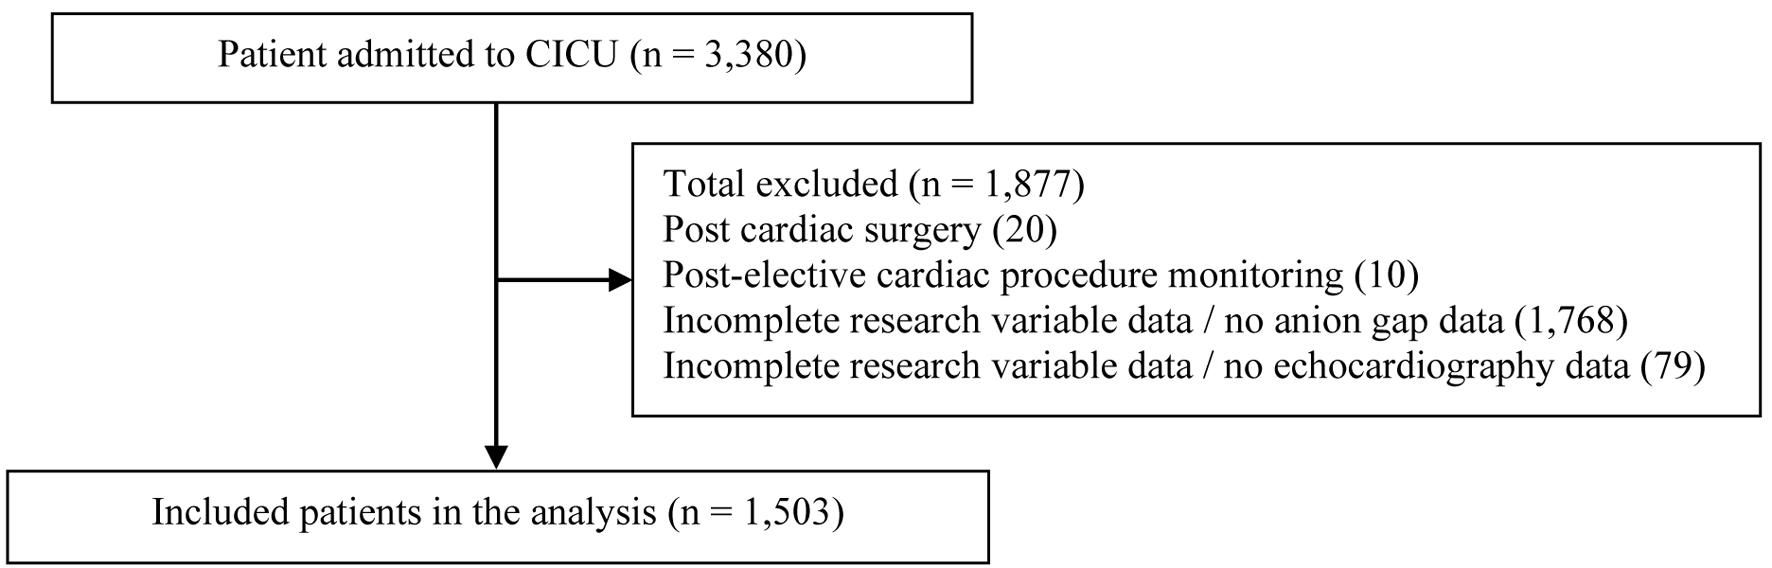
↓ Figure 1. Flow diagram demonstrating inclusion and exclusion criteria. Most of subjects were excluded due to incomplete data of anion gap. CICU: cardiovascular intensive care unit.
| Cardiology Research, ISSN 1923-2829 print, 1923-2837 online, Open Access |
| Article copyright, the authors; Journal compilation copyright, Cardiol Res and Elmer Press Inc |
| Journal website https://cr.elmerpub.com |
Original Article
Volume 17, Number 3, June 2026, pages 170-180
Sardjito Cardiovascular Intensive Care Score as an Alternative to Mayo Cardiac Admission Risk Score for Predicting Mortality in Cardiovascular Intensive Care Patients
Figures
Tables
| Variable | Total (n = 1,503) | CICU mortality | P value | In-hospital mortality | P value | ||
|---|---|---|---|---|---|---|---|
| Yes (n = 474) | No (n = 1,029) | Yes (n = 566) | No (n = 937) | ||||
| *Statistically significant difference (P < 0.05). BUN: blood urea nitrogen; CICU: cardiovascular intensive care unit; LVEF: left ventricle ejection fraction; M-CARS: Mayo Cardiac Admission Risk Score; RDW: red cell distribution width; SCAI: Society for Cardiovascular Angiography and Interventions; SCIENCE: Sardjito Cardiovascular Intensive Care; TAPSE: tricuspid annular plane systolic excursion. | |||||||
| Gender | 0.033* | 0.057 | |||||
| Men, n (%) | 993 (66.1%) | 295 (62.2%) | 698 (67.8%) | 357 (63.1%) | 636 (67.9%) | ||
| Women, n (%) | 510 (33.9%) | 9 (37.8%) | 331 (32.2%) | 209 (36.9%) | 301 (32.1%) | ||
| Age (median) | 62 (18–99) | 0.444 | 63 (20–94) | 61 (18–99) | 0.031* | ||
| ≥ 60 years | 879 (58.5%) | 284 (59.9%) | 595 (57.8%) | 351 (62%) | 528 (56.4%) | ||
| < 60 years | 624 (41.5%) | 190 (40.1%) | 434 (42.2%) | 215 (38%) | 409 (43.6%) | ||
| Admission diagnosis | |||||||
| Acute heart failure, n (%) | 623 (41.5%) | 206 (43.5%) | 417 (40.5%) | 0.283 | 252 (44.5%) | 371 (39.6%) | 0.06 |
| Shock/hemodynamic instability, n (%) | 642 (42.7%) | 322 (67.9%) | 320 (31.1%) | 0.001* | 366 (64.7%) | 276 (29.5%) | 0.001* |
| Acute coronary syndrome, n (%) | 999 (66.4%) | 307 (64.5%) | 692 (67.2%) | 0.346 | 352 (62%) | 647 (69%) | 0.06 |
| STEMI | 708 (70.9%) | 222 (72.3%) | 486 (70.2%) | 246 (69.9%) | 462 (71.4%) | ||
| NSTEMI | 273 (27.3%) | 83 (27%) | 190 (27.5%) | 103 (29.3%) | 170 (26.3%) | ||
| UAP | 18 (1.8%) | 2 (0.7%) | 16 (2.3%) | 3 (0.9%) | 15 (2.3%) | ||
| Arrhythmia, n (%) | 352 (23.4%) | 108 (22.8%) | 244 (23.7%) | 0.693 | 127 (22.4%) | 225 (44.5%) | 0.486 |
| Vascular emergency, n (%) | 61 (4.1%) | 24 (5.1%) | 37 (3.6%) | 0.180 | 30 (5.3%) | 31 (3.3%) | 0.058 |
| Cardiac arrest, n (%) | 203 (13.5%) | 103 (21.7%) | 100 (9.7%) | 0.001* | 112 (19.8%) | 91 (9.7%) | 0.001* |
| Comorbid | |||||||
| Respiratory failure, n (%) | 422 (28.1%) | 258 (54.4%) | 164 (15.9%) | 0.001* | 286 (50.5%) | 136 (14.5%) | 0.001* |
| Pneumonia, n (%) | 358 (23.8%) | 136 (28.7%) | 807 (78.4%) | 0.003* | 166 (29.3%) | 192 (20.5%) | 0.001* |
| Urinary tract infection, n (%) | 157 (10.4% | 56 (11.8%) | 101 (9.8%) | 0.239 | 71 (12.5%) | 86 (9.2%) | 0.039 |
| Renal chronic disease, n (%) | 60 (4%) | 17 (3.6%) | 43 (4.2%) | 0.586 | 25 (4.1%) | 37 (3.8%) | 0.702 |
| Sepsis, n (%) | 52 (3.3%) | 26 (5.5%) | 22 (2.1%) | 0.001* | 31 (5.5%) | 17 (1.8%) | 0.001* |
| Acute non-hemorrhagic stroke, n (%) | 84 (5.6%) | 37 (7.8%) | 47 (4.6%) | 0.011* | 47 (8.3%) | 37 (3.9%) | 0.001* |
| Hemorrhagic stroke, n (%) | 4 (0.3%) | 4 (0.8%) | 0 (0%) | 0.010* | 4 (0.7%) | 0 (0%) | 0.020* |
| Invasive ventilation usage, n (%) | 384 (25.5%) | 264 (55.7%) | 120 (11.7%) | 0.001* | 287 (50.7%) | 97 (10.4%) | 0.001* |
| Non-invasive ventilation usage, n (%) | 61 (4.1%) | 23 (4.9%) | 38 (3.7%) | 0.290 | 28 (4.9%) | 33 (3.5%) | 0.175 |
| Echocardiography | |||||||
| LVEF | 0.001* | 0.001* | |||||
| ≤ 40% | 699 (46.5%) | 261 (55.1%) | 438 (42.6%) | 298 (52.7%) | 401 (42.8%) | ||
| 41–49% | 262 (17.4%) | 77 (16.2%) | 185 (18%) | 174 (18.6%) | 262 (17.4%) | ||
| ≥ 50% | 542 (36.1%) | 136 (28.7%) | 406 (39.5%) | 180 (31.8%) | 362 (38.6%) | ||
| TAPSE | 0.001* | 0.001* | |||||
| < 17 mm | 588 (39.1%) | 240 (50.6%) | 348 (33.8%) | 270 (47.7%) | 318 (33.9%) | ||
| ≥ 17 mm | 915 (60.9%) | 234 (49.4%) | 681 (66.2%) | 296 (52.3%) | 619 (66.1%) | ||
| Laboratory | |||||||
| Creatinine (mg/dL) | 0.001* | 0.001* | |||||
| ≥ 1.5 mg/dL | 810 (53.9%) | 340 (71.7%) | 470 (45.7%) | 401 (70.8%) | 409 (43.6%) | ||
| < 1.5 mg/dL | 693 (46.1%) | 134 (28.3%) | 559 (54.3%) | 165 (29.2%) | 528 (56.4%) | ||
| BUN (mg/dL) | 0.001* | 0.001* | |||||
| > 23 mg/dL | 856 (57%) | 349 (73.6%) | 507 (49.3%) | 418 (73.9%) | 438 (46.7%) | ||
| ≤ 23 mg/dL | 647 (43%) | 125 (26.4%) | 522 (50.7%) | 148 (26.1%) | 499 (53.3%) | ||
| RDW (%) | 0.001* | 0.001* | |||||
| > 14.3 | 556 (37%) | 208 (43.9%) | 348 (33.8%) | 260 (45.9%) | 296 (31.6%) | ||
| ≤ 14.3 | 947 (63%) | 266 (56.1%) | 681 (66.2%) | 306 (54.1%) | 641 (68.4%) | ||
| Anion gap | 0.001* | 0.001* | |||||
| > 14 | 835 (55.6%) | 350 (73.8%) | 485 (47.1%) | 435 (46.4%) | |||
| ≤ 14 | 668 (44.4%) | 124 (26.2%) | 544 (52.9%) | 502 (53.6%) | |||
| Lactate (median) | 2.2 (0.32–19) | 3.25 (0.32–19.4) | 1.93 (0.33–19.4) | 0.001* | 1.9 (0.33–19) | 0.001* | |
| Others | |||||||
| The use of circulatory support device/intra-aortic balloon pump, n (%) | 17 (1.1%) | 9 (1.9%) | 8 (0.8%) | 0.056 | 10 (1.8%) | 7 (0.7%) | 0.070 |
| Renal replacement therapy, n (%) | 73 (4.9%) | 38 (8%) | 35 (3.4%) | 0.001* | 47 (8.3%) | 26 (2.8%) | 0.001* |
| Braden skin score | 0.001* | 0.001* | |||||
| ≤ 12 | 350 (23.3%) | 244 (51.5%) | 106 (10.3%) | 271 (47.9%) | 79 (8.4%) | ||
| 13–15 | 507 (33.7%) | 199 (25.1%) | 388 (37.7%) | 147 (26%) | 360 (38.4%) | ||
| > 15 | 646 (43%) | 111 (23.4%) | 535 (52%) | 148 (26.1%) | 498 (53.1%) | ||
| SCIENCE score | 0.001* | 0.001* | |||||
| High risk (≥ 3) | 858 (57.1%) | 393 (82.9%) | 465 (45.2%) | 455 (80.4%) | 403 (43%) | ||
| Low risk (< 3) | 645 (42.9%) | 81 (17.1%) | 564 (54.8%) | 111 (19.6%) | 534 (57%) | ||
| M-CARS score | 0.001* | 0.001* | |||||
| High risk (≥ 4) | 715 (47.6%) | 376 (79.3%) | 339 (32.9%) | 432 (76.3%) | 283 (30.2%) | ||
| Low risk (< 4) | 788 (52.4%) | 98 (20.7%) | 690 (67.1%) | 134 (23.7%) | 654 (69.8%) | ||
| Outcomes | |||||||
| CICU mortality | 474 (31.5%) | ||||||
| Hospital mortality | 566 (37.7%) | ||||||
| Score category | Death | Alive | Sn (%) | Sp (%) | PPV (%) | NPV (%) | Accuracy (%) | ||
|---|---|---|---|---|---|---|---|---|---|
| CICU: cardiovascular intensive care unit; M-CARS: Mayo Cardiac Admission Risk Score; NPV: negative predictive value; PPV: positive predictive value; SCIENCE score: Sardjito Cardiovascular Intensive Care score; Sn: sensitivity; Sp: specificity. | |||||||||
| CICU outcomes | M-CARS | High risk (≥ 4) | 376 | 339 | 72.32 | 67.07 | 52.59 | 87.56 | 70.92 |
| Low risk (< 4) | 98 | 690 | |||||||
| SCIENCE | High risk (≥ 3) | 393 | 465 | 82.91 | 54.81 | 45.80 | 87.44 | 63.67 | |
| Low risk (< 3) | 81 | 564 | |||||||
| Hospital outcomes | M-CARS | High risk (≥ 4) | 432 | 283 | 76.33 | 69.80 | 60.42 | 82.99 | 72.26 |
| Low risk (< 4) | 134 | 654 | |||||||
| SCIENCE | High risk (≥ 3) | 455 | 403 | 80.39 | 56.99 | 53.03 | 82.79 | 65.80 | |
| Low risk (< 3) | 111 | 534 | |||||||
| Variable | AUC | P | 95% CI | ||
|---|---|---|---|---|---|
| Lower bound | Upper bound | ||||
| *Statistically significant difference (P < 0.05). AUC: area under the curve; CI: confidence interval; CICU: cardiovascular intensive care unit; M-CARS: Mayo Cardiac Admission Risk Score; SCIENCE score: Sardjito Cardiovascular Intensive Care score. | |||||
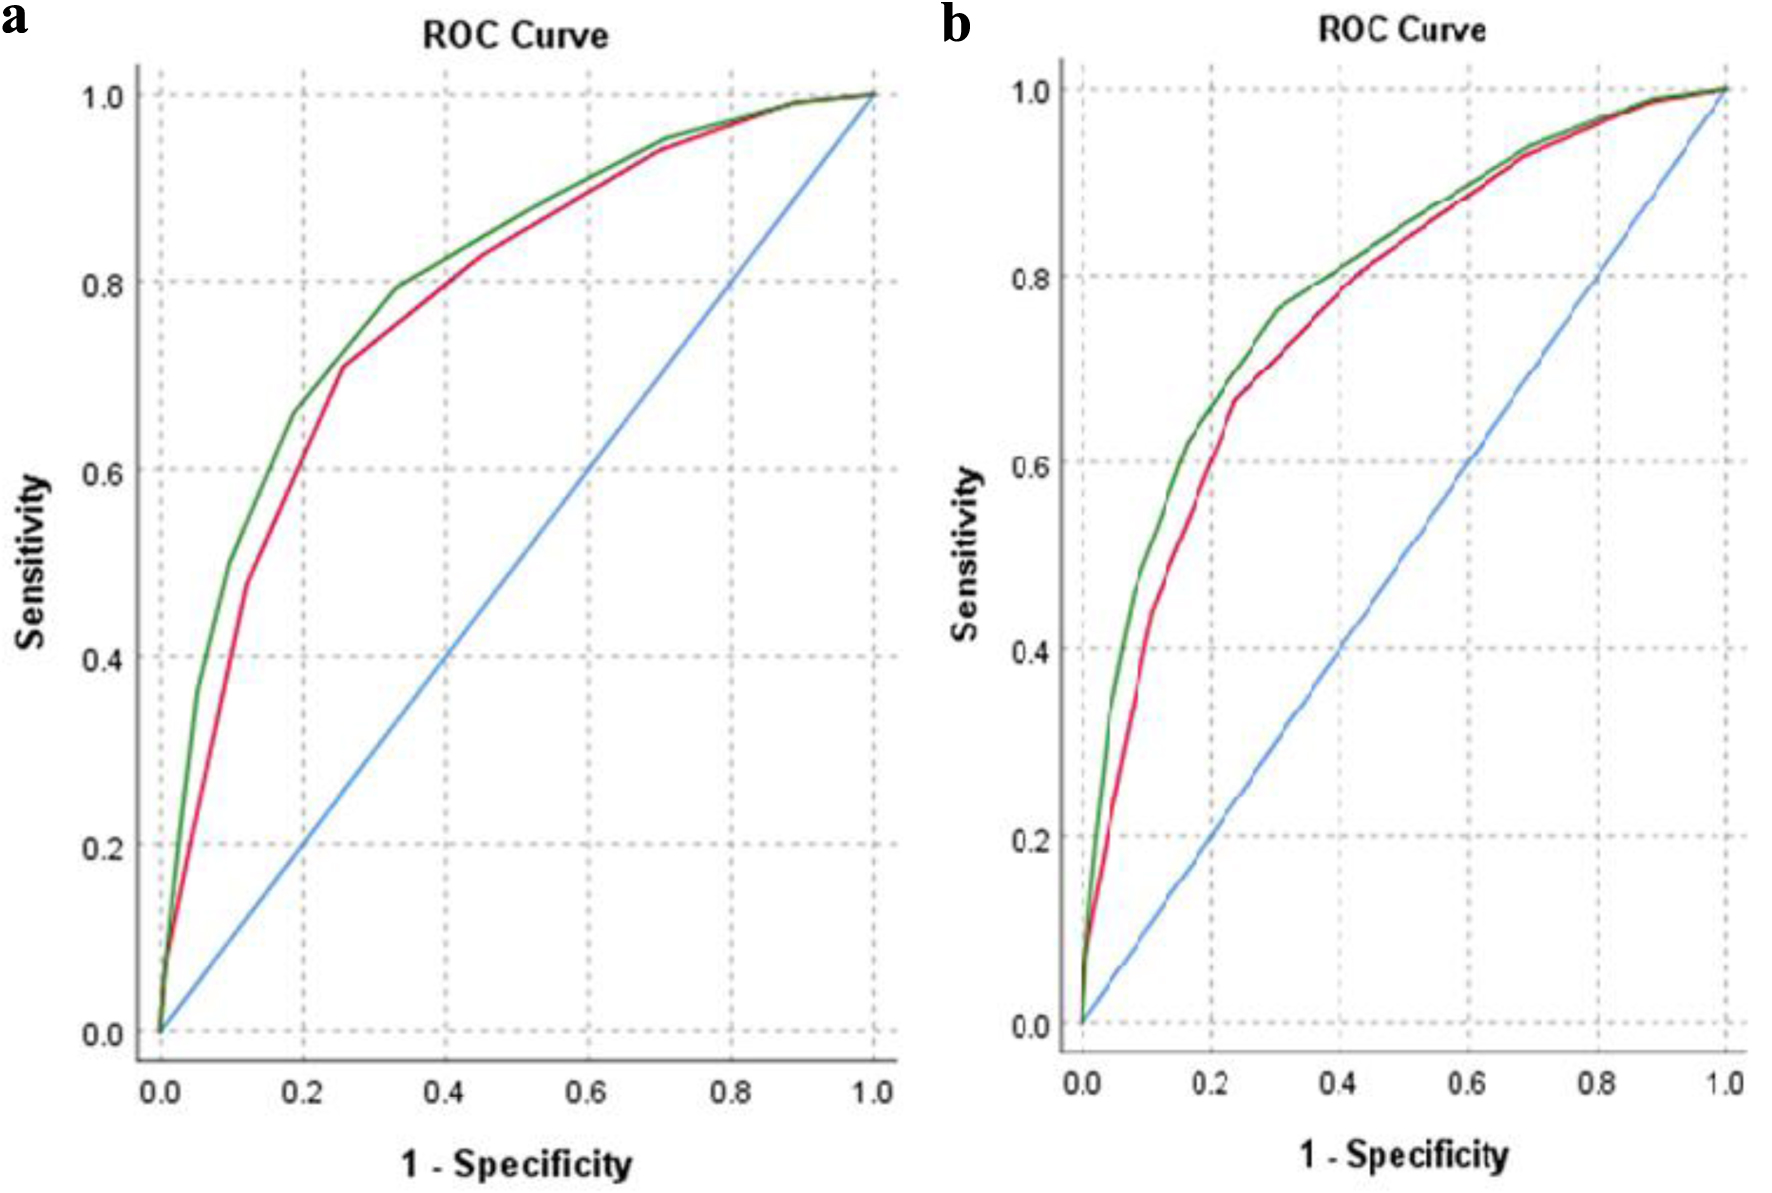
| CICU mortality | M-CARS | 0.804 | < 0.001* | 0.780 | 0.828 |
| SCIENCE | 0.775 | < 0.001* | 0.751 | 0.800 | |
| In-hospital mortality | M-CARS | 0.797 | < 0.001* | 0.773 | 0.820 |
| SCIENCE | 0.767 | < 0.001* | 0.742 | 0.791 | |