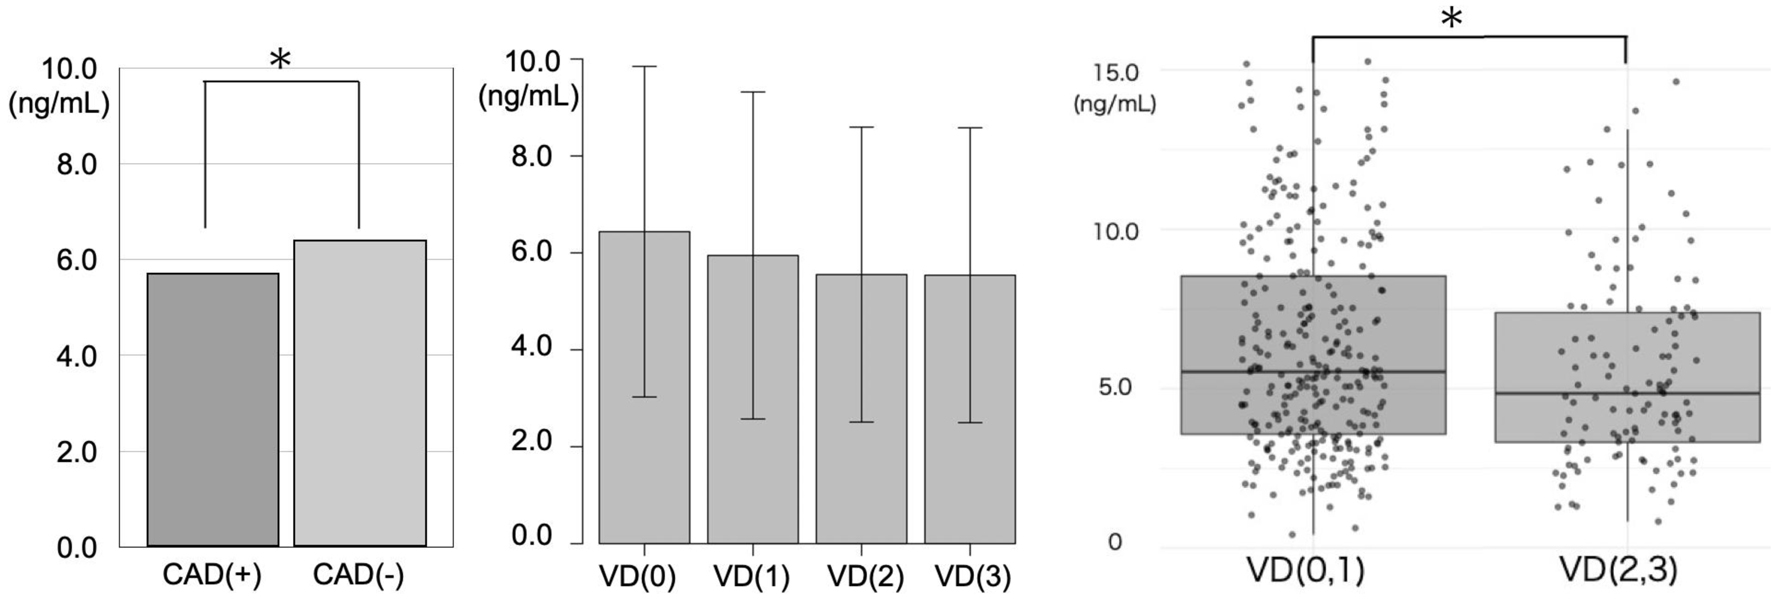
↓ Figure 1. BDNF profile at baseline for all patients in the CAD and non-CAD groups or in each the number of VD. *P < 0.05. BDNF: brain-derived neurotrophic factor; CAD: coronary artery disease; VD: the number of significant vessel diseases.
| Cardiology Research, ISSN 1923-2829 print, 1923-2837 online, Open Access |
| Article copyright, the authors; Journal compilation copyright, Cardiol Res and Elmer Press Inc |
| Journal website https://cr.elmerpub.com |
Original Article
Volume 17, Number 3, June 2026, pages 156-163
Association of Circulating Brain-Derived Neurotrophic Factor With Coronary Risk Factors and Coronary Artery Disease in Patients Who Have Undergone Coronary Computed Tomography Angiography
Figure
Tables
| Non-CAD group (n = 216) | CAD group (n = 186) | Non-CAD vs. CAD group, P-value | |
|---|---|---|---|
| Continuous variables are expressed as mean ± SD. Significance level was set at P < 0.05. α-GI: α-glucosidase inhibitor; ACEi/ARB: angiotensin-converting-enzyme inhibitor/angiotensin II receptor blocker; ASO: arteriosclerosis obliterans; BDNF: brain-derived neurotrophic factor; CAC: coronary artery calcification; CAD: coronary artery disease; CCB: calcium channel blocker; DU: diuretic; EF: ejection fraction; eGFR: estimated glomerular filtration rate; EPA: eicosapentaenoic acid; FBG: fasting blood glucose; Hb: hemoglobin; HbA1c: hemoglobin A1c; HDL-C: high-density lipoprotein cholesterol; hs-CRP: high-sensitivity C-reactive protein; LDL-C: low-density lipoprotein cholesterol; LVMI: left ventricular mass index; Plt: platelet; PWV: pulse wave velocity; SU: sulfonylurea; TC: total cholesterol; TG: triglyceride. | |||
| Age (years) | 63 ± 14 | 69 ± 10 | < 0.001 |
| Gender (male) (%) | 40.7 | 60.2 | < 0.001 |
| Body mass index (kg/m2) | 23.6 ± 3.9 | 23.9 ± 3.9 | 0.419 |
| Family history of CAD (%) | 20.8 | 18.3 | 0.532 |
| Smoking (%) | 27.8 | 38.2 | 0.033 |
| Hypertension (%) | 60.7 | 58.6 | 0.685 |
| Diabetes mellitus (%) | 21.3 | 33.5 | 0.005 |
| HbA1c (%) | 5.9 ± 0.7 | 6.1 ± 0.8 | 0.005 |
| FBG (mg/dL) | 105 ± 33 | 113 ± 31 | 0.025 |
| Dyslipidemia (%) | 63.4 | 75 | 0.023 |
| TG (mg/dL) | 133 ± 123 | 136 ± 104 | 0.832 |
| HDL-C (mg/dL) | 61 ± 16 | 57 ± 16 | 0.005 |
| LDL-C (mg/dL) | 118 ± 33 | 114 ± 34 | 0.347 |
| TC (mg/dL) | 208 ± 38 | 202 ± 40 | 0.125 |
| Hb (g/dL) | 13.8 ± 1.5 | 14.0 ± 1.6 | 0.273 |
| Plt (103/µL) | 237.2 ± 57.8 | 202.6 ± 52.1 | 0.03 |
| hs-CRP | 0.14 ± 0.43 | 0.14 ± 0.32 | 0.869 |
| BDNF (ng/mL) | 6.41 ± 3.42 | 5.73 ± 3.16 | 0.039 |
| Chronic kidney disease (%) | 26.8 | 26.9 | 1 |
| eGFR (mL/min/1.73 m2) | 70 ± 14.2 | 66 ± 14.8 | 0.002 |
| Metabolic syndrome (%) | 24.1 | 34.9 | 0.052 |
| EF (%) | 65.9 ± 7.3 | 63.2 ± 9.6 | 0.002 |
| LVMI (g/m2) | 61.2 ± 18.1 | 68.2 ± 22.2 | < 0.001 |
| ASO (%) | 3.2 | 7 | 0.108 |
| Lt. PWV | 1510 ± 318 | 1698 ± 379 | < 0.001 |
| CAC score | 38 ±162 | 458 ±773 | < 0.001 |
| Medications | |||
| ACEi/ARB (%) | 28.7 | 38.7 | 0.044 |
| CCB (%) | 31.5 | 48.9 | < 0.001 |
| β-blocker (%) | 5.6 | 10.8 | 0.065 |
| DU (%) | 5.1 | 8.1 | 0.309 |
| Statin (%) | 24.1 | 37.1 | 0.006 |
| EPA (%) | 4.2 | 1.6 | 0.154 |
| SU (%) | 2.8 | 8.6 | 0.014 |
| α-GI (%) | 1.9 | 2.2 | 1 |
| Biguanide (%) | 5.6 | 5.9 | 1 |
| Variables | Estimate | 95% CI | P-value |
|---|---|---|---|
| Significance level was set at P < 0.05. BDNF: brain-derived neurotrophic factor; CAC: coronary artery calcification; CAD: coronary artery disease; CI: confidence interval; hs-CRP: high-sensitivity C-reactive protein; Lt. PWV: left pulse wave velocity; Plt: platelet. | |||
| Plt | 0.027 | 0.021–0.032 | < 0.001 |
| Hypertension | 0.567 | −0.043 to 1.178 | 0.069 |
| Family history | 0.58 | −0.175 to 1.335 | 0.132 |
| Smoking | 0.507 | −0.185 to 1.199 | 0.15 |
| Chronic kidney disease | 0.489 | −0.193 to 1.170 | 0.159 |
| Age | −0.01 | −0.042 to 0.021 | 0.518 |
| Male | −0.217 | −0.982 to 0.549 | 0.578 |
| Dyslipidemia | −0.145 | −0.805 to 0.515 | 0.667 |
| Lt. PWV | 0 | −0.001 to 0.001 | 0.772 |
| Diabetes mellitus | −0.041 | −0.732 to 0.650 | 0.908 |
| CAC score | 0 | −0.001 to 0.001 | 0.926 |
| CAD | 0.051 | −1.121 to 1.223 | 0.932 |
| hs-CRP | 0.277 | −0.494 to 1.047 | 0.481 |
| Variables | OR | 95% CI | P-value |
|---|---|---|---|
| Significance level was set at P < 0.05. ACEi/ARB: angiotensin-converting-enzyme inhibitor/angiotensin II receptor blocker; BDNF: brain-derived neurotrophic factor; CAC: coronary artery calcification; CAD: coronary artery disease; CCB: calcium channel blocker; CI: confidence interval; EF: ejection fraction; Lt. PWV: left pulse wave velocity; OR: odds ratio; Plt: platelet; SU: sulfonylurea. | |||
| Age | 1.03 | 1.00–1.06 | 0.047 |
| Male | 1.34 | 0.73–2.46 | 0.348 |
| Smoking | 1.76 | 0.97–3.17 | 0.061 |
| Dyslipidemia | 1.61 | 0.91–2.84 | 0.1 |
| Diabetes mellitus | 1.18 | 0.65–2.13 | 0.584 |
| Lt. PWV | 1 | 1.00–1.00 | 0.242 |
| EF | 0.97 | 0.93–1.00 | 0.038 |
| CAC score | 1.01 | 1.01–1.01 | < 0.001 |
| BDNF | 0.97 | 0.90–1.05 | 0.436 |
| Plt | 1 | 0.99–1.01 | 0.938 |
| ACEi/ARB | 0.477 | 0.25 - 0.91 | 0.024 |
| CCB | 1.24 | 0.69–2.21 | 0.474 |
| Statin | 1.34 | 0.71–2.55 | 0.365 |
| SU | 1.39 | 0.34–5.78 | 0.649 |
| Added covariates | OR (95% CI) | Change-in-estimate (%) | P-value |
|---|---|---|---|
| Confounding was assessed using the change-in-estimate method. A variable was considered a confounder if its inclusion in the model changed the odds ratio of BDNF by more than 10%. Change-in-estimate (%) was computed using the exposure coefficient from logistic regression (β, i.e., log(odds ratio)) and reflects the percent change in β from the crude model after inclusion of each candidate covariate. Significance level was set at P < 0.05. BDNF: brain-derived neurotrophic factor; CAC: coronary artery calcium; CAD: coronary artery disease; CI: confidence interval; EF: ejection fraction; HbA1c: hemoglobin A1c; HDL-C: high-density lipoprotein cholesterol; Lt. PWV: left pulse wave velocity; OR: odds ratio; Plt: platelet. | |||
| Model 0 (unadjusted) | 0.938 (0.883–0.997) | 0.039 | |
| Model 0 + Plt | 0.976 (0.909–1.05) | 62.10% | 0.49 |
| Model 0 + age | 0.963 (0.902–1.03) | 42.30% | 0.257 |
| Model 0+ CAC score | 0.955 (0.887–1.03) | 30.10% | 0.224 |
| Model 0 + Lt. PWV | 0.948 (0.888–1.01) | 17.70% | 0.099 |
| Model 0 + HDL-C | 0.933 (0.875–0.99) | 6.90% | 0.03 |
| Model 0 + EF | 0.935 (0.877–0.99) | 3.10% | 0.037 |
| Model 0 + HbA1c | 0.937 (0.879–1.00) | 0.80% | 0.044 |
| Model | Added covariates | OR (95% CI) | P-value |
|---|---|---|---|
| Models were constructed using sequential adjustment. Covariates were added to the model in the order listed in the table. Significance level was set at P < 0.05. BDNF: brain-derived neurotrophic factor; CAC: coronary artery calcium; CAD: coronary artery disease; CI: confidence interval; Lt. PWV: left pulse wave velocity; OR: odds ratio; Plt: platelet. | |||
| Model 0 | Unadjusted | 0.938 (0.883–0.997) | 0.039 |
| Model 1 | Model 0 + Plt | 0.976 (0.909–1.044) | 0.457 |
| Model 2 | Model 1 + age | 0.982 (0.915–1.054) | 0.617 |
| Model 3 | Model 2 + CAC score | 0.982 (0.908–1.062) | 0.653 |
| Model 4 | Model 3 + Lt. PWV | 0.980 (0.906–1.061) | 0.624 |