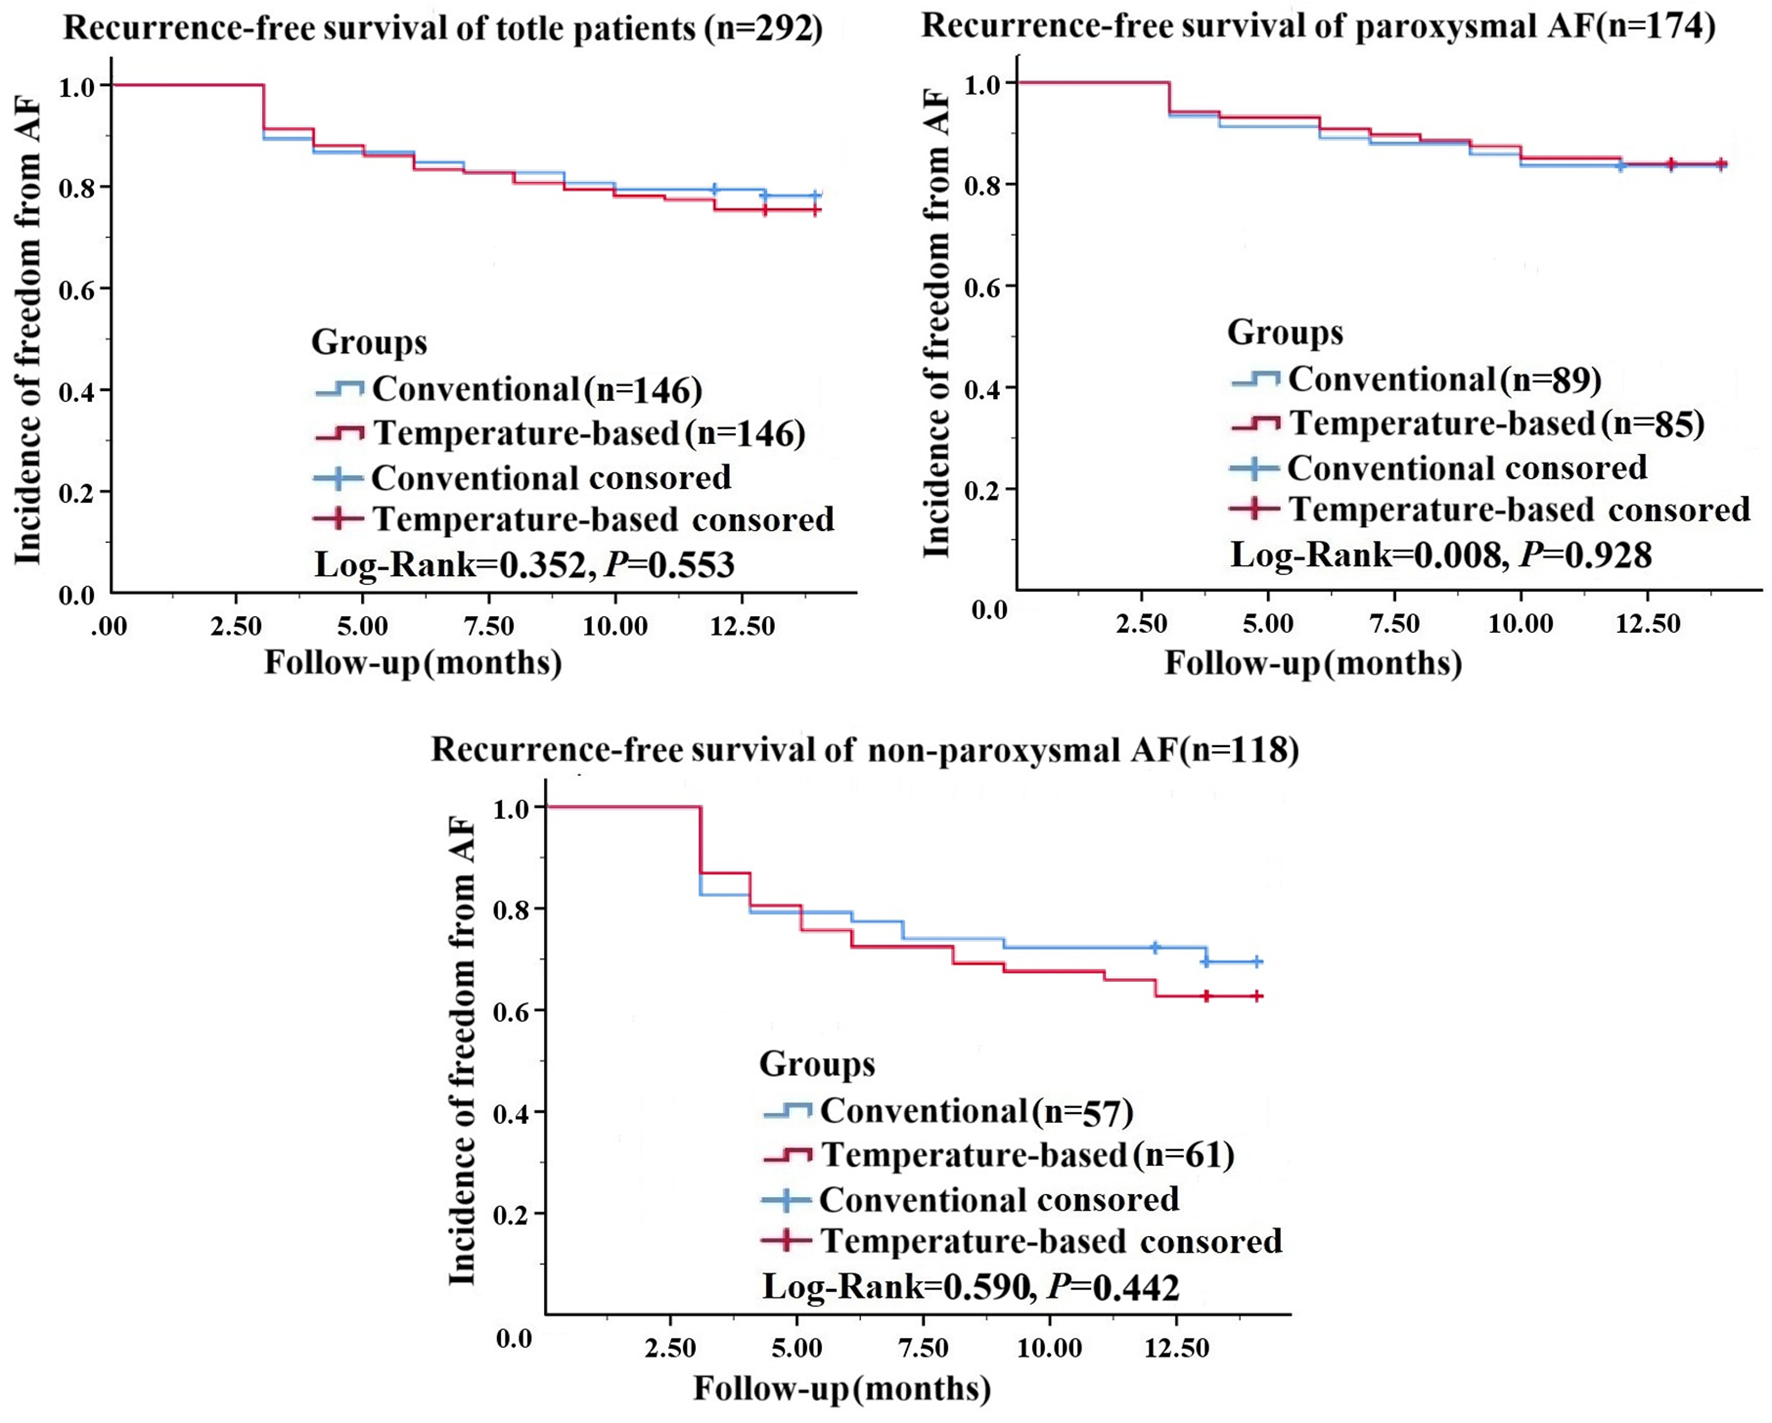
↓ Figure 1. Kaplan–Meier survival analysis of patients with sinus rhythm maintenance after procedure in the conventional time-to-isolation-guided protocol (conventional group) and single-freezing temperature-guided protocol (simplified group).
| Cardiology Research, ISSN 1923-2829 print, 1923-2837 online, Open Access |
| Article copyright, the authors; Journal compilation copyright, Cardiol Res and Elmer Press Inc |
| Journal website https://cr.elmerpub.com |
Original Article
Volume 17, Number 3, June 2026, pages 205-213
Comparison of Single-Freezing Temperature-Guided and Conventional Time-to-Isolation-Guided Protocols of Cryoballoon in Atrial Fibrillation Ablation
Figures
Tables
| Conventional group (n = 153) | Simplified group (n = 318) | P value | PSM conventional group (n = 146) | PSM simplified group (n = 146) | P value | |
|---|---|---|---|---|---|---|
| AF: atrial fibrillation; BMI: body mass index; CHD: coronary atherosclerotic heart disease; LA: left atrial; LVEF: left ventricular ejection fraction; PSM: propensity score matching; TIA: transient ischemic attack. | ||||||
| Gender (male/female) | 92/61 | 190/128 | 0.937 | 87/59 | 86/60 | 0.905 |
| Age (years) | 61.1 ± 11.1 | 61.8 ± 9.8 | 0.480 | 61.1 ± 11.3 | 60.8 ± 10.2 | 0.778 |
| Height (cm) | 167.1 ± 8.4 | 167.4 ± 8.3 | 0.761 | 167.1 ± 8.3 | 166.5 ± 8.0 | 0.576 |
| Weight (kg) | 69.5 ± 10.7 | 70.8 ± 11.1 | 0.234 | 69.7 ± 10.7 | 69.3 ± 11.0 | 0.732 |
| BMI (kg/m2) | 24.8 ± 2.9 | 25.2 ± 3.1 | 0.190 | 24.9 ± 2.9 | 24.9 ± 3.1 | 0.975 |
| Course of AF (months) | 48.7 ± 69.9 | 47.6 ± 56.4 | 0.190 | 49.7 ± 71.1 | 50.1 ± 63.5 | 0.382 |
| Paroxysmal AF | 94 (61.4%) | 189 (59.4%) | 0.677 | 89 (61.0%) | 85 (58.2%) | 0.633 |
| Basic diseases | ||||||
| Hypertension | 86 (56.2%) | 201 (63.2%) | 0.145 | 85 (58.2%) | 84 (57.5%) | 0.905 |
| CHD | 19 (12.4%) | 38 (11.9%) | 0.884 | 19 (13.0%) | 17 (11.6%) | 0.722 |
| Diabetes | 20 (13.1%) | 57 (17.9%) | 0.182 | 20 (13.7%) | 18 (12.3%) | 0.728 |
| Stock/TIA | 12 (7.8%) | 33 (10.4%) | 0.381 | 12 (8.2%) | 12 (8.2%) | 1.000 |
| Heart failure | 5 (3.3%) | 4 (1.3%) | 0.136 | 1 (0.7%) | 2 (1.4%) | 1.000 |
| LA diameter (mm) | 40.9 ± 5.6 | 40.6 ± 5.8 | 0.627 | 40.7 ± 5.5 | 40.4 ± 6.2 | 0.734 |
| LVEF (%) | 62.5 ± 3.6 | 62.9 ± 3.9 | 0.291 | 62.6 ± 3.6 | 62.9 ± 4.2 | 0.502 |
| CHA2DS2-VASc | 1.4 ± 1.0 | 1.5 ± 1.1 | 0.254 | 1.4 ± 1.0 | 1.4 ± 1.1 | 0.801 |
| Antiarrhythmic drugs | ||||||
| β-blocker | 139 (90.8%) | 300 (94.3%) | 0.159 | 134 (91.8%) | 140 (95.9%) | 0.144 |
| Amiodarone | 127 (83.0%) | 255 (80.2%) | 0.464 | 123 (84.2%) | 117 (80.1%) | 0.359 |
| Propafenone | 17 (11.1%) | 36 (11.3%) | 0.946 | 15 (10.3%) | 16 (11.0%) | 0.849 |
| PSM conventional group (n = 146) | PSM simplified group (n = 146) | P value | |
|---|---|---|---|
| LCPV: left common pulmonary vein; LIPV: left inferior pulmonary vein; LSPV: left superior pulmonary vein; PSM: propensity score matching; PV: pulmonary vein; RIPV: right superior pulmonary vein; RMPV: right middle pulmonary vein; RSPV: right inferior pulmonary vein. | |||
| Procedure time (min) | 98.7 ± 15.8 | 82.3 ± 12.5 | < 0.001 |
| Routine procedure time (min) | 36.8 ± 5.4 | 37.9 ± 6.5 | 0.125 |
| Freezing procedure time (min) | 61.8 ± 16.4 | 44.4 ± 12.9 | < 0.001 |
| Total X-ray time (min) | 24.2 ± 6.8 | 18.8 ± 5.4 | < 0.001 |
| Routine procedure X-ray time (min) | 7.7 ± 2.0 | 7.7 ± 1.9 | 0.854 |
| Freezing procedure X-ray time (min) | 16.5 ± 6.3 | 11.1 ± 5.2 | < 0.001 |
| Total X-ray dose (mGy) | 676.4 ± 333.0 | 539.6 ± 387.3 | < 0.001 |
| Routine procedure X-ray dose (mGy) | 160.4 ± 70.6 | 177.9 ± 84.3 | 0.098 |
| Freezing procedure X-ray dose (mGy) | 516.0 ± 281.3 | 361.7 ± 341.7 | < 0.001 |
| PV variant | 26 (17.8%) | 27 (18.5%) | 0.879 |
| Total freeze applications | 9.3 ± 1.6 | 4.9 ± 1.3 | < 0.001 |
| Total freeze duration (s) | 1,279.1 ± 158.7 | 824.4 ± 116.1 | < 0.001 |
| LSPV | 130 (89.0%) | 129 (88.4%) | 0.853 |
| LSPV freeze applications | 2.2 ± 0.5 | 1.2 ± 0.5 | < 0.001 |
| LSPV freeze duration (s) | 311.5 ± 27.8 | 199.0 ± 34.1 | < 0.001 |
| LSPV nadir temperature (°C) | −50.8 ± 4.4 | −50.0 ± 5.1 | 0.166 |
| LIPV | 130 (89.0%) | 129 (88.4%) | 0.853 |
| LIPV freeze applications | 2.3 ± 0.6 | 1.2 ± 0.5 | < 0.001 |
| LIPV freeze duration (s) | 316.9 ± 39.1 | 203.6 ± 45.7 | < 0.001 |
| LIPV nadir temperature (°C) | −49.1 ± 5.5 | −49.2 ± 5.8 | 0.615 |
| RSPV | 146 (100%) | 146 (100%) | - |
| RSPV freeze applications | 2.2 ± 0.6 | 1.3 ± 0.5 | < 0.001 |
| RSPV freeze duration (s) | 315.3 ± 42.4 | 215.0 ± 51.3 | < 0.001 |
| RSPV nadir temperature (°C) | −49.5 ± 5.8 | −48.9 ± 6.5 | 0.393 |
| RIPV | 146 (100%) | 146 (100%) | - |
| RIPV freeze applications | 2.6 ± 0.8 | 1.2 ± 0.6 | < 0.001 |
| RIPV freeze duration (s) | 341.4 ± 56.9 | 211.1 ± 47.5 | < 0.001 |
| RIPV nadir temperature (°C) | −43.9 ± 6.3 | −44.9 ± 5.9 | 0.110 |
| LCPV | 16 (11.0%) | 17 (11.6%) | 0.853 |
| LCPV freeze applications | 2.8 ± 0.9 | 1.8 ± 1.1 | 0.007 |
| LCPV freeze duration (s) | 363.8 ± 86.2 | 285.9 ± 107.2 | 0.009 |
| LCPV nadir temperature (°C) | −41.3 ± 4.4 | −38.3 ± 4.8 | 0.071 |
| RMPV | 10 (6.8%) | 10 (6.8%) | 1.000 |
| RMPV freeze applications | 2.4 ± 0.5 | 1.2 ± 0.4 | < 0.001 |
| RMPV freeze duration (s) | 336.0 ± 26.3 | 210.0 ± 42.4 | < 0.001 |
| RMPV nadir temperature (°C) | −46.9 ± 4.1 | −45.9 ± 5.6 | 0.319 |
| PSM conventional group (n = 146) | PSM simplified group (n = 146) | P value | |
|---|---|---|---|
| Success of first anatomical attempt is defined as the absence of PV potentials after the first ablation circle, and no recovery of potentials is observed during the check. Acute success was defined as achievement of entrance block confirmed after the final freeze application, with no potentials recorded in any PV at the end of the procedure. PSM: propensity score matching. | |||
| Success of first anatomical attempt | 143 (97.9%) | 132 (90.4%) | 0.022 |
| Acute success | 145 (99.3%) | 146 (100%) | 0.975 |
| Complications (major) | 1 (0.7%) | 1 (0.7%) | 0.596 |
| Complications (minor) | 3 (2.1%) | 7 (4.8%) | 0.772 |
| Follow-up (months) | 11.2 ± 3.6 | 11.8 ± 3.8 | 0.329 |
| Maintenance of sinus rhythm | 114 (78.1%) | 109 (74.7%) | 0.842 |
| Variables | Univariate analysis | Multivariate analysis | ||||
|---|---|---|---|---|---|---|
| HR | 95.0% CI | P value | HR | 95.0% CI | P value | |
| AF: atrial fibrillation; BMI: body mass index; CHD: coronary atherosclerotic heart disease; CI: confidence interval; HR: hazard ratio; LA: left atrial; TIA: transient ischemic attack. | ||||||
| Sex | ||||||
| Female | 1.000 | |||||
| Male | 0.865 | 0.532–1.408 | 0.560 | |||
| Age (years) | 1.020 | 0.996–1.044 | 0.104 | 1.016 | 0.991–1.043 | 0.216 |
| BMI (kg/m2) | 1.011 | 0.934–1.095 | 0.781 | |||
| Course of AF (months) | 1.002 | 0.999–1.005 | 0.232 | |||
| Classification of AF | ||||||
| Paroxysmal | 1.000 | |||||
| Non-paroxysmal | 2.243 | 1.390–3.619 | 0.001 | 1.859 | 1.057–3.271 | 0.031 |
| CHA2DS2-VASc | 1.082 | 0.875–1.337 | 0.469 | |||
| Basic diseases | ||||||
| Hypertension | 1.514 | 0.918–2.498 | 0.104 | 1.380 | 0.832–2.289 | 0.212 |
| CHD | 0.776 | 0.355–1.695 | 0.524 | |||
| Diabetes | 1.135 | 0.581–2.219 | 0.710 | |||
| Stroke/TIA | 1.243 | 0.569–2.716 | 0.585 | |||
| Heart failure | 1.533 | 0.213–11.045 | 0.671 | |||
| LA diameter (mm) | 1.066 | 1.025–1.108 | 0.001 | 1.032 | 0.983–1.084 | 0.203 |
| Modality | ||||||
| Conventional | 1.000 | |||||
| Simplified | 1.150 | 0.716–1.846 | 0.564 | |||