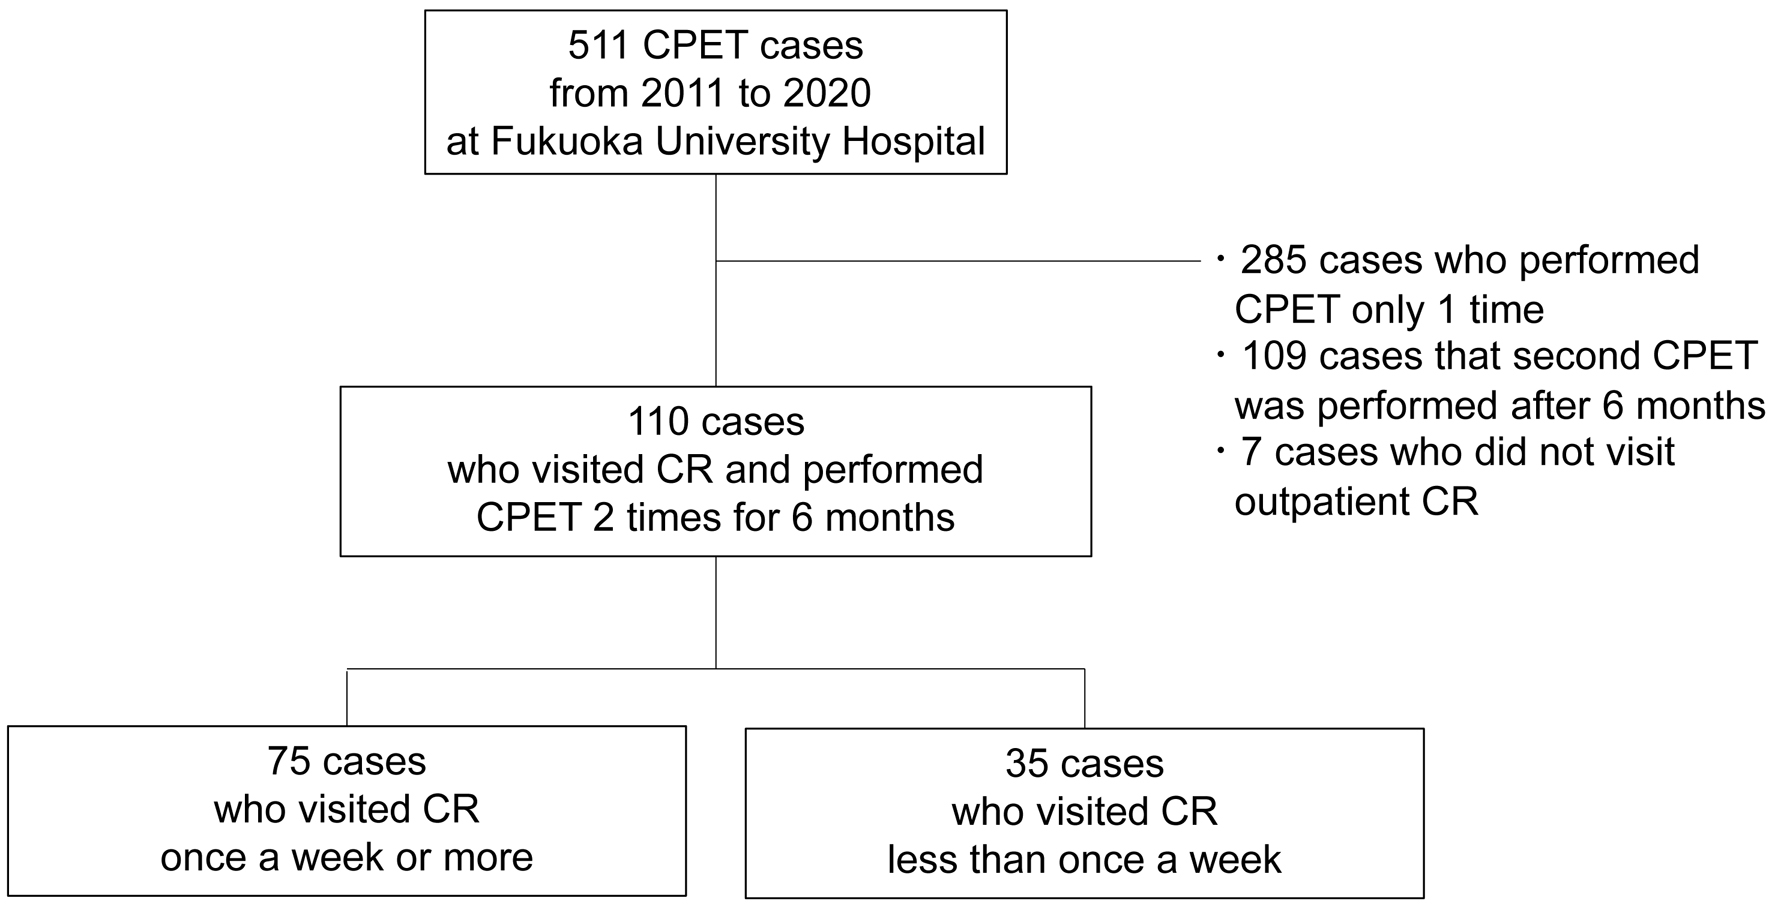
↓ Figure 1. Study flow diagram. CPET: cardiopulmonary exercise test; CR: cardiac rehabilitation.
| Cardiology Research, ISSN 1923-2829 print, 1923-2837 online, Open Access |
| Article copyright, the authors; Journal compilation copyright, Cardiol Res and Elmer Press Inc |
| Journal website https://cr.elmerpub.com |
Original Article
Volume 17, Number 3, June 2026, pages 181-189
Strong Adherence to Cardiac Rehabilitation Program Improves Exercise Tolerance in Outpatients With Cardiovascular Disease
Figures
Tables
| Variables | All cases | CR less than once a week | CR once a week more | P value | |||
|---|---|---|---|---|---|---|---|
| Missing | n = 110 | Missing | n = 35 | Missing | n = 75 | ||
| Underlying CVD represents the indication to CR. P value showed the comparison between CR less than once a week group and CR once a week more group. *Operation indicates cardiac valvular operation. CR: cardiac rehabilitation; Missing: number of missing value; BMI: body mass index; HT: hypertension; DM: diabetes mellitus; DLP: dyslipidemia; CKD: chronic kidney disease; COPD: chronic obstructive pulmonary disease; CVD: cardiovascular disease; IHD: ischemic heart disease; HF: heart failure; MVD: macrovascular disease; RAAS: renin-angiotensin-aldosterone system; CCB: calcium channel blocker; BB: beta-blocker; MRA: mineral corticoid antagonist; PCI: percutaneous coronary intervention; CABG: coronary artery bypass graft; ICD: implantable cardioverter defibrillator; CRT: cardiac resynchronization therapy; TC: total cholesterol; TG: triglyceride; LDL-C: low-density lipoprotein cholesterol; HDL-C: high-density lipoprotein cholesterol; BNP: brain natriuretic peptide; LVEF: left ventricular ejection fraction; TRPG: tricuspid regurgitation pressure gradient. | |||||||
| Frequency of CR, /week | 1.54 (0.93-1.89) | 0.79 (0.53–0.92) | 1.77 (1.53–2.20) | < 0.001 | |||
| Duration of CR, days | 106 ± 29 | 108 ± 35 | 105 ± 26 | 0.52 | |||
| Age, years | 68.5 (59–74) | 67 (51–74) | 69 (64–74) | 0.28 | |||
| Male, n (%) | 76 (69.1) | 24 (68.6) | 52 (69.3) | 0.94 | |||
| BMI, kg/m2 | 23.8 ± 3.6 | 24.0 ± 3.8 | 23.7 ± 3.6 | 0.68 | |||
| Smoking, n (%) | 59 (57.8) | 23 (67.6) | 36 (52.9) | 0.16 | |||
| Underlying disease | |||||||
| HT, n (%) | 1 | 74 (67.9) | 1 | 24 (70.6) | 50 (66.7) | 0.68 | |
| DM, n (%) | 1 | 34 (31.2) | 1 | 11 (32.4) | 23 (30.7) | 0.86 | |
| DLP, n (%) | 1 | 73 (67.0) | 1 | 23 (67.6) | 50 (66.7) | 0.92 | |
| CKD, n (%) | 1 | 52 (47.7) | 1 | 16 (47.1) | 36 (48.0) | 0.93 | |
| COPD, n (%) | 1 | 1 (0.9) | 1 | 0 (0) | 1 (1.3) | 0.50 | |
| Underlying CVD | |||||||
| IHD, n (%) | 57 (51.8) | 21 (60.0) | 36 (48.0) | 0.24 | |||
| HF, n (%) | 1 | 51 (46.8) | 20 (58.8) | 1 | 31 (41.3) | 0.09 | |
| MVD, n (%) | 1 | 9 (8.3) | 1 (2.9) | 1 | 8 (10.7) | 0.17 | |
| Medication | |||||||
| RAAS, n (%) | 21 | 63 (70.8) | 6 | 22 (75.9) | 15 | 41 (68.3) | 0.46 |
| CCB, n (%) | 21 | 39 (43.8) | 6 | 10 (34.5) | 15 | 29 (48.3) | 0.22 |
| Diuretics, n (%) | 21 | 33 (37.1) | 6 | 16 (55.2) | 15 | 17 (28.3) | 0.01 |
| BB, n (%) | 21 | 58 (65.2) | 6 | 23 (79.3) | 15 | 35 (58.3) | 0.18 |
| MRA, n (%) | 21 | 26 (29.2) | 6 | 12 (41.4) | 15 | 14 (23.3) | 0.08 |
| Statin, n (%) | 12 | 62 (63.3) | 3 | 20 (62.5) | 9 | 42 (63.6) | 0.91 |
| PCI, n (%) | 1 | 41 (37.6) | 16 (47.1) | 1 | 25 (33.3) | 0.17 | |
| CABG, n (%) | 1 | 10 (9.2) | 1 (2.9) | 1 | 9 (12.0) | 0.13 | |
| Operation*, n (%) | 1 | 20 (18.3) | 8 (23.5) | 1 | 12 (16.0) | 0.35 | |
| ICD/CRT, n (%) | 1 | 6 (5.5) | 1 (2.9) | 1 | 5 (6.7) | 0.43 | |
| Examinations | |||||||
| TC, mg/dL | 14 | 169 (153–201) | 3 | 171 (152–192) | 11 | 168 (156–206) | 0.66 |
| TG, mg/dL | 17 | 121 (96–174) | 3 | 117 (78–177) | 14 | 133 (97–174) | 0.59 |
| LDL-C, mg/dL | 18 | 98.2 ± 34.7 | 4 | 95.0 ± 32.8 | 14 | 99.8 ± 35.8 | 0.54 |
| HDL-C, mg/dL | 18 | 49.1 ± 14.2 | 4 | 48.3 ± 9.6 | 14 | 49.5 ± 16.1 | 0.65 |
| BNP, pg/mL | 81.7 (27.6–225) | 84.4 (29.4–254) | 80.9 (27.6–214) | 0.88 | |||
| LVEF, % | 25 | 59.0 (44.6–67.9) | 7 | 54.9 (40.1–65.5) | 18 | 62.4 (45.3–68.5) | 0.18 |
| E/e' | 48 | 11.5 (8.6–15.2) | 16 | 13.0 (10.1–21.5) | 32 | 10.3 (7.5–14.8) | 0.07 |
| TRPG, mm Hg | 49 | 20.5 ± 7.5 | 17 | 19.3 ± 7.9 | 32 | 20.9 ± 7.4 | 0.07 |
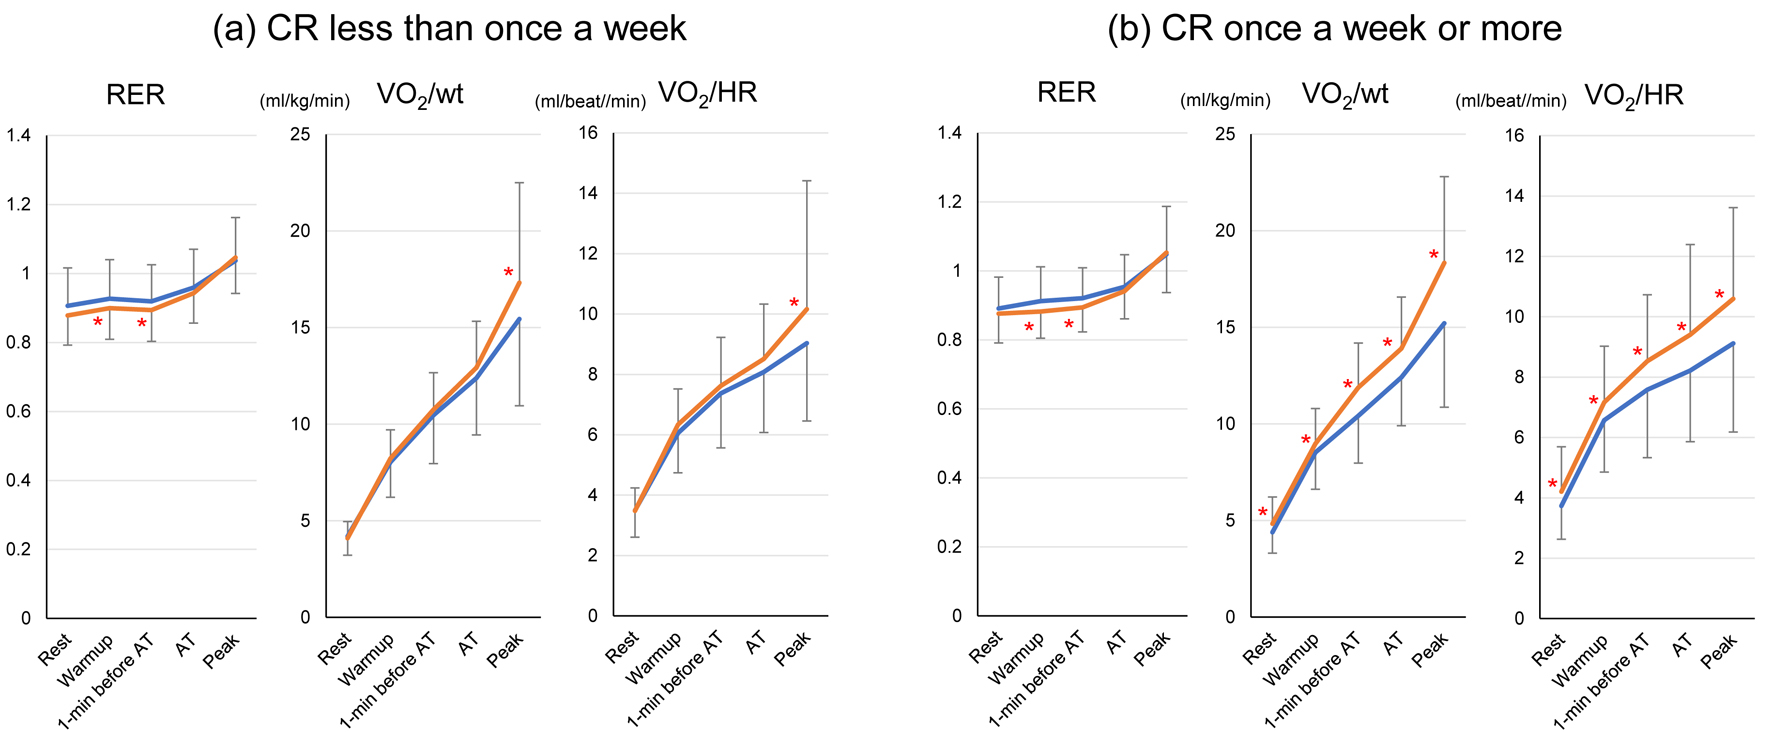
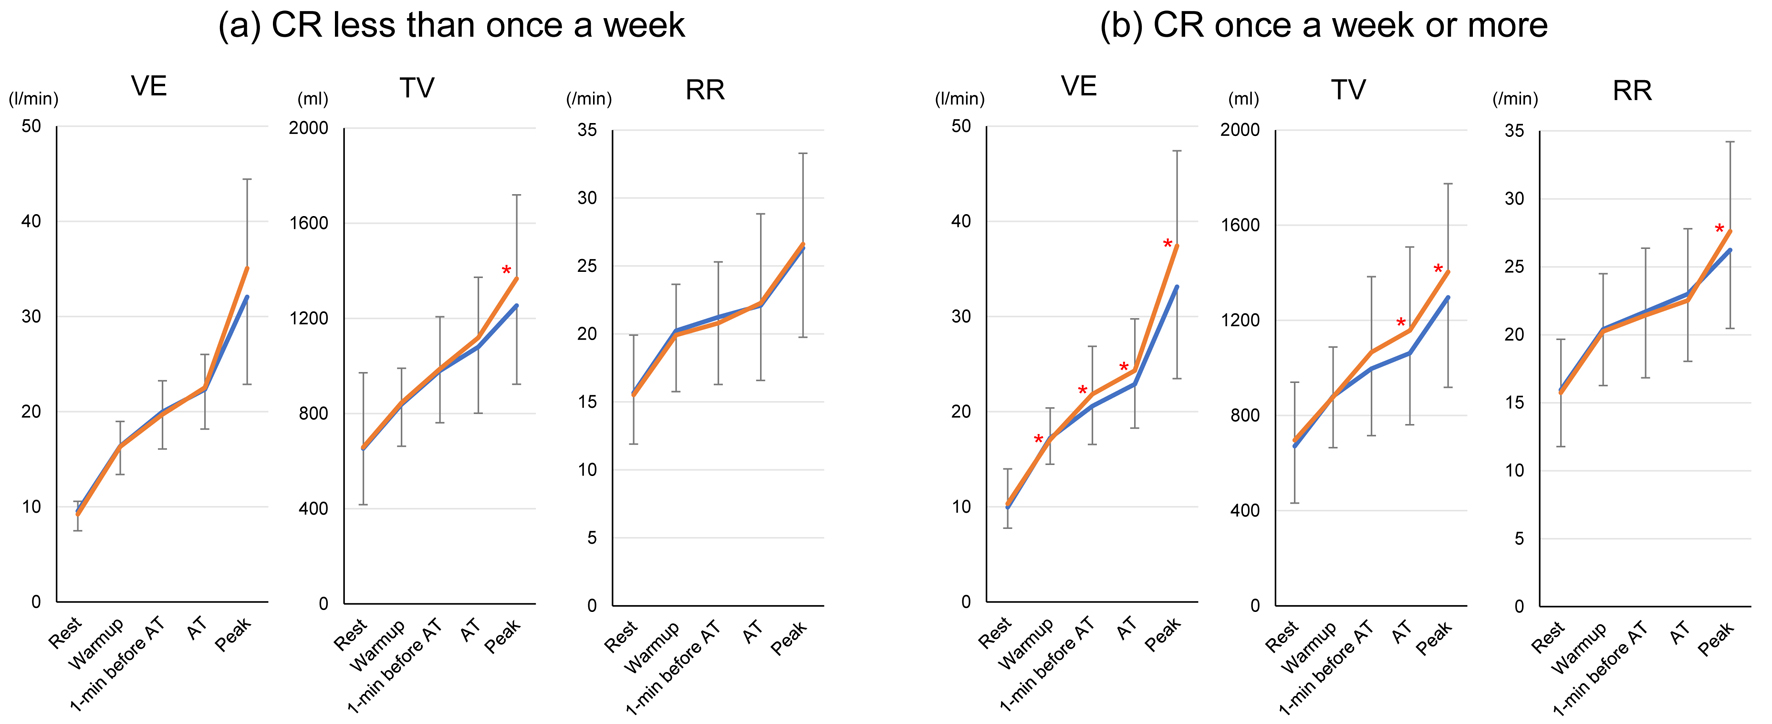
| All cases (n = 110) | CR less than once a week (n = 35) | CR once a week more (n = 75) | P value | |
|---|---|---|---|---|
| CPX: cardiopulmonary exercise test; CR: cardiac rehabilitation; VO2/wt: oxygen uptake per body weight; VO2/HR: oxygen uptake per heart rate; AT: anaerobic threshold; VE: ventilation equivalent. | ||||
| VO2/wt at 1-min before AT, mL/kg/min | 1.30 (−0.30 to 2.20) | 0.80 (−1.00 to 2.10) | 1.50 (−0.10 to 2.60) | 0.013 |
| VO2/wt at AT, mL/kg/min | 2.00 (0.40–4.00) | 1.40 (−0.10 to 3.30) | 2.30 (0.40–4.20) | 0.035 |
| VO2/HR at 1-min before AT, mL/beat/min | 1.07 (0–1.76) | 0.57 (−0.47 to 1.42) | 1.23 (0.34–1.88) | 0.007 |
| VO2/HR at AT, mL/beat/min | 0.92 (0.22–2.01) | 0.50 (−0.47 to 1.67) | 1.07 (0.34–2.26) | 0.030 |
| VE at 1-min before AT, L/min | 0.40 (−0.70 to 3.10) | 0 (−1.40 to 1.40) | 0.90 (−0.50 to 3.50) | 0.018 |
| VE at AT, L/min | 3.24 (0.05–7.19) | 2.14 (−2.67 to 5.87) | 4.84 (0.95–8.35) | 0.066 |