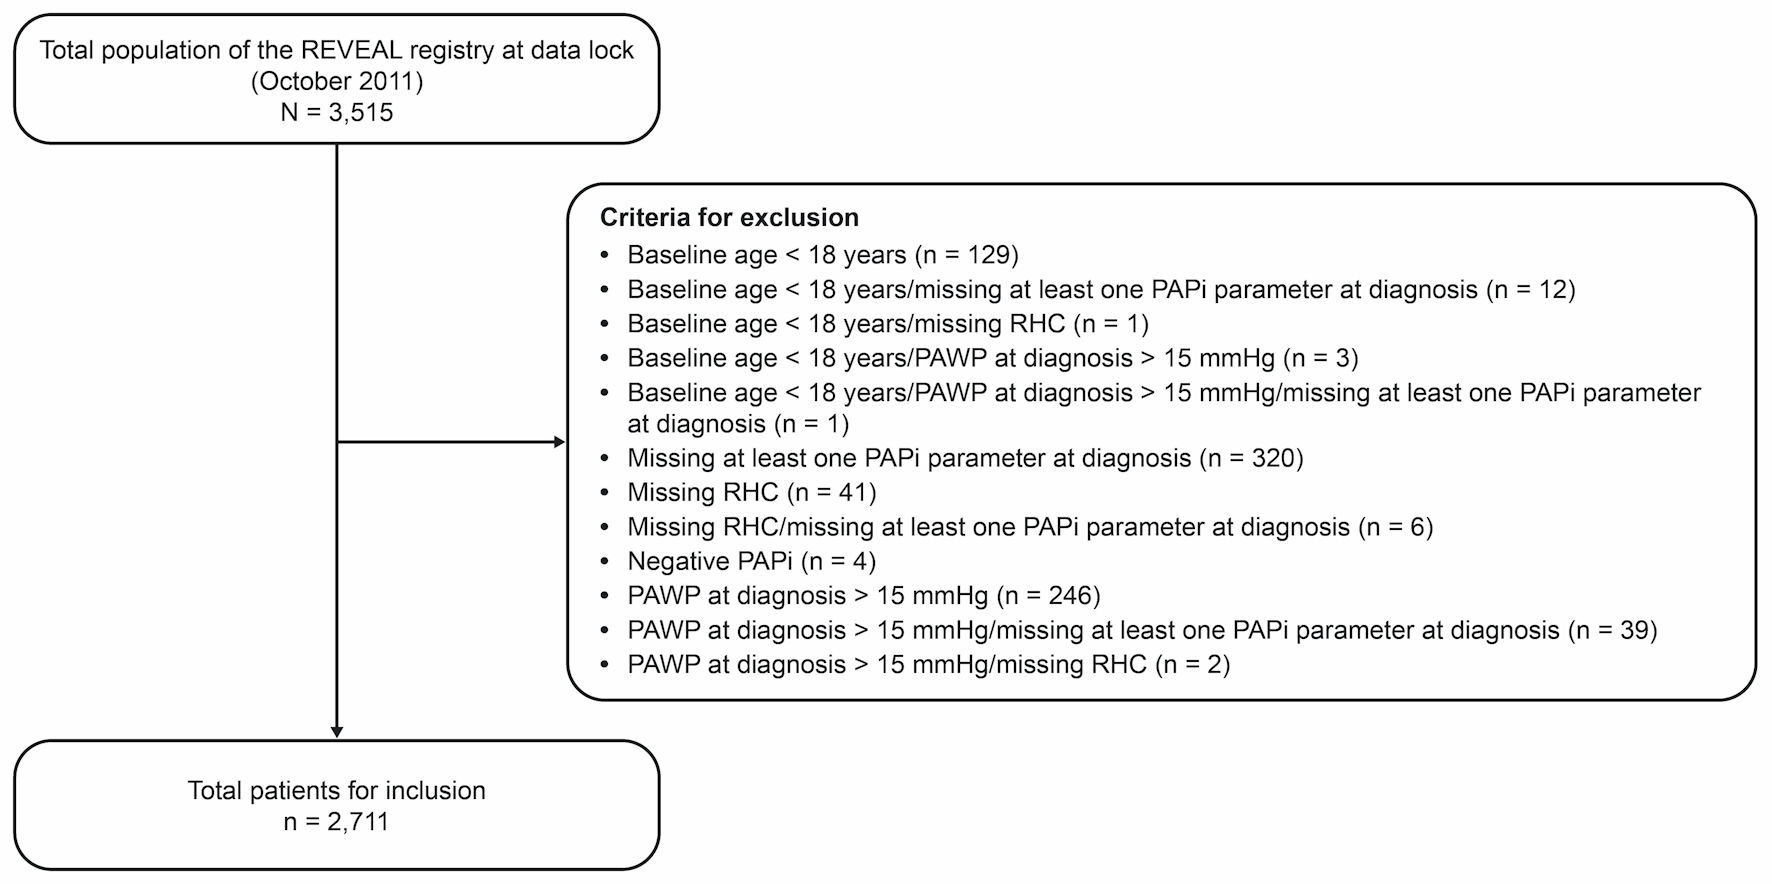
↓ Figure 1. Reasons for exclusion from the study. PAPi: pulmonary artery pulsatility index; PAWP: pulmonary artery wedge pressure; REVEAL: Registry to Evaluate Early and Long-Term PAH Disease Management; RHC: right heart catheterization.
| Cardiology Research, ISSN 1923-2829 print, 1923-2837 online, Open Access |
| Article copyright, the authors; Journal compilation copyright, Cardiol Res and Elmer Press Inc |
| Journal website https://cr.elmerpub.com |
Original Article
Volume 17, Number 3, June 2026, pages 214-226
Predictive Value of the Pulmonary Artery Pulsatility Index in Pulmonary Arterial Hypertension: REVEAL Analysis
Figures
Tables
| Characteristic | PAPi quartile | ||||
|---|---|---|---|---|---|
| Overall (N = 2,711) | < 3.55 (n = 678) | ≥ 3.55 to < 5.5 (n = 668) | ≥ 5.50 to < 9.0 (n = 682) | ≥ 9.0 (n = 683) | |
| aIncident cases were defined as patients who received a diagnosis of PAH confirmed by RHC during study recruitment; prevalent cases were defined as patients diagnosed prior to the start of the study [24]. bPatients were deemed newly diagnosed if the qualifying RHC was performed within the 3 months preceding enrollment to REVEAL, and previously diagnosed if the qualifying RHC was prior to the 3 months before enrollment [24]. APAH: associated PAH; BMI: body mass index; FC: functional class; FPAH: familial PAH; HIV: human immunodeficiency virus; IPAH: idiopathic PAH; IQR: interquartile range; NYHA: New York Heart Association; PAH: pulmonary arterial hypertension; PAPi: pulmonary artery pulsatility index; RHC: right heart catheterization; SD: standard deviation; WHO: World Health Organization. | |||||
| Age, years | |||||
| N | 2,711 | 678 | 668 | 682 | 683 |
| Mean (SD) | 52.4 (14.7) | 51.4 (13.9) | 53.5 (14.4) | 53.1 (14.9) | 51.8 (15.5) |
| Median (IQR) | 53.0 (42.4–63.3) | 51.4 (41.6–61.3) | 54.1 (44.0–64.1) | 53.5 (42.9–64.3) | 52.4 (41.2–63.2) |
| Age at diagnosis, years | |||||
| N | 2,711 | 678 | 668 | 682 | 683 |
| Mean (SD) | 49.7 (15.5) | 49.1 (14.2) | 51.0 (15.1) | 50.2 (15.9) | 48.6 (16.7) |
| Median (IQR) | 50.2 (39.0–61.1) | 49.4 (38.7–59.2) | 51.2 (41.2–62.0) | 50.5 (40.1–62.4) | 49.7 (36.6–60.8) |
| Sex, n (%) | |||||
| Male | 561 (20.7) | 164 (24.2) | 138 (20.7) | 132 (19.4) | 127 (18.6) |
| Female | 2,150 (79.3) | 514 (75.8) | 530 (79.3) | 550 (80.6) | 556 (81.4) |
| Race, n (%) | |||||
| White | 1,969 (72.6) | 480 (70.8) | 489 (73.2) | 518 (76.0) | 482 (70.6) |
| Black | 347 (12.8) | 112 (16.5) | 89 (13.3) | 72 (10.6) | 74 (10.8) |
| Hispanic | 236 (8.7) | 48 (7.1) | 50 (7.5) | 60 (8.8) | 78 (11.4) |
| Asian | 86 (3.2) | 17 (2.5) | 23 (3.4) | 13 (1.9) | 33 (4.8) |
| Other | 73 (2.7) | 21 (3.1) | 17 (2.5) | 19 (2.8) | 16 (2.3) |
| BMI, kg/m2 | |||||
| N | 2,587 | 640 | 637 | 651 | 659 |
| Mean (SD) | 28.3 (7.0) | 29.3 (7.4) | 29.3 (7.4) | 27.9 (6.6) | 26.5 (6.1) |
| Median (IQR) | 27.1 (23.2–31.8) | 28.4 (24.2–33.1) | 28.1 (24.1–33.2) | 26.8 (23.2–31.1) | 25.7 (21.8–30.1) |
| Missing, n | 124 | 38 | 31 | 31 | 24 |
| PAH diagnosis, n (%)a | |||||
| Incident | 900 (33.2) | 248 (36.6) | 243 (36.4) | 207 (30.4) | 202 (29.6) |
| Prevalent | 1,811 (66.8) | 430 (63.4) | 425 (63.6) | 475 (69.6) | 481 (70.4) |
| Diagnostic status, n (%)b | |||||
| Newly diagnosed | 737 (27.2) | 206 (30.4) | 199 (29.8) | 165 (24.2) | 167 (24.5) |
| Previously diagnosed | 1,974 (72.8) | 472 (69.6) | 469 (70.2) | 517 (75.8) | 516 (75.5) |
| NYHA/WHO FC, n (%) | |||||
| I | 172 (7.1) | 26 (4.3) | 39 (6.3) | 54 (8.9) | 53 (8.7) |
| II | 843 (34.6) | 181 (29.9) | 200 (32.5) | 229 (37.9) | 233 (38.2) |
| III | 1,256 (51.6) | 331 (54.6) | 337 (54.8) | 287 (47.5) | 301 (49.3) |
| IV | 164 (6.7) | 68 (11.2) | 39 (6.3) | 34 (5.6) | 23 (3.8) |
| Missing, n | 276 | 72 | 53 | 78 | 73 |
| WHO group I diagnosis, n (%) | |||||
| APAH–APAH–HIV | 49 (1.8) | 15 (2.2) | 14 (2.1) | 10 (1.5) | 10 (1.5) |
| APAH–collagen vascular disease/connective tissue disease | 708 (26.1) | 180 (26.5) | 178 (26.6) | 176 (25.8) | 174 (25.5) |
| APAH–congenital systemic-to-pulmonary shunts | 271 (10.0) | 25 (3.7) | 48 (7.2) | 77 (11.3) | 121 (17.7) |
| APAH–drugs and toxins | 155 (5.7) | 50 (7.4) | 47 (7.0) | 35 (5.1) | 23 (3.4) |
| APAH–other | 33 (1.2) | 10 (1.5) | 9 (1.3) | 8 (1.2) | 6 (0.9) |
| APAH–portal hypertension | 163 (6.0) | 34 (5.0) | 38 (5.7) | 41 (6.0) | 50 (7.3) |
| FPAH | 78 (2.9) | 23 (3.4) | 21 (3.1) | 19 (2.8) | 15 (2.2) |
| IPAH | 1,242 (45.8) | 338 (49.9) | 311 (46.6) | 312 (45.7) | 281 (41.1) |
| Pulmonary capillary hemangiomatosis | 1 (0.04) | 0 | 0 | 0 | 1 (0.1) |
| Pulmonary veno-occlusive disease | 11 (0.4) | 3 (0.4) | 2 (0.3) | 4 (0.6) | 2 (0.3) |
| Characteristic | PAPi quartile | ||||
|---|---|---|---|---|---|
| Overall (N = 2,711) | < 3.55 (n = 678) | ≥ 3.55 to < 5.5 (n = 668) | ≥ 5.50 to < 9.0 (n = 682) | ≥ 9.0 (n = 683) | |
| aScale ranges from 0, where breathing is causing no difficulty at all, through 10, where breathing difficulty is maximal. BNP: brain natriuretic peptide; bpm: beats per minute; COPD: chronic obstructive pulmonary disease; IQR: interquartile range; mPAP: mean pulmonary artery pressure; PAH: pulmonary arterial hypertension; PAPi: pulmonary artery pulsatility index; PCWP: pulmonary capillary wedge pressure; PVR: pulmonary vascular resistance; REVEAL: Registry to Evaluate Early and Long-Term PAH Disease Management; RHC: right heart catheterization; SD: standard deviation. | |||||
| Heart rate, bpm | |||||
| N | 2,574 | 643 | 635 | 653 | 643 |
| Mean (SD) | 83.1 (14.7) | 85.9 (15.1) | 83.7 (14.5) | 82.0 (14.5) | 80.7 (14.3) |
| Median (IQR) | 82.0 (72.0–93.0) | 85.0 (76.0–96.0) | 83.0 (72.0–93.5) | 81.0 (72.0–92.0) | 80.0 (70.0–90.0) |
| Missing, n | 137 | 35 | 33 | 29 | 40 |
| Systolic blood pressure, mm Hg | |||||
| N | 2,593 | 647 | 636 | 657 | 653 |
| Mean (SD) | 117.1 (17.6) | 115.5 (18.1) | 117.6 (17.6) | 117.7 (17.3) | 117.5 (17.3) |
| Median (IQR) | 115.0 (104.0–128.0) | 113.0 (102.0–126.0) | 116.0 (105.0–130.0) | 115.0 (106.0–128.0) | 118.0 (104.0–128.0) |
| Missing, n | 118 | 31 | 32 | 25 | 30 |
| Diastolic blood pressure, mm Hg | |||||
| N | 2,591 | 647 | 636 | 657 | 651 |
| Mean (SD) | 70.2 (11.1) | 70.7 (11.6) | 70.0 (11.4) | 70.3 (10.7) | 69.9 (10.6) |
| Median (IQR) | 70.0 (62.0–78.0) | 70.0 (62.0–79.0) | 70.0 (60.0–78.0) | 70.0 (62.0–77.0) | 70.0 (62.0–78.0) |
| Missing, n | 120 | 31 | 32 | 25 | 32 |
| 6-min walk distance, m | |||||
| N | 2,139 | 509 | 527 | 553 | 550 |
| Mean (SD) | 361.6 (127.5) | 340.1 (126.0) | 355.0 (129.1) | 369.4 (131.4) | 380.1 (120.0) |
| Median (IQR) | 371.9 (278.9–446.8) | 358.0 (256.0–428.0) | 365.8 (271.3–441.0) | 380.0 (288.3–451.1) | 383.0 (310.9–454.0) |
| Missing, n | 572 | 169 | 141 | 129 | 133 |
| BNP value, pg/mL | |||||
| N | 1,315 | 339 | 312 | 338 | 326 |
| Mean (SD) | 323.5 (616.6) | 427.9 (789.0) | 325.5 (550.9) | 309.6 (643.8) | 227.5 (385.6) |
| Median (IQR) | 131.0 (45.0–367.5) | 202.0 (66.0–505.0) | 137.0 (44.0–379.8) | 125.5 (46.3–298.0) | 98.0 (37.0–272.3) |
| Missing, n | 1,396 | 339 | 356 | 344 | 357 |
| Most recent BNP, pg/mL | |||||
| N | 279 | 74 | 83 | 64 | 58 |
| Mean (SD) | 2,205.8 (6,818.5) | 2,002.7 (3,606.7) | 3,909.5 (11,710.0) | 1,382.1 (2,062.5) | 935.7 (1,200.4) |
| Median (IQR) | 613.0 (157.0–1,824.5) | 1,026.5 (226.0–2,244.0) | 613.0 (175.0–2,543.5) | 530.5 (142.5–1,328.0) | 551.5 (131.8–1,085.8) |
| Missing, n | 2,432 | 604 | 585 | 618 | 625 |
| PAH risk score (REVEAL 2.0 Risk Calculator) | |||||
| N | 2,711 | 678 | 668 | 682 | 683 |
| Mean (SD) | 7.6 (2.3) | 8.2 (2.4) | 7.6 (2.3) | 7.4 (2.4) | 7.2 (2.1) |
| Median (IQR) | 8.0 (6.0–9.0) | 8.0 (7.0–10.0) | 8.0 (6.0–9.0) | 7.0 (6.0–9.0) | 7.0 (6.0–8.0) |
| Baseline mPAP (at rest) | |||||
| N | 2,654 | 665 | 649 | 670 | 670 |
| Mean (SD) | 49.6 (14.4) | 48.6 (13.4) | 49.4 (13.9) | 50.5 (14.4) | 49.7 (15.6) |
| Median (IQR) | 48.0 (40.0–58.0) | 48.0 (40.0–57.0) | 48.0 (40.0–58.0) | 50.0 (40.0–59.0) | 48.0 (38.0–58.0) |
| Missing, n | 57 | 13 | 19 | 12 | 13 |
| Mixed venous O2 saturation | |||||
| N | 1,741 | 433 | 422 | 442 | 444 |
| Mean (SD) | 63.8 (9.8) | 58.5 (10.9) | 63.7 (8.9) | 66.0 (9.1) | 66.9 (7.6) |
| Median (IQR) | 65.0 (58.0–70.0) | 59.0 (51.0–66.0) | 64.0 (57.0–70.0) | 66.0 (61.0–71.8) | 67.5 (62.0–72.0) |
| Missing, n | 970 | 245 | 246 | 240 | 239 |
| Cardiac index (L/min/m2) | |||||
| N | 2,193 | 569 | 544 | 542 | 538 |
| Mean (SD) | 2.4 (0.8) | 2.2 (0.8) | 2.4 (0.8) | 2.5 (0.8) | 2.5 (0.7) |
| Median (IQR) | 2.3 (1.8–2.8) | 2.0 (1.6–2.6) | 2.3 (1.8–2.8) | 2.4 (1.9–2.9) | 2.5 (2.1–2.9) |
| Missing, n | 518 | 109 | 124 | 140 | 145 |
| PVR, Wood units | |||||
| N | 2,516 | 652 | 621 | 632 | 611 |
| Mean (SD) | 10.3 (6.9) | 10.9 (6.7) | 10.0 (6.0) | 10.1 (6.2) | 10.2 (8.6) |
| Median (IQR) | 8.9 (5.8–13.1) | 9.8 (5.9–14.5) | 8.6 (5.7–12.9) | 8.7 (5.7–12.9) | 8.6 (5.8–11.8) |
| Missing, n | 195 | 26 | 47 | 50 | 72 |
| Baseline PCWP (at rest), mm Hg | |||||
| N | 2,585 | 645 | 633 | 659 | 648 |
| Mean (SD) | 9.8 (4.0) | 10.7 (3.9) | 10.5 (4.1) | 9.7 (3.7) | 8.2 (4.0) |
| Median (IQR) | 10.0 (7.0–12.0) | 11.0 (8.0–13.0) | 10.0 (8.0–13.0) | 9.0 (7.0–12.0) | 8.0 (6.0–11.0) |
| Missing, n | 126 | 33 | 35 | 23 | 35 |
| Glomerular filtration rate at enrollment, mL/min/1.73 m2 | |||||
| N | 2,158 | 545 | 526 | 541 | 546 |
| Mean (SD) | 75.0 (26.5) | 73.5 (26.2) | 73.2 (27.3) | 76.0 (24.9) | 77.1 (27.2) |
| Median (IQR) | 73.5 (56.7–93.5) | 71.9 (54.2–91.6) | 71.4 (54.6–92.2) | 74.2 (59.3–92.2) | 76.8 (58.3–96.2) |
| Missing, n | 553 | 133 | 142 | 141 | 137 |
| Borg dyspnea scalea | |||||
| N | 1,922 | 452 | 484 | 501 | 485 |
| Mean (SD) | 3.0 (2.0) | 3.1 (2.0) | 3.3 (2.1) | 3.0 (2.0) | 2.8 (1.8) |
| Median (IQR) | 3.0 (2.0–4.0) | 3.0 (1.8–4.0) | 3.0 (2.0–4.0) | 3.0 (2.0–4.0) | 3.0 (1.0–4.0) |
| Missing, n | 789 | 226 | 184 | 181 | 198 |
| Medical history of obstructive lung disease, n (%) | |||||
| Yes | 386 (14.7) | 90 (13.8) | 105 (16.2) | 107 (16.2) | 84 (12.6) |
| No | 2,243 (85.3) | 561 (86.2) | 544 (83.8) | 553 (83.8) | 585 (87.4) |
| Missing | 82 | 27 | 19 | 22 | 14 |
| Medical history of reactive airways disease, n (%) | |||||
| Yes | 257 (9.9) | 60 (9.3) | 67 (10.4) | 61 (9.4) | 69 (10.4) |
| No | 2,346 (90.1) | 587 (90.7) | 575 (89.6) | 591 (90.6) | 593 (89.6) |
| Missing | 108 | 31 | 26 | 30 | 21 |
| Medical history of sleep apnea, n (%) | |||||
| Yes | 553 (21.6) | 169 (26.9) | 167 (26.2) | 126 (19.7) | 91 (14.0) |
| No | 2,003 (78.4) | 460 (73.1) | 470 (73.8) | 512 (80.3) | 561 (86.0) |
| Missing | 155 | 49 | 31 | 44 | 31 |
| History of lung transplant, n (%) | |||||
| Yes | 5 (0.2) | 1 (0.1) | 2 (0.3) | 2 (0.3) | 0 |
| No | 2,706 (99.8) | 677 (99.9) | 666 (99.7) | 680 (99.7) | 683 (100) |
| History of atrial septostomy, n (%) | |||||
| Yes | 18 (0.7) | 1 (0.1) | 2 (0.3) | 6 (0.9) | 9 (1.3) |
| No | 2,693 (99.3) | 677 (99.9) | 666 (99.7) | 676 (99.1) | 674 (98.7) |
| COPD, n (%) | |||||
| Yes | 266 (10.0) | 63 (9.4) | 75 (11.5) | 72 (10.7) | 56 (8.3) |
| No | 2,405 (90.0) | 606 (90.6) | 577 (88.5) | 601 (89.3) | 621 (91.7) |
| Missing | 40 | 9 | 16 | 9 | 6 |
| Pulmonary embolism, n (%) | |||||
| Yes | 82 (3.1) | 24 (3.6) | 23 (3.5) | 19 (2.8) | 16 (2.4) |
| No | 2,589 (96.9) | 645 (96.4) | 629 (96.5) | 654 (97.2) | 661 (97.6) |
| Missing | 40 | 9 | 16 | 9 | 6 |
| Congenital heart disease, n (%) | |||||
| Yes | 271 (10.0) | 25 (3.7) | 48 (7.2) | 77 (11.3) | 121 (17.7) |
| No | 2,440 (90.0) | 653 (96.3) | 620 (92.8) | 605 (88.7) | 562 (82.3) |
| Any prostacyclin, n (%) | |||||
| Yes | 1,013 (38.1) | 310 (46.5) | 265 (40.8) | 230 (34.3) | 208 (31.0) |
| No | 1,645 (61.9) | 357 (53.5) | 384 (59.2) | 440 (65.7) | 464 (69.0) |
| Missing | 53 | 11 | 19 | 12 | 11 |
| Any phosphodiesterase-5 inhibitor, n (%) | |||||
| Yes | 1,239 (46.6) | 300 (45.0) | 294 (45.3) | 328 (49.0) | 317 (47.2) |
| No | 1,419 (53.4) | 367 (55.0) | 355 (54.7) | 342 (51.0) | 355 (52.8) |
| Missing | 53 | 11 | 19 | 12 | 11 |
| Any endothelin receptor antagonist, n (%) | |||||
| Yes | 1,118 (42.1) | 259 (38.8) | 241 (37.1) | 307 (45.8) | 311 (46.3) |
| No | 1,540 (57.9) | 408 (61.2) | 408 (62.9) | 363 (54.2) | 361 (53.7) |
| Missing | 53 | 11 | 19 | 12 | 11 |
| PAPi quartile | P valuea | |||||
|---|---|---|---|---|---|---|
| Overall | < 3.55 | ≥ 3.55 to < 5.5 | ≥ 5.5 to < 9.0 | ≥ 9.0 | ||
| aPearson’s Chi-squared test. PAPi: pulmonary artery pulsatility index. | ||||||
| Hospitalization, n (%) | N = 2,414 | n = 606 | n = 594 | n = 608 | n = 606 | |
| Yes | 1,326 (54.9) | 362 (59.7) | 340 (57.2) | 333 (54.8) | 291 (48.0) | < 0.001 |
| No | 1,088 (45.1) | 244 (40.3) | 254 (42.8) | 275 (45.2) | 315 (52.0) | |
| Mortality, n (%) | N = 2,427 | n = 613 | n = 588 | n = 603 | n = 623 | |
| Yes | 681 (28.1) | 220 (35.9) | 157 (26.7) | 154 (25.5) | 150 (24.1) | < 0.001 |
| No | 1,746 (71.9) | 393 (64.1) | 431 (73.3) | 449 (74.5) | 473 (75.9) | |