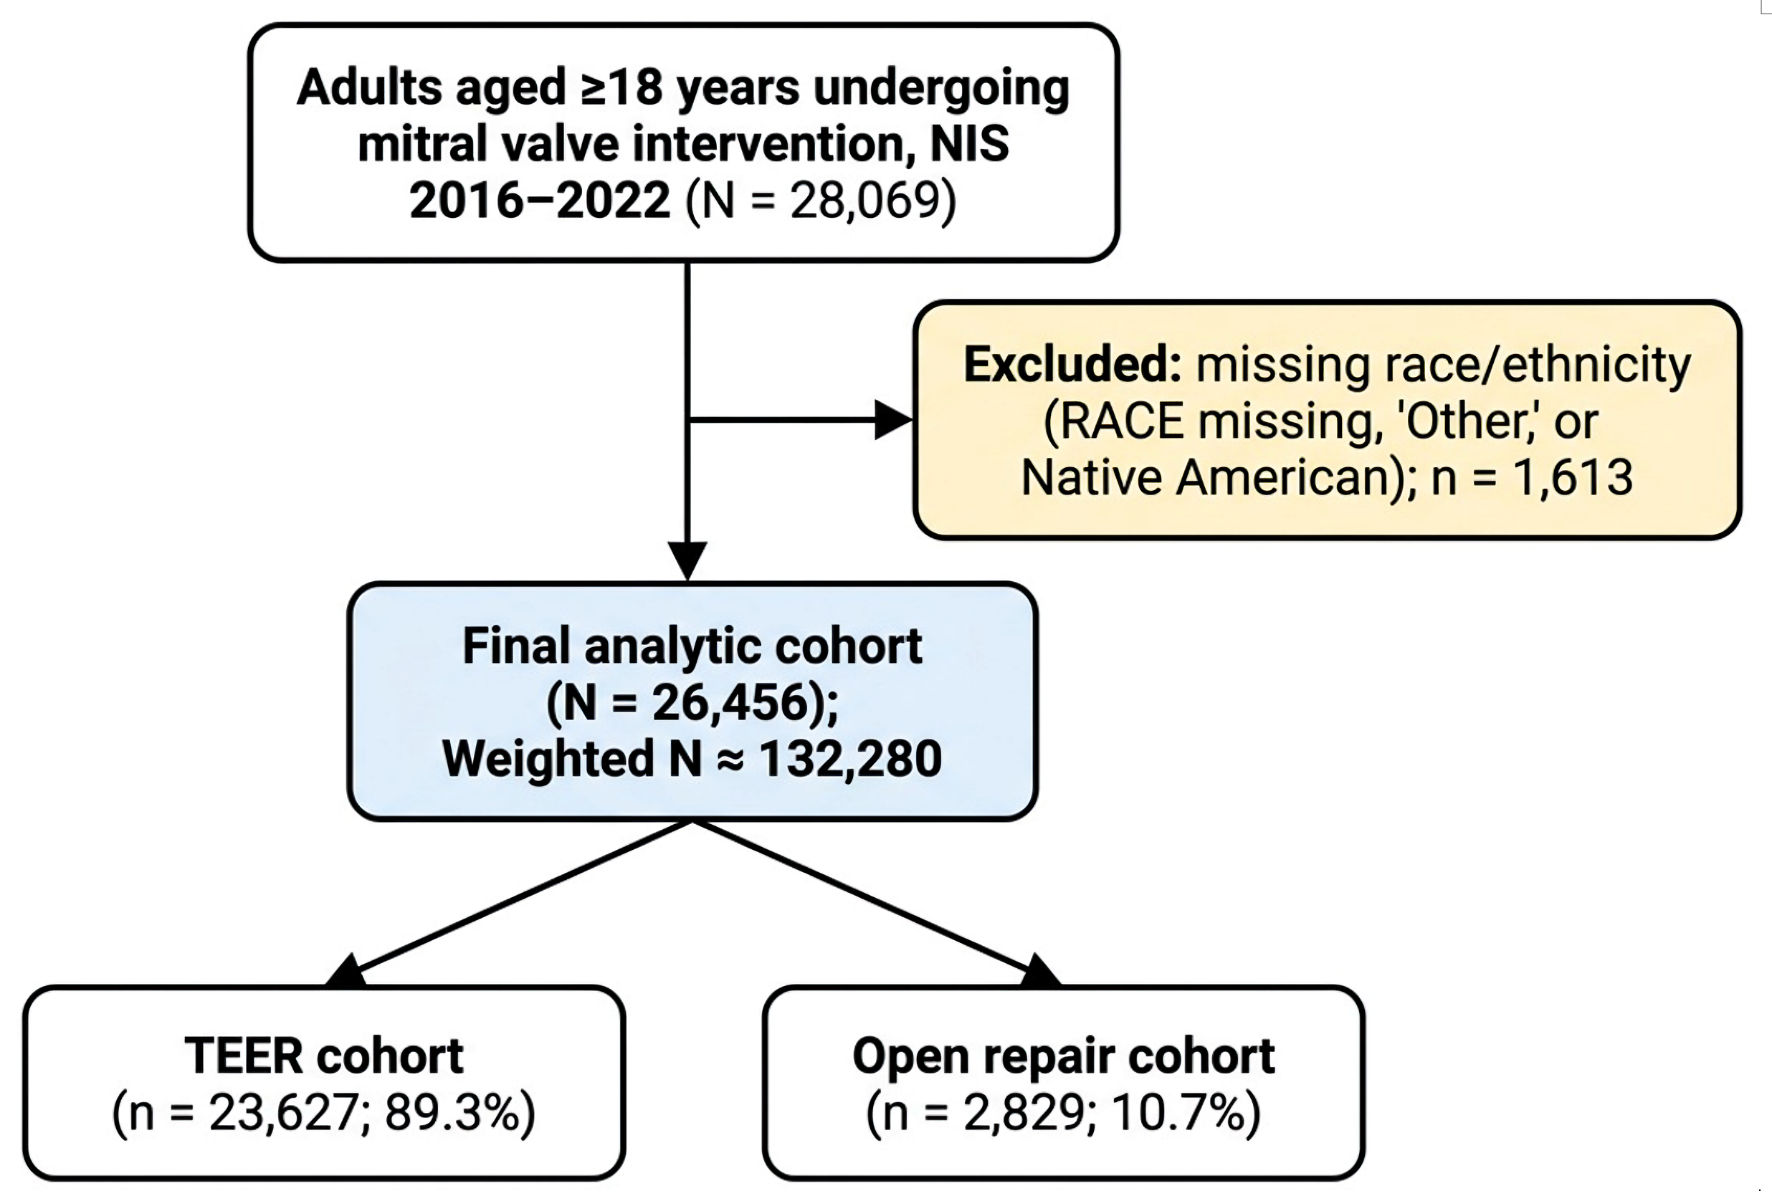
↓ Figure 1. Study flow diagram. NIS: National Inpatient Sample; TEER: transcatheter edge-to-edge repair.
| Cardiology Research, ISSN 1923-2829 print, 1923-2837 online, Open Access |
| Article copyright, the authors; Journal compilation copyright, Cardiol Res and Elmer Press Inc |
| Journal website https://cr.elmerpub.com |
Original Article
Volume 17, Number 4, August 2026, pages 277-287
Racial Disparities in Transcatheter Edge-to-Edge Repair Versus Open Mitral Valve Surgery: A Nationwide Analysis
Figures
Tables
| Characteristic | Overall (n = 26,456) | White (n = 22,050) | Black (n = 2,178) | Hispanic (n = 1,382) | Asian/PI (n = 846) | P |
|---|---|---|---|---|---|---|
| aSevere heart failure was defined as a heart-failure diagnosis with APR-DRG severity ≥ 3 and was used as a proxy for likely secondary (functional) mitral regurgitation. PI: Pacific Islander; ICD-10: ICD-10-CM: International Classification of Diseases, 10th Revision; SD: standard deviation; TEER: transcatheter edge-to-edge repair; COPD: chronic obstructive pulmonary disease; ED: emergency department. | ||||||
| Age, mean (years) | 68.7 | 69.6 | 62.2 | 66.4 | 64.3 | < 0.001 |
| Age < 50, % | 8.8 | 7.4 | 17.8 | 13.2 | 16.6 | < 0.001 |
| Age 50–64, % | 26.1 | 24.8 | 36.0 | 28.6 | 30.3 | |
| Age 65–74, % | 27.0 | 27.4 | 25.3 | 24.2 | 25.7 | |
| Age 75–84, % | 26.8 | 28.2 | 16.8 | 23.4 | 20.0 | |
| Age ≥ 85, % | 11.3 | 12.2 | 4.1 | 10.6 | 7.6 | |
| Male, % | 57.8 | 59.1 | 47.2 | 54.6 | 56.2 | < 0.001 |
| Insurance | < 0.001 | |||||
| Medicare, % | 61.7 | 63.6 | 52.9 | 55.9 | 44.7 | |
| Medicaid, % | 4.8 | 3.2 | 14.3 | 12.2 | 10.6 | |
| Private, % | 30.4 | 30.4 | 27.9 | 26.8 | 40.2 | |
| Other/Self-pay, % | 3.2 | 2.8 | 4.9 | 5.1 | 4.5 | |
| Income quartile | < 0.001 | |||||
| Q1 (lowest), % | 19.9 | 17.2 | 44.6 | 29.9 | 8.7 | |
| Q4 (highest), % | 29.5 | 30.9 | 13.3 | 19.5 | 52.5 | |
| Large hospital, % | 72.2 | 71.7 | 73.3 | 74.5 | 77.5 | 0.005 |
| Teaching hospital, % | 91.1 | 90.9 | 92.8 | 90.9 | 91.8 | 0.117 |
| Region | < 0.001 | |||||
| Northeast, % | 19.6 | 20.2 | 16.6 | 18.7 | 15.5 | |
| Midwest, % | 24.1 | 26.0 | 19.5 | 8.8 | 11.4 | |
| South, % | 33.9 | 32.3 | 53.2 | 40.4 | 16.1 | |
| West, % | 22.4 | 21.6 | 10.7 | 32.1 | 57.1 | |
| Comorbidities (ICD-10 ascertained) | ||||||
| Hypertension, % | 73.8 | 72.1 | 87.7 | 79.6 | 72.9 | < 0.001 |
| Diabetes, % | 18.1 | 15.8 | 29.4 | 31.5 | 25.2 | < 0.001 |
| Obesity, % | 14.3 | 13.4 | 22.8 | 18.7 | 8.4 | < 0.001 |
| Chronic kidney disease, % | 23.8 | 21.8 | 40.5 | 29.7 | 22.5 | < 0.001 |
| COPD, % | 11.9 | 11.9 | 15.3 | 10.2 | 5.7 | < 0.001 |
| Atrial fibrillation, % | 58.7 | 60.5 | 44.2 | 53.0 | 58.0 | < 0.001 |
| Heart failure, % | 60.6 | 58.6 | 75.8 | 69.3 | 57.7 | < 0.001 |
| Coronary artery disease, % | 42.3 | 42.1 | 42.2 | 47.3 | 38.3 | < 0.001 |
| Cardiomyopathy, % | 17.3 | 15.0 | 36.7 | 23.3 | 17.9 | < 0.001 |
| Pulmonary hypertension, % | 22.9 | 21.6 | 32.5 | 26.3 | 26.0 | < 0.001 |
| Severe heart failurea, % | 31.4 | 29.1 | 47.1 | 41.2 | 32.9 | < 0.001 |
| Late presentation | ||||||
| Late referral composite, % | 15.1 | 13.4 | 23.8 | 27.4 | 16.1 | < 0.001 |
| Nonelective admission, % | 14.8 | 13.1 | 23.6 | 27.3 | 16.1 | < 0.001 |
| ED arrival, % | 4.8 | 4.2 | 9.4 | 8.2 | 3.7 | < 0.001 |
| TEER (vs open repair), % | 89.3 | 89.4 | 90.3 | 88.5 | 86.9 | 0.051 |
| Race (vs White) | Model 1 unadjusted | Model 2 + demographics | Model 3 + hospital | Model 4 fully adjusted* |
|---|---|---|---|---|
| PI: Pacific Islander; TEER: transcatheter edge-to-edge repair. | ||||
| Black | 1.10 (0.95–1.28) P = 0.200 | 1.53 (1.30–1.79) P < 0.001 | 1.53 (1.30–1.80) P < 0.001 | 1.36 (1.15–1.61) P < 0.001 |
| Hispanic | 0.92 (0.77–1.09) P = 0.323 | 1.07 (0.89–1.28) P = 0.476 | 1.12 (0.93–1.34) P = 0.241 | 1.04 (0.86–1.25) P = 0.699 |
| Asian/PI | 0.79 (0.63–0.98) P = 0.031 | 0.99 (0.79–1.24) P = 0.934 | 1.03 (0.82–1.30) P = 0.773 | 1.01 (0.81–1.27) P = 0.914 |
| Race (vs White) | Model 1 unadjusted | Model 2 + demographics | Model 3 + hospital | Model 4 + comorbidities | Model 5 fully adjusted† |
|---|---|---|---|---|---|
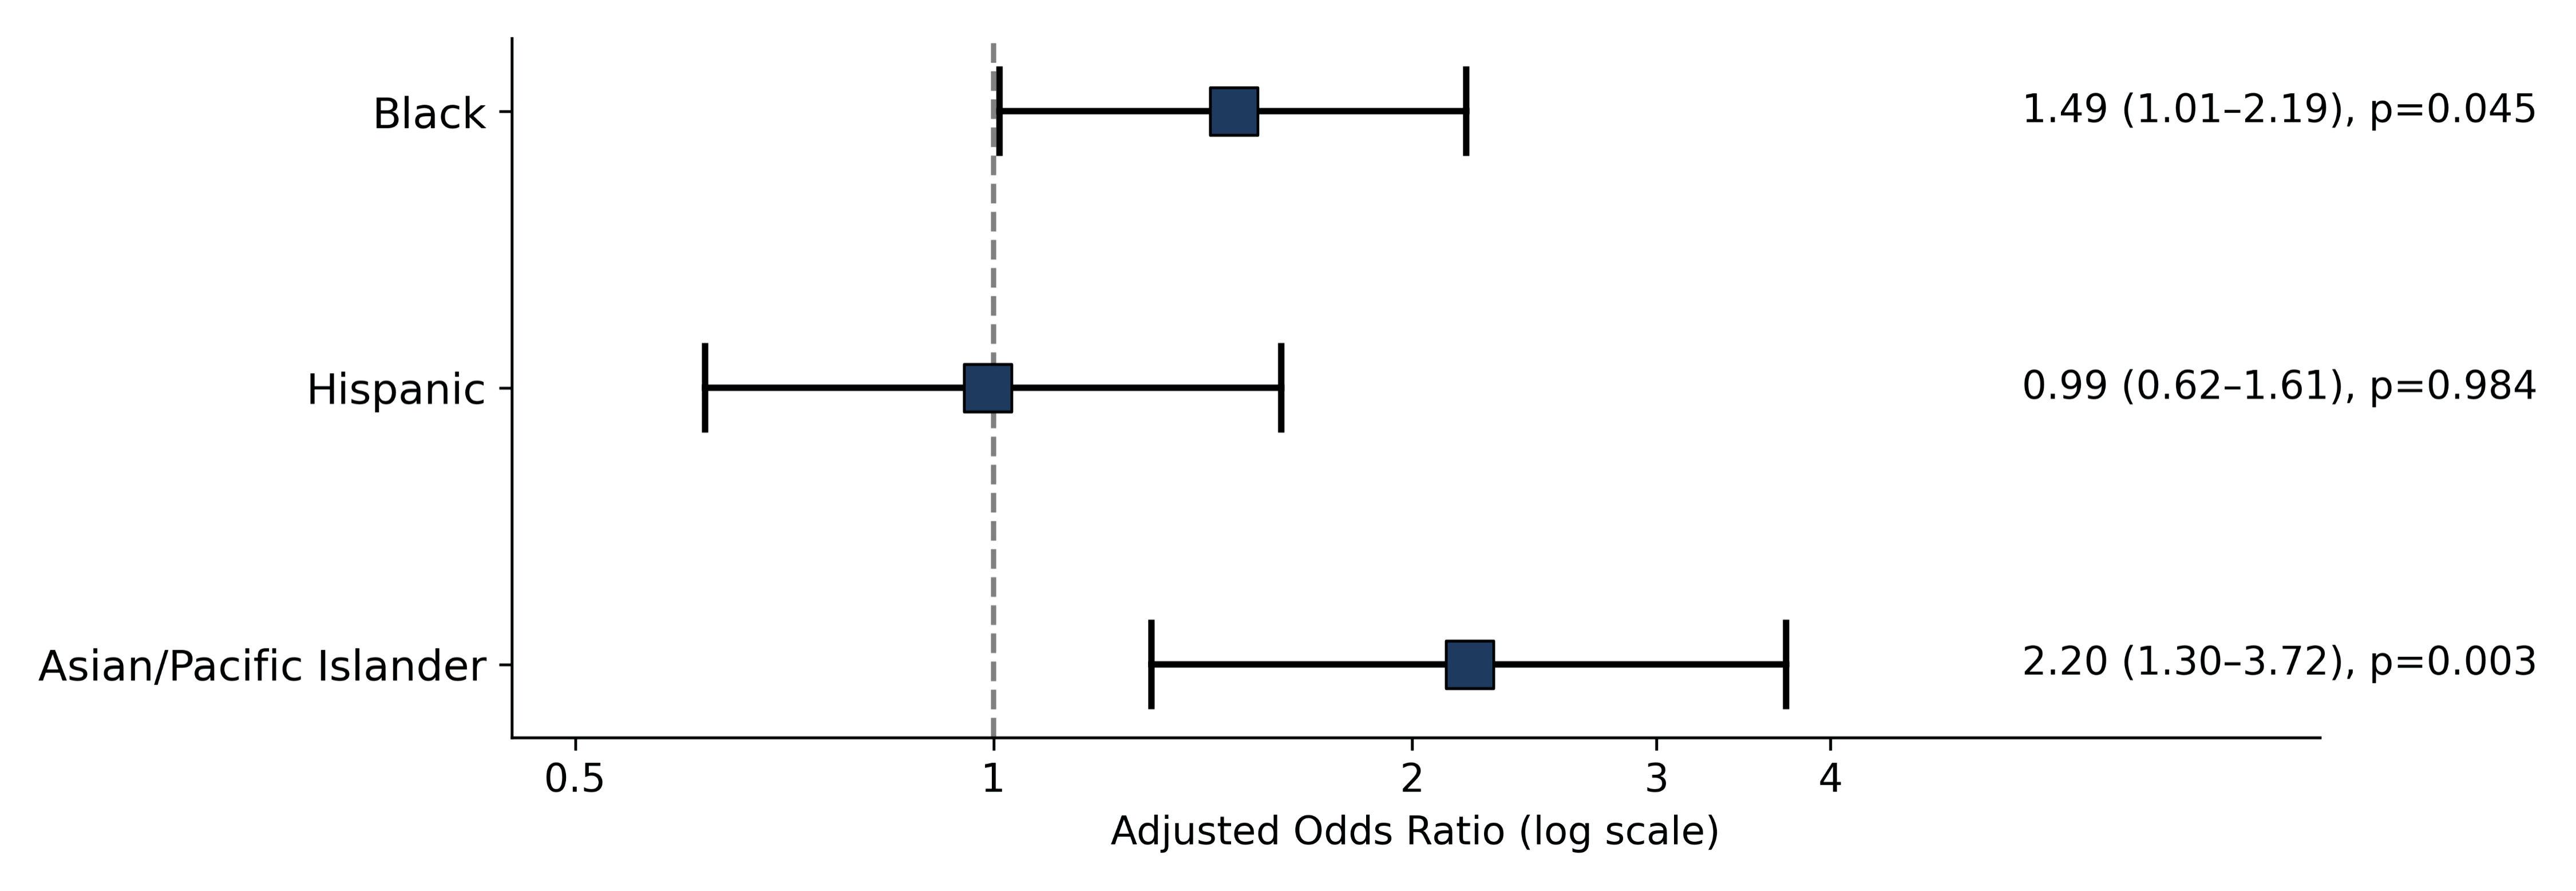
| Black | 1.85 (1.33–2.57) P < 0.001 | 1.89 (1.34–2.65) P < 0.001 | 1.80 (1.27–2.53) P = 0.001 | 1.42 (0.98–2.06) P = 0.060 | 1.49 (1.01–2.19) P = 0.045 |
| Hispanic | 1.48 (0.94–2.33) P = 0.088 | 1.50 (0.95–2.36) P = 0.083 | 1.43 (0.90–2.27) P = 0.127 | 1.36 (0.85–2.16) P = 0.199 | 0.99 (0.62–1.61) P = 0.984 |
| Asian/PI | 1.99 (1.20–3.29) P = 0.007 | 2.48 (1.48–4.16) P < 0.001 | 2.57 (1.51–4.37) P < 0.001 | 2.52 (1.47–4.33) P = 0.001 | 2.20 (1.30–3.72) P = 0.003 |
| Race | Mean LOS (days) | Adjusted IRR (95% CI) | Mean charges ($) | Adjusted ratio (95% CI) | P value |
|---|---|---|---|---|---|
| PI: Pacific Islander; IRR: incidence rate ratio; LOS: length of stay; CI: confidence interval. | |||||
| White | 5.6 | Reference | 212,715 | Reference | — |
| Black | 7.9 | 1.06 (1.01–1.12) | 255,844 | 1.07 (1.02–1.11) | 0.011/0.002 |
| Hispanic | 7.2 | 1.07 (1.01–1.14) | 292,812 | 1.19 (1.14–1.25) | 0.016/< 0.001 |
| Asian/PI | 6.4 | 1.03 (0.98–1.09) | 283,508 | 1.08 (1.03–1.14) | 0.274/0.002 |
| Race | Late presentation (unadjusted %) | Composite OR (95% CI) | Nonelective OR (95% CI) | ED arrival OR (95% CI) |
|---|---|---|---|---|
| PI: Pacific Islander; CI: confidence interval; OR: odds ratio. | ||||
| White | 13% | Reference | Reference | Reference |
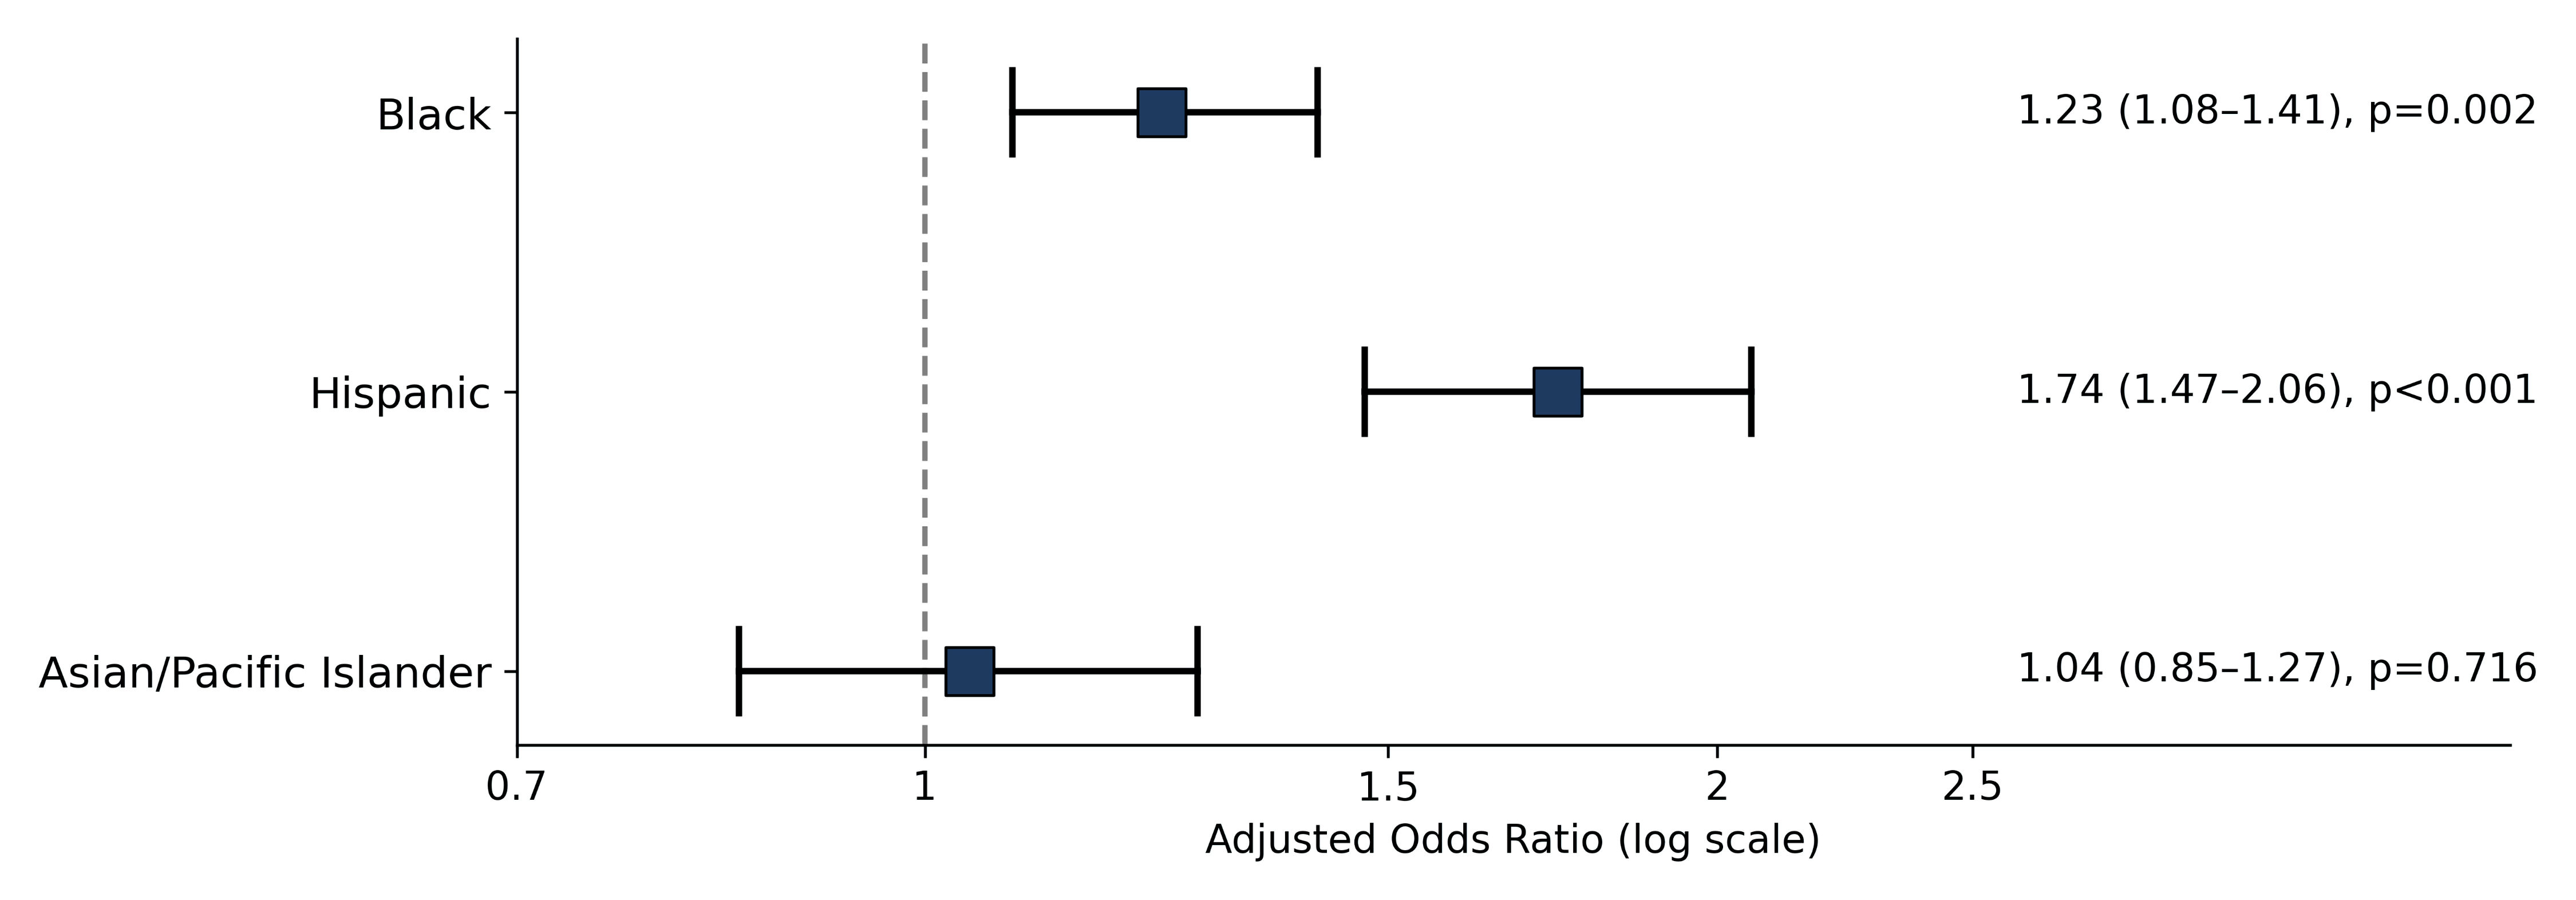
| Black | 24% | 1.23 (1.08–1.41) P = 0.002 | 1.25 (1.10–1.43) P = 0.001 | 1.26 (1.02–1.54) P = 0.031 |
| Hispanic | 27% | 1.74 (1.47–2.06) P < 0.001 | 1.76 (1.48–2.08) P < 0.001 | 1.36 (1.06–1.75) P = 0.016 |
| Asian/PI | 16% | 1.04 (0.85–1.27) P = 0.716 | 1.06 (0.86–1.29) P = 0.600 | 0.76 (0.50–1.15) P = 0.188 |
| Analysis | Black OR (95% CI) | Asian/PI OR (95% CI) | N |
|---|---|---|---|
| PI: Pacific Islander; CI: confidence interval; OR: odds ratio. | |||
| Primary analysis (fully adjusted) | 1.49 (1.01–2.19), P = 0.045 | 2.20 (1.30–3.72), P = 0.003 | 26,076 |
| Large hospitals (bedsize 3) only | 1.72 (1.11–2.68), P = 0.016 | 2.42 (1.36–4.30), P = 0.003 | 19,092 |
| Teaching hospitals only | 1.47 (0.98–2.21), P = 0.065 | 1.82 (1.04–3.21), P = 0.037 | 24,089 |
| Severe heart failure subgroup | 1.84 (1.21–2.78), P = 0.004 | 1.94 (1.05–3.60), P = 0.036 | 8,292 |
| Non-severe heart failure subgroup | 1.26 (0.48–3.27), P = 0.640 | 2.41 (0.92–6.31), P = 0.072 | 18,161 |
| Race-as-treatment IPTW (Black vs White) | 1.29 (0.63–2.61), P = 0.483 | Not applicable | 23,892 |
| Procedure | Race | Mortality, % | Adjusted OR (95% CI) | P value |
|---|---|---|---|---|
| TEER: transcatheter edge-to-edge repair; PI: Pacific Islander; CI: confidence interval; OR: odds ratio. | ||||
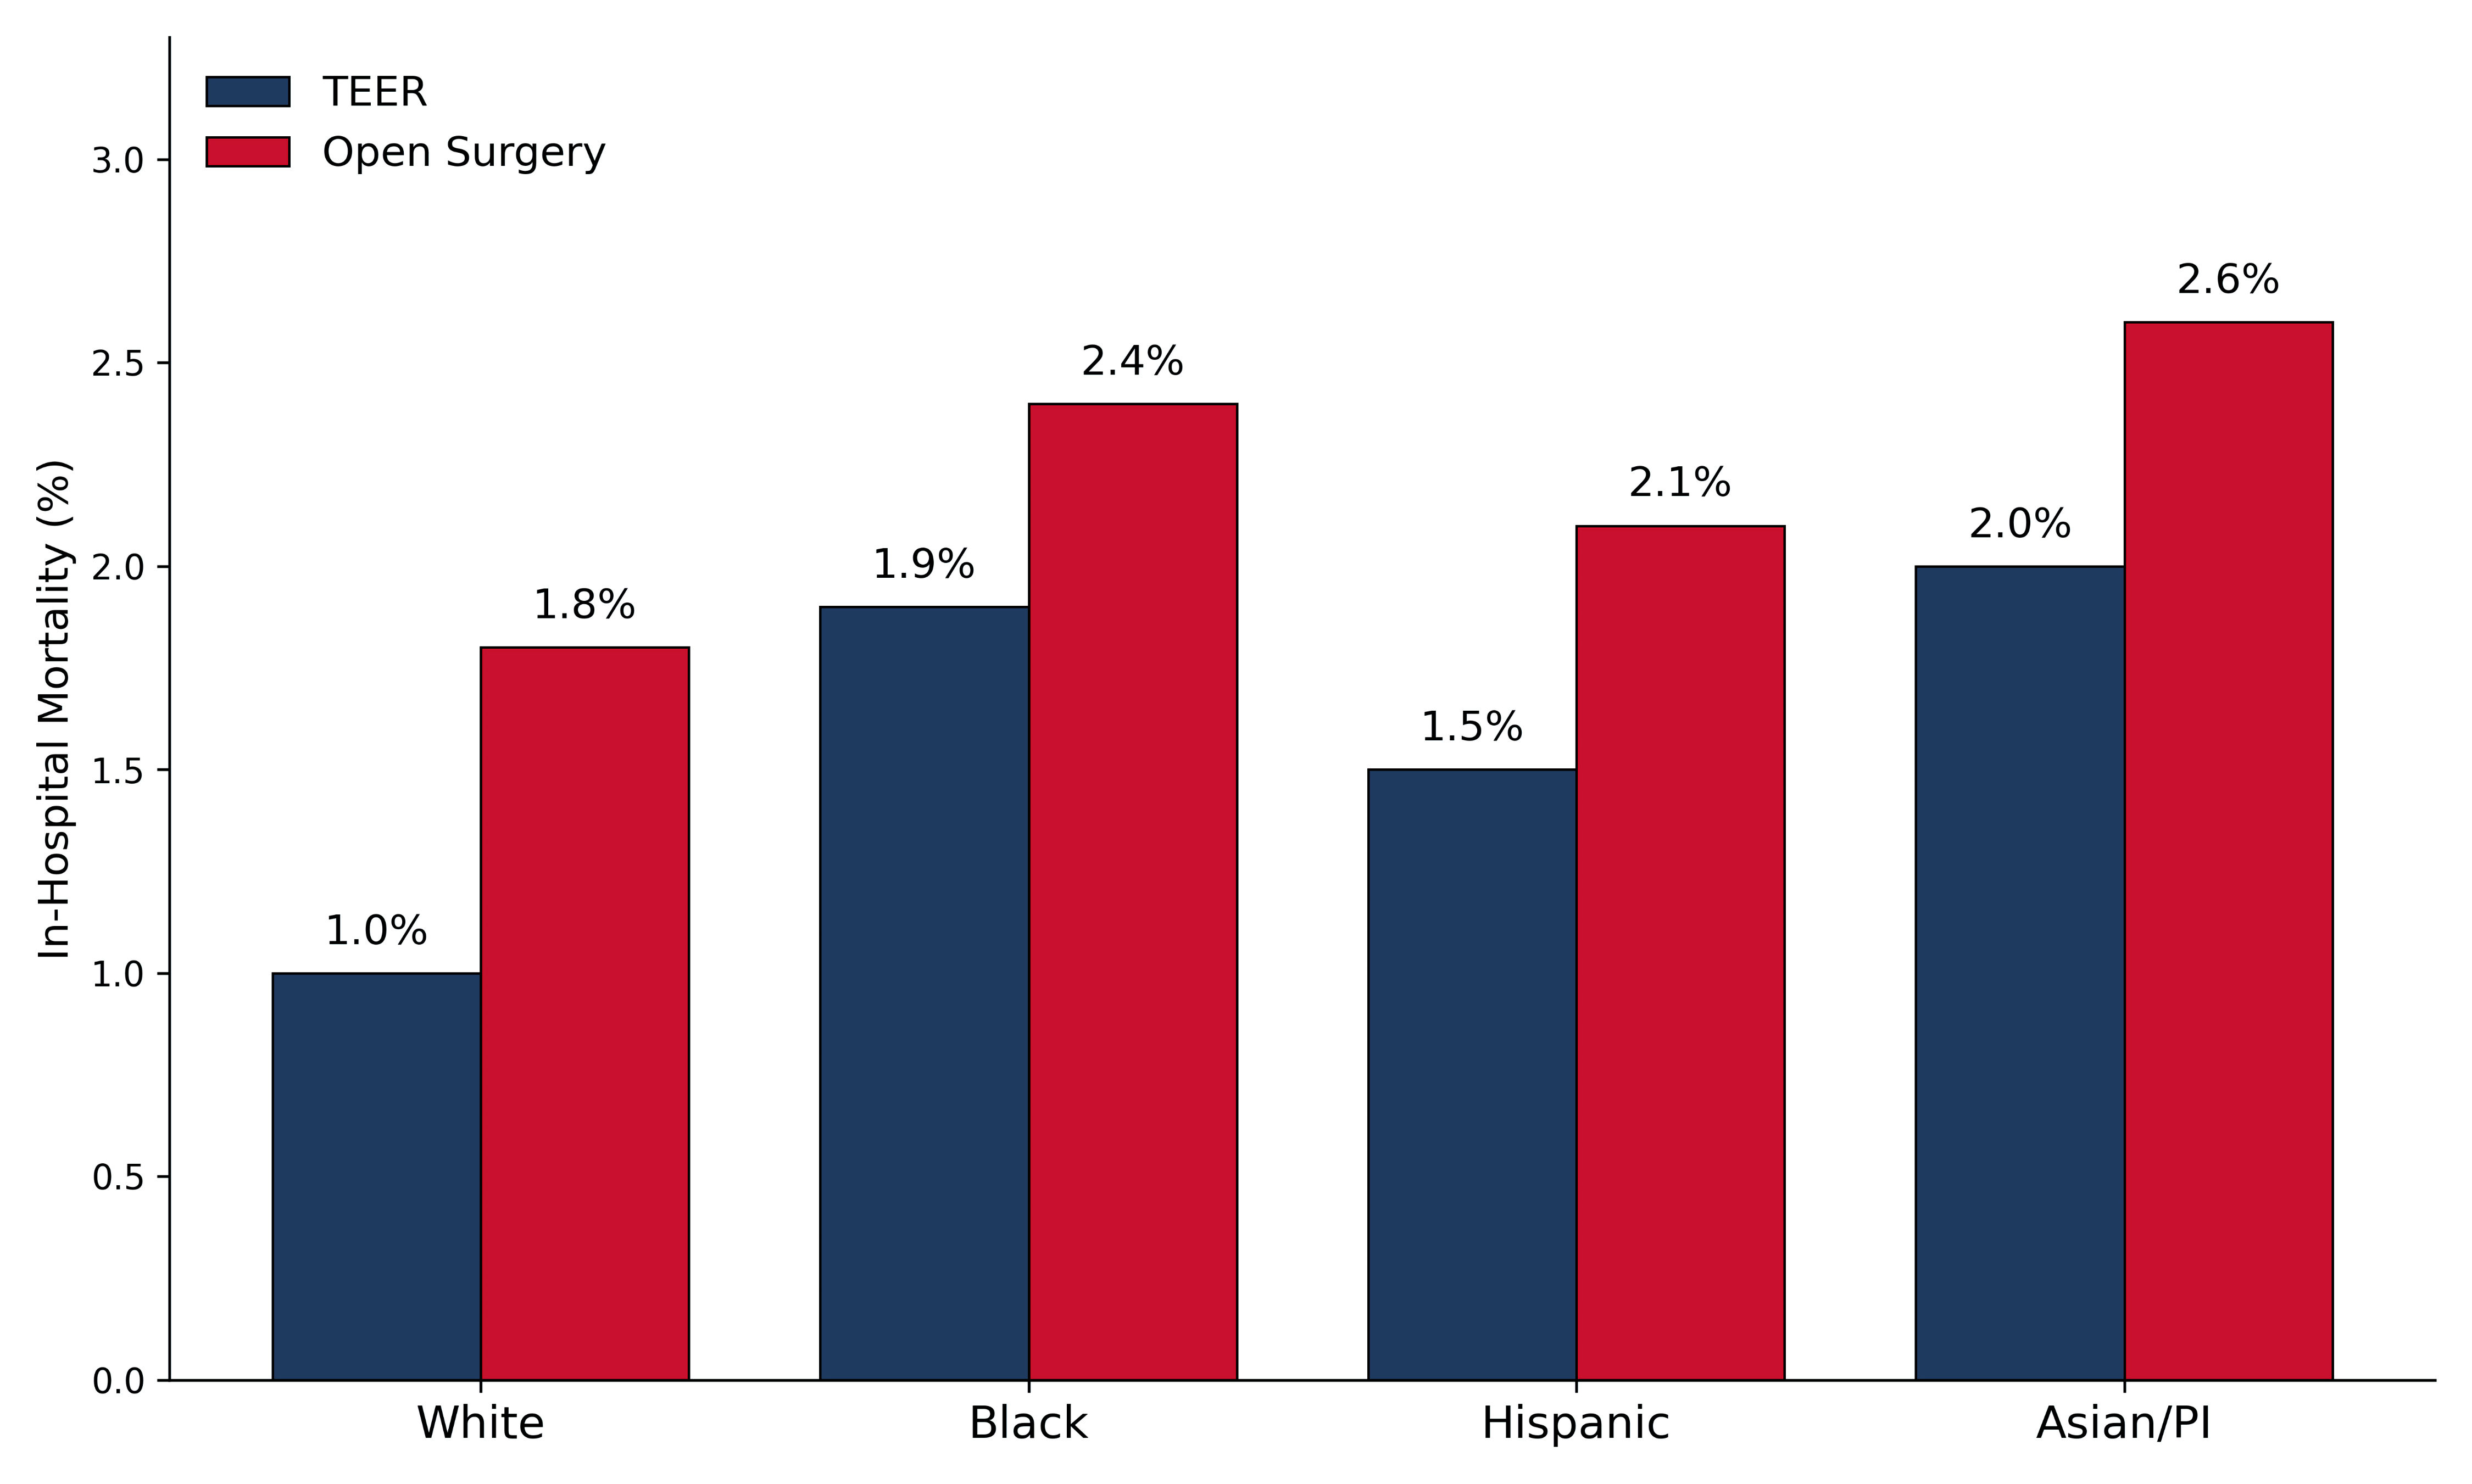
| TEER | White | 1.0 | Reference | — |
| Black | 1.9 | 1.56 (1.02–2.36) | 0.038 | |
| Hispanic | 1.5 | 1.06 (0.64–1.76) | 0.824 | |
| Asian/PI | 2.0 | 1.96 (1.09–3.52) | 0.024 | |
| Open surgery | White | 1.8 | Reference | — |
| Black | 2.4 | 2.41 (0.98–5.95) | 0.056 | |
| Hispanic | 2.1 | 1.56 (0.45–5.48) | 0.485 | |
| Asian/PI | 2.6 | 2.29 (0.62–8.51) | 0.216 | |