Figures
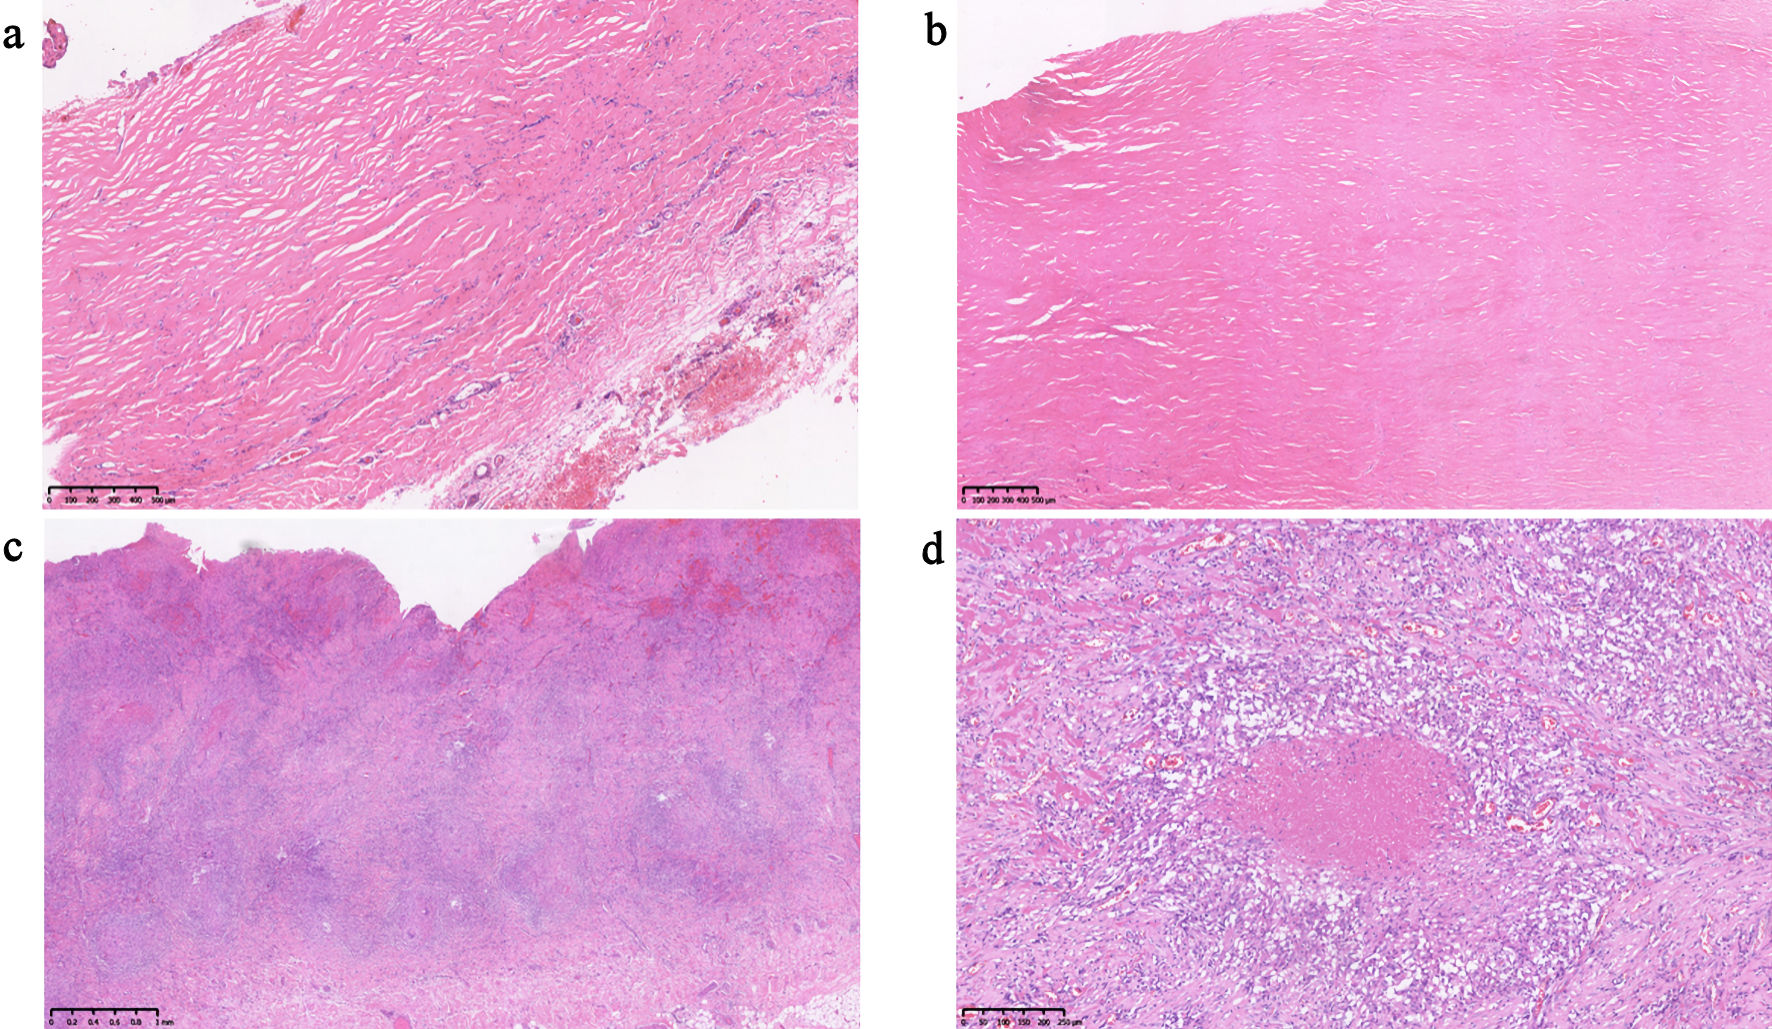
↓ Figure 1. Hematoxylin and eosin (H&E) stained sections of patients with chronic constrictive pericarditis. (a, b) Microscopic findings of pericardial tissue sections from patients with nonspecific pericarditis (scale bars = 500 µm for both). (c, d) Microscopic findings of pericardial tissue sections from patients with tuberculous pericarditis (scale bars = 1 mm and 250 µm, respectively).
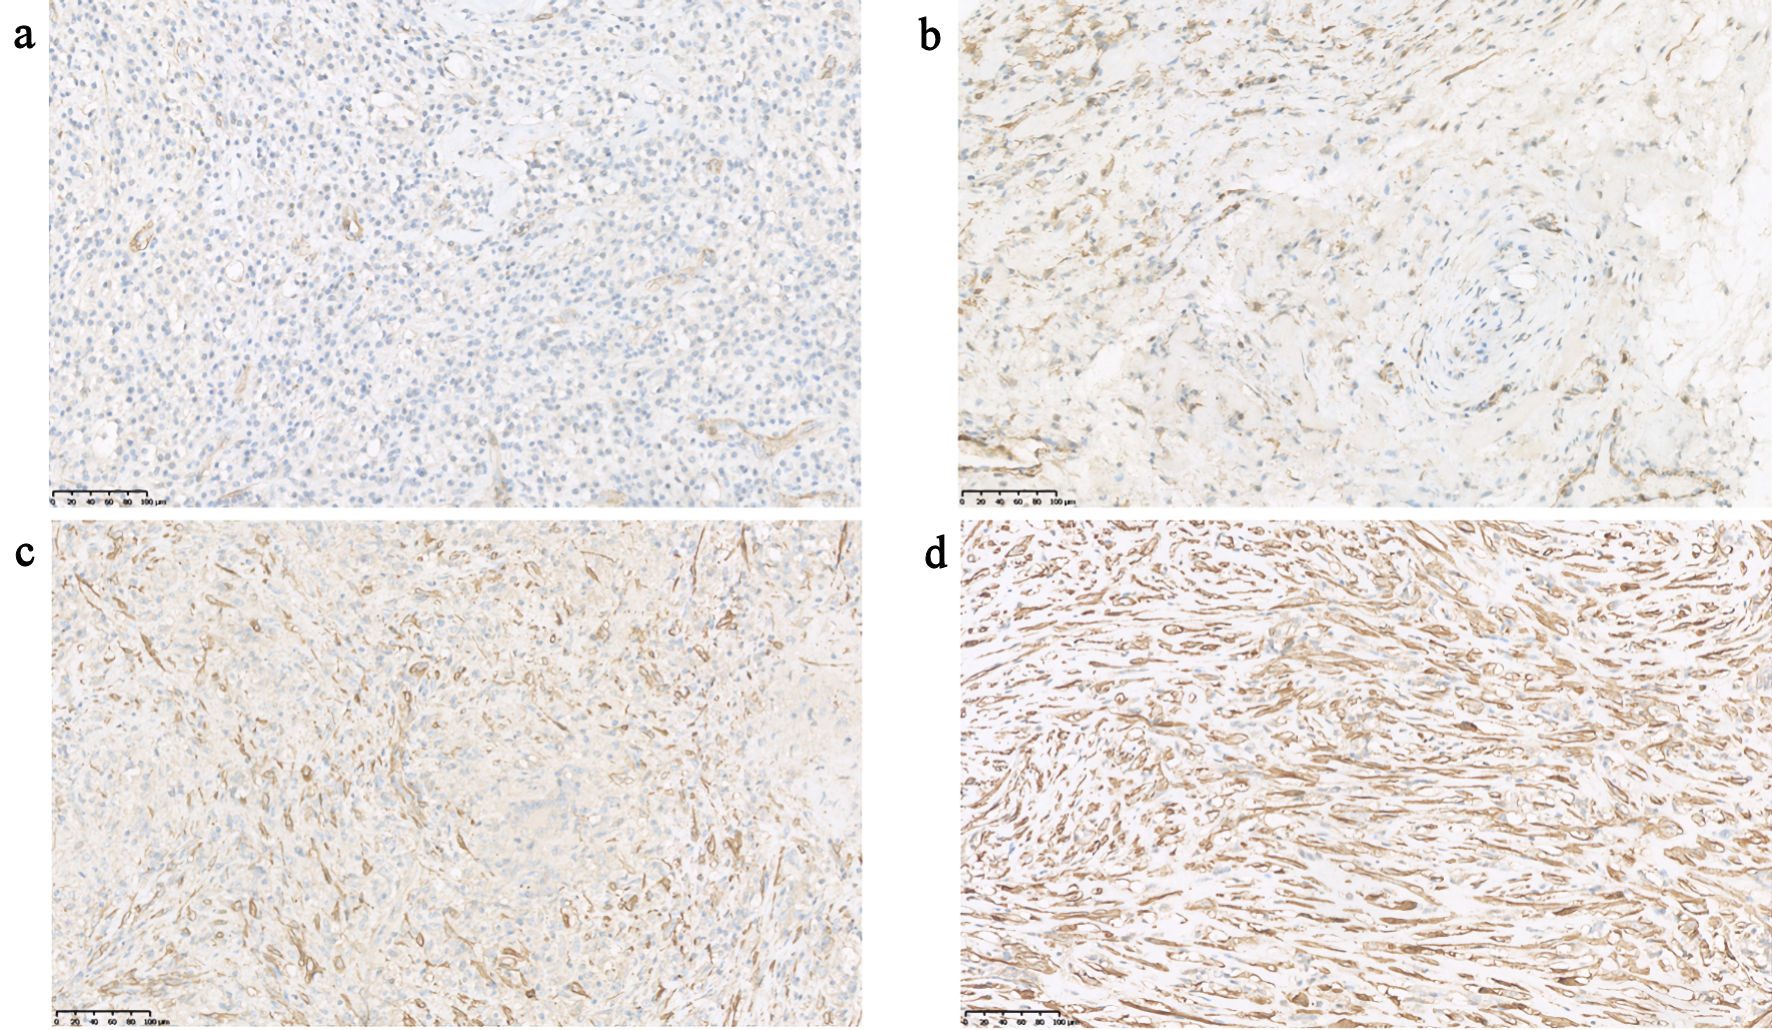
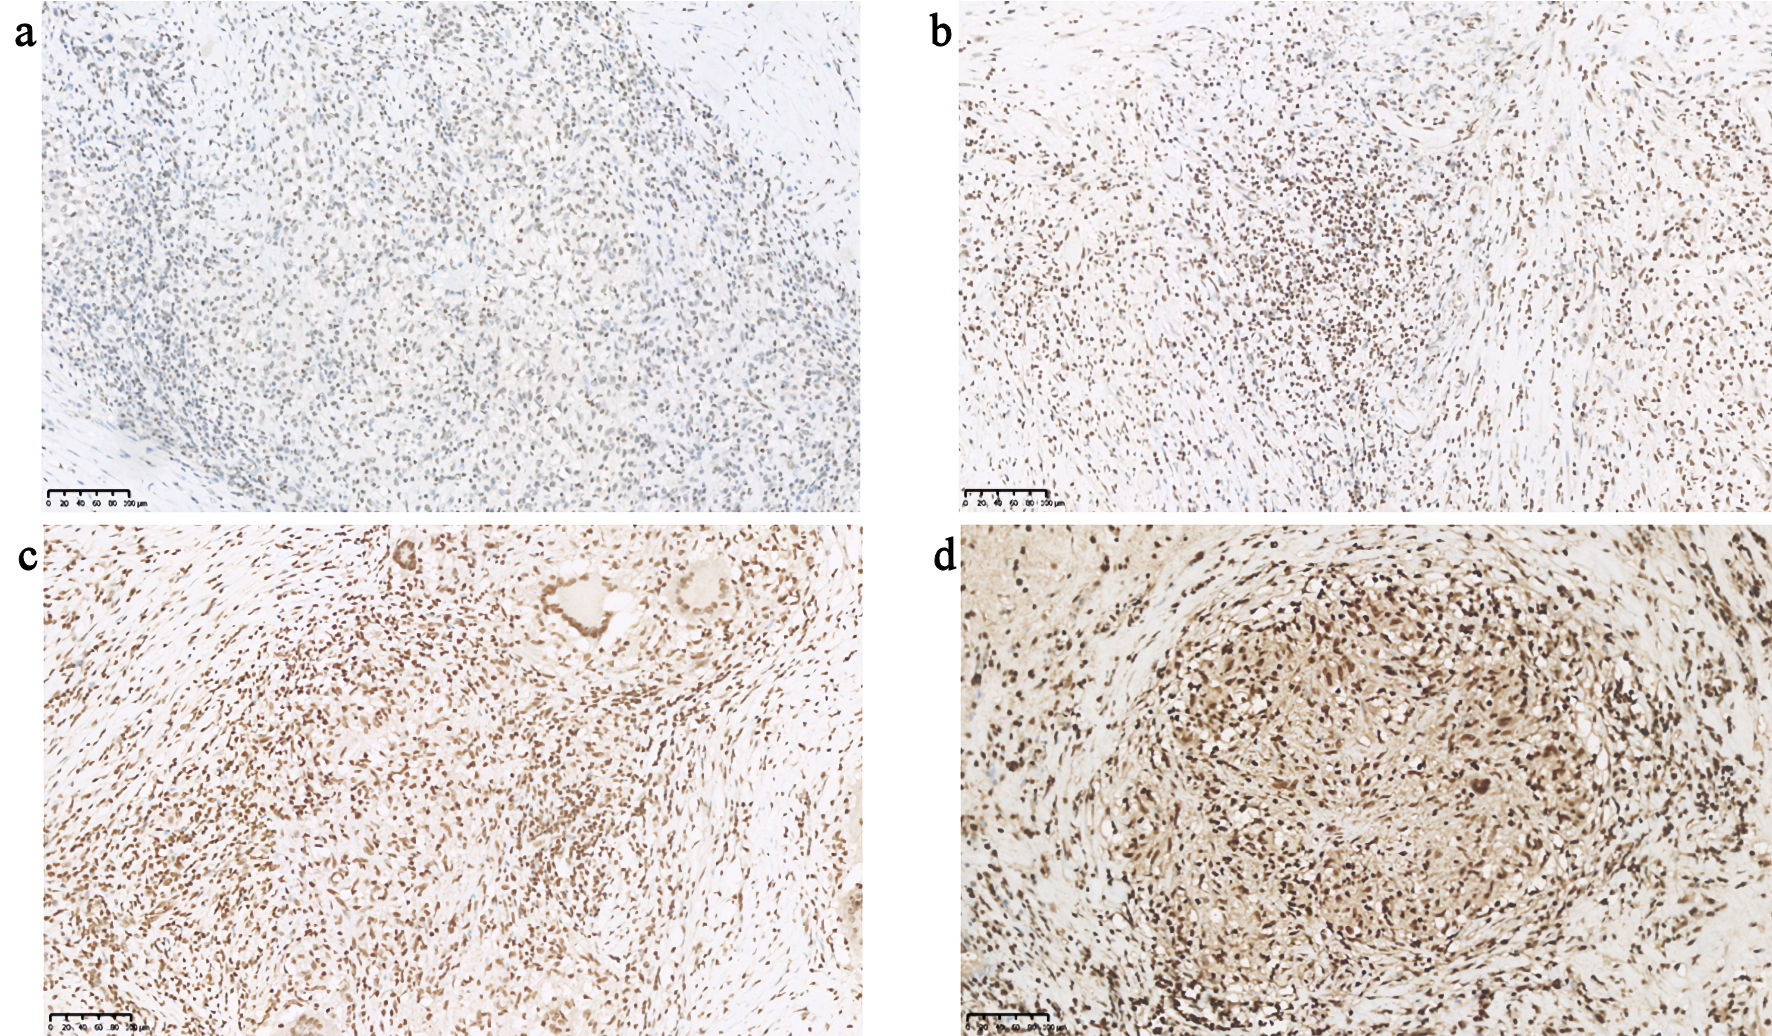
↓ Figure 2. Expression of α-SMA in pericardial tissue from different patients (scale bars = 100 µm for all panels). α-SMA: α-smooth muscle actin.
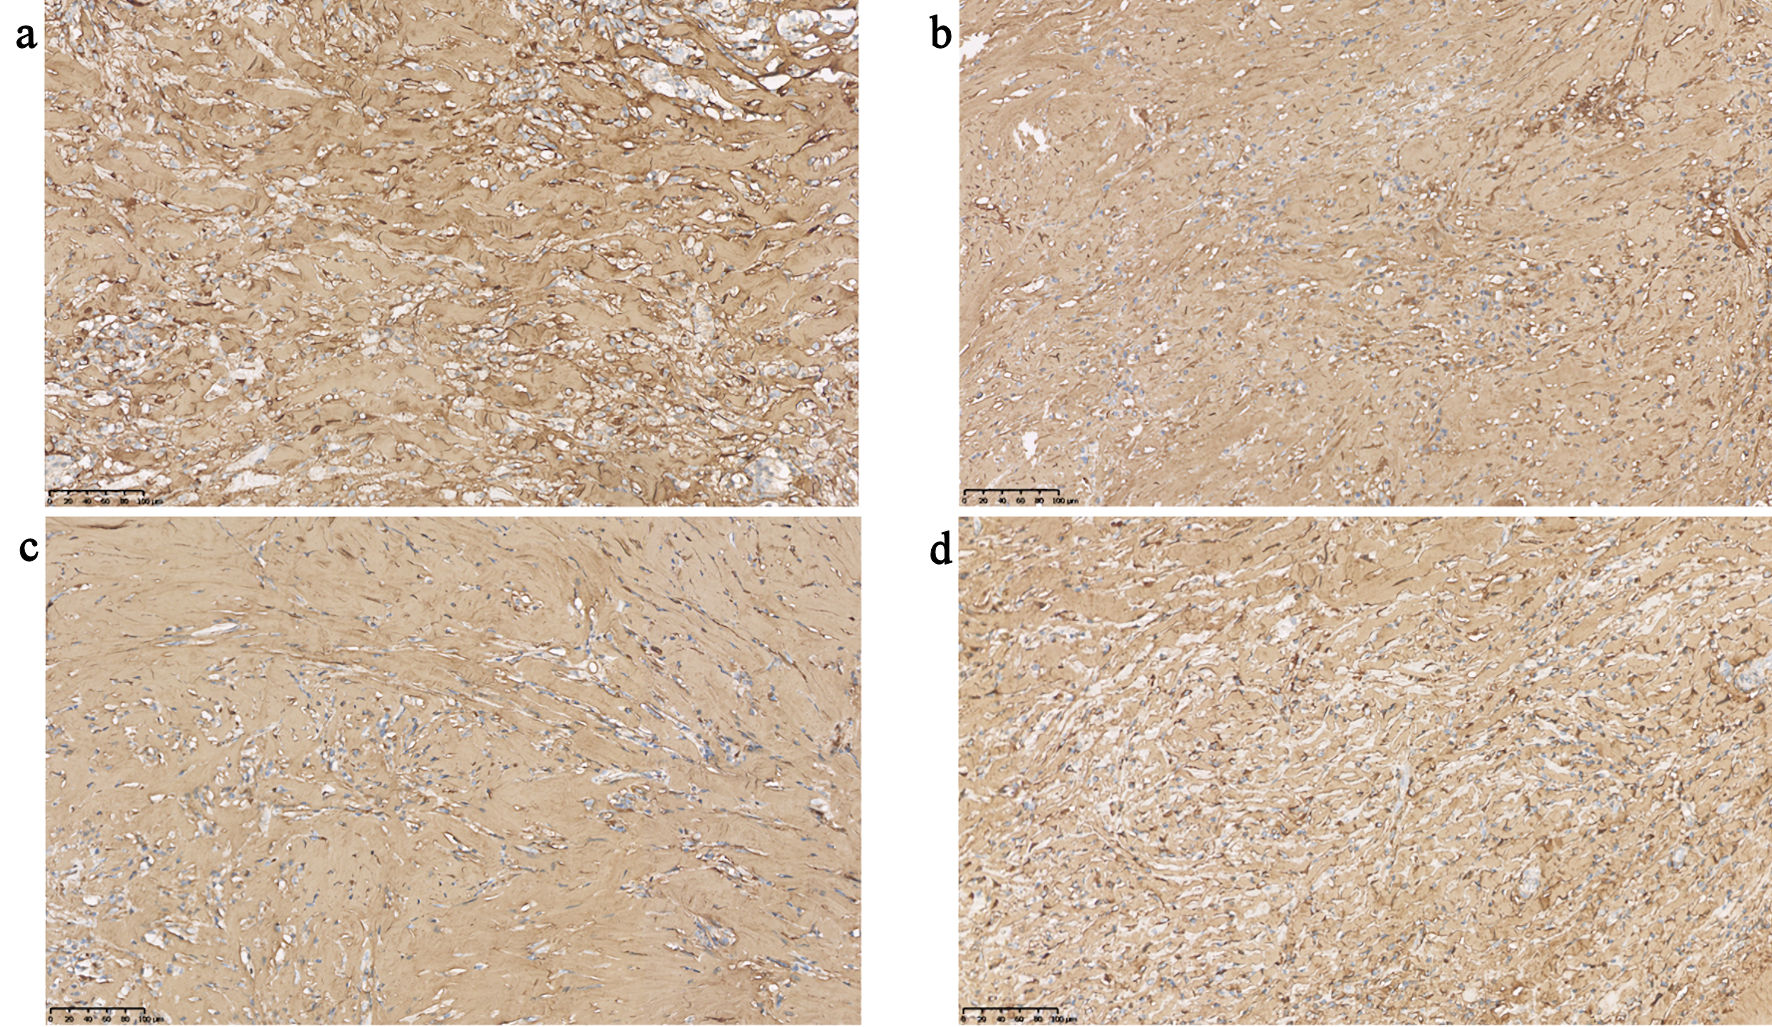
↓ Figure 3. Expression of Col-III in pericardial tissue from different patients (scale bars = 100 µm for all panels). Col-III: collagen III.
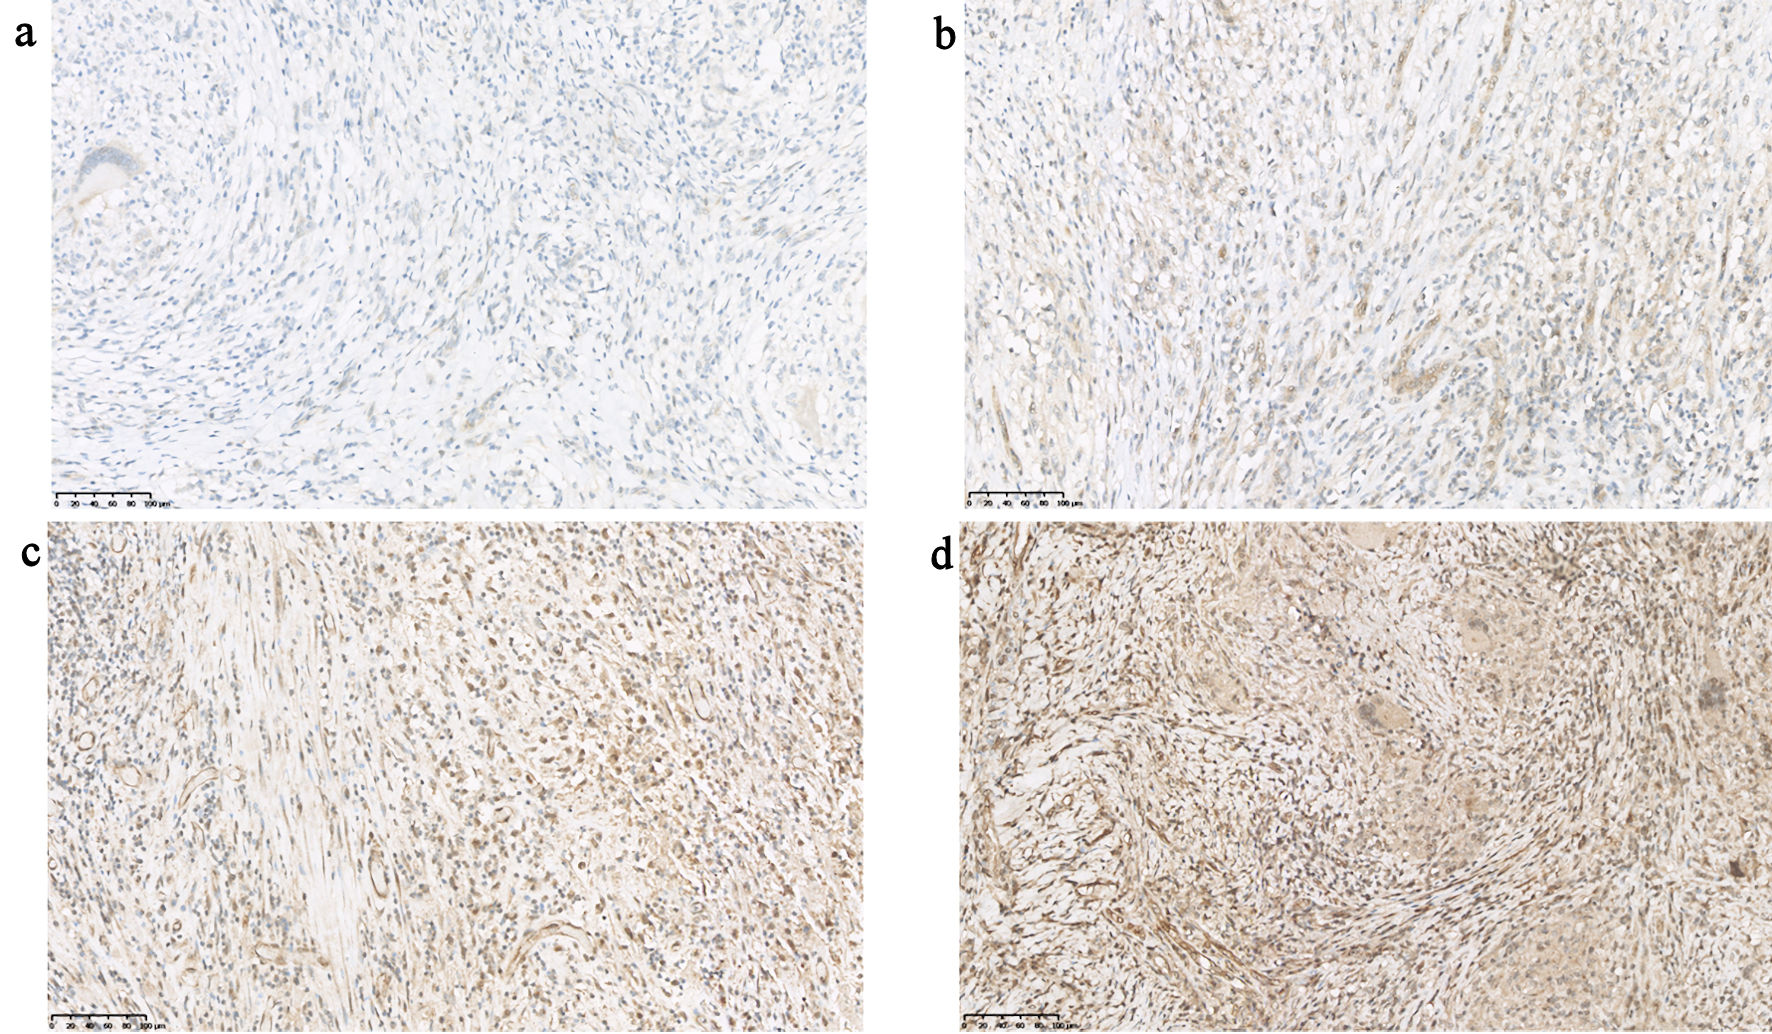
↓ Figure 4. Expression of TLR4 in pericardial tissue from different patients (scale bars = 100 µm for all panels). TLR4: toll-like receptor 4.
↓ Figure 5. Expression of HMGB1 in pericardial tissue from different patients (scale bars = 100 µm for all panels). HMGB1: high-mobility group box 1.
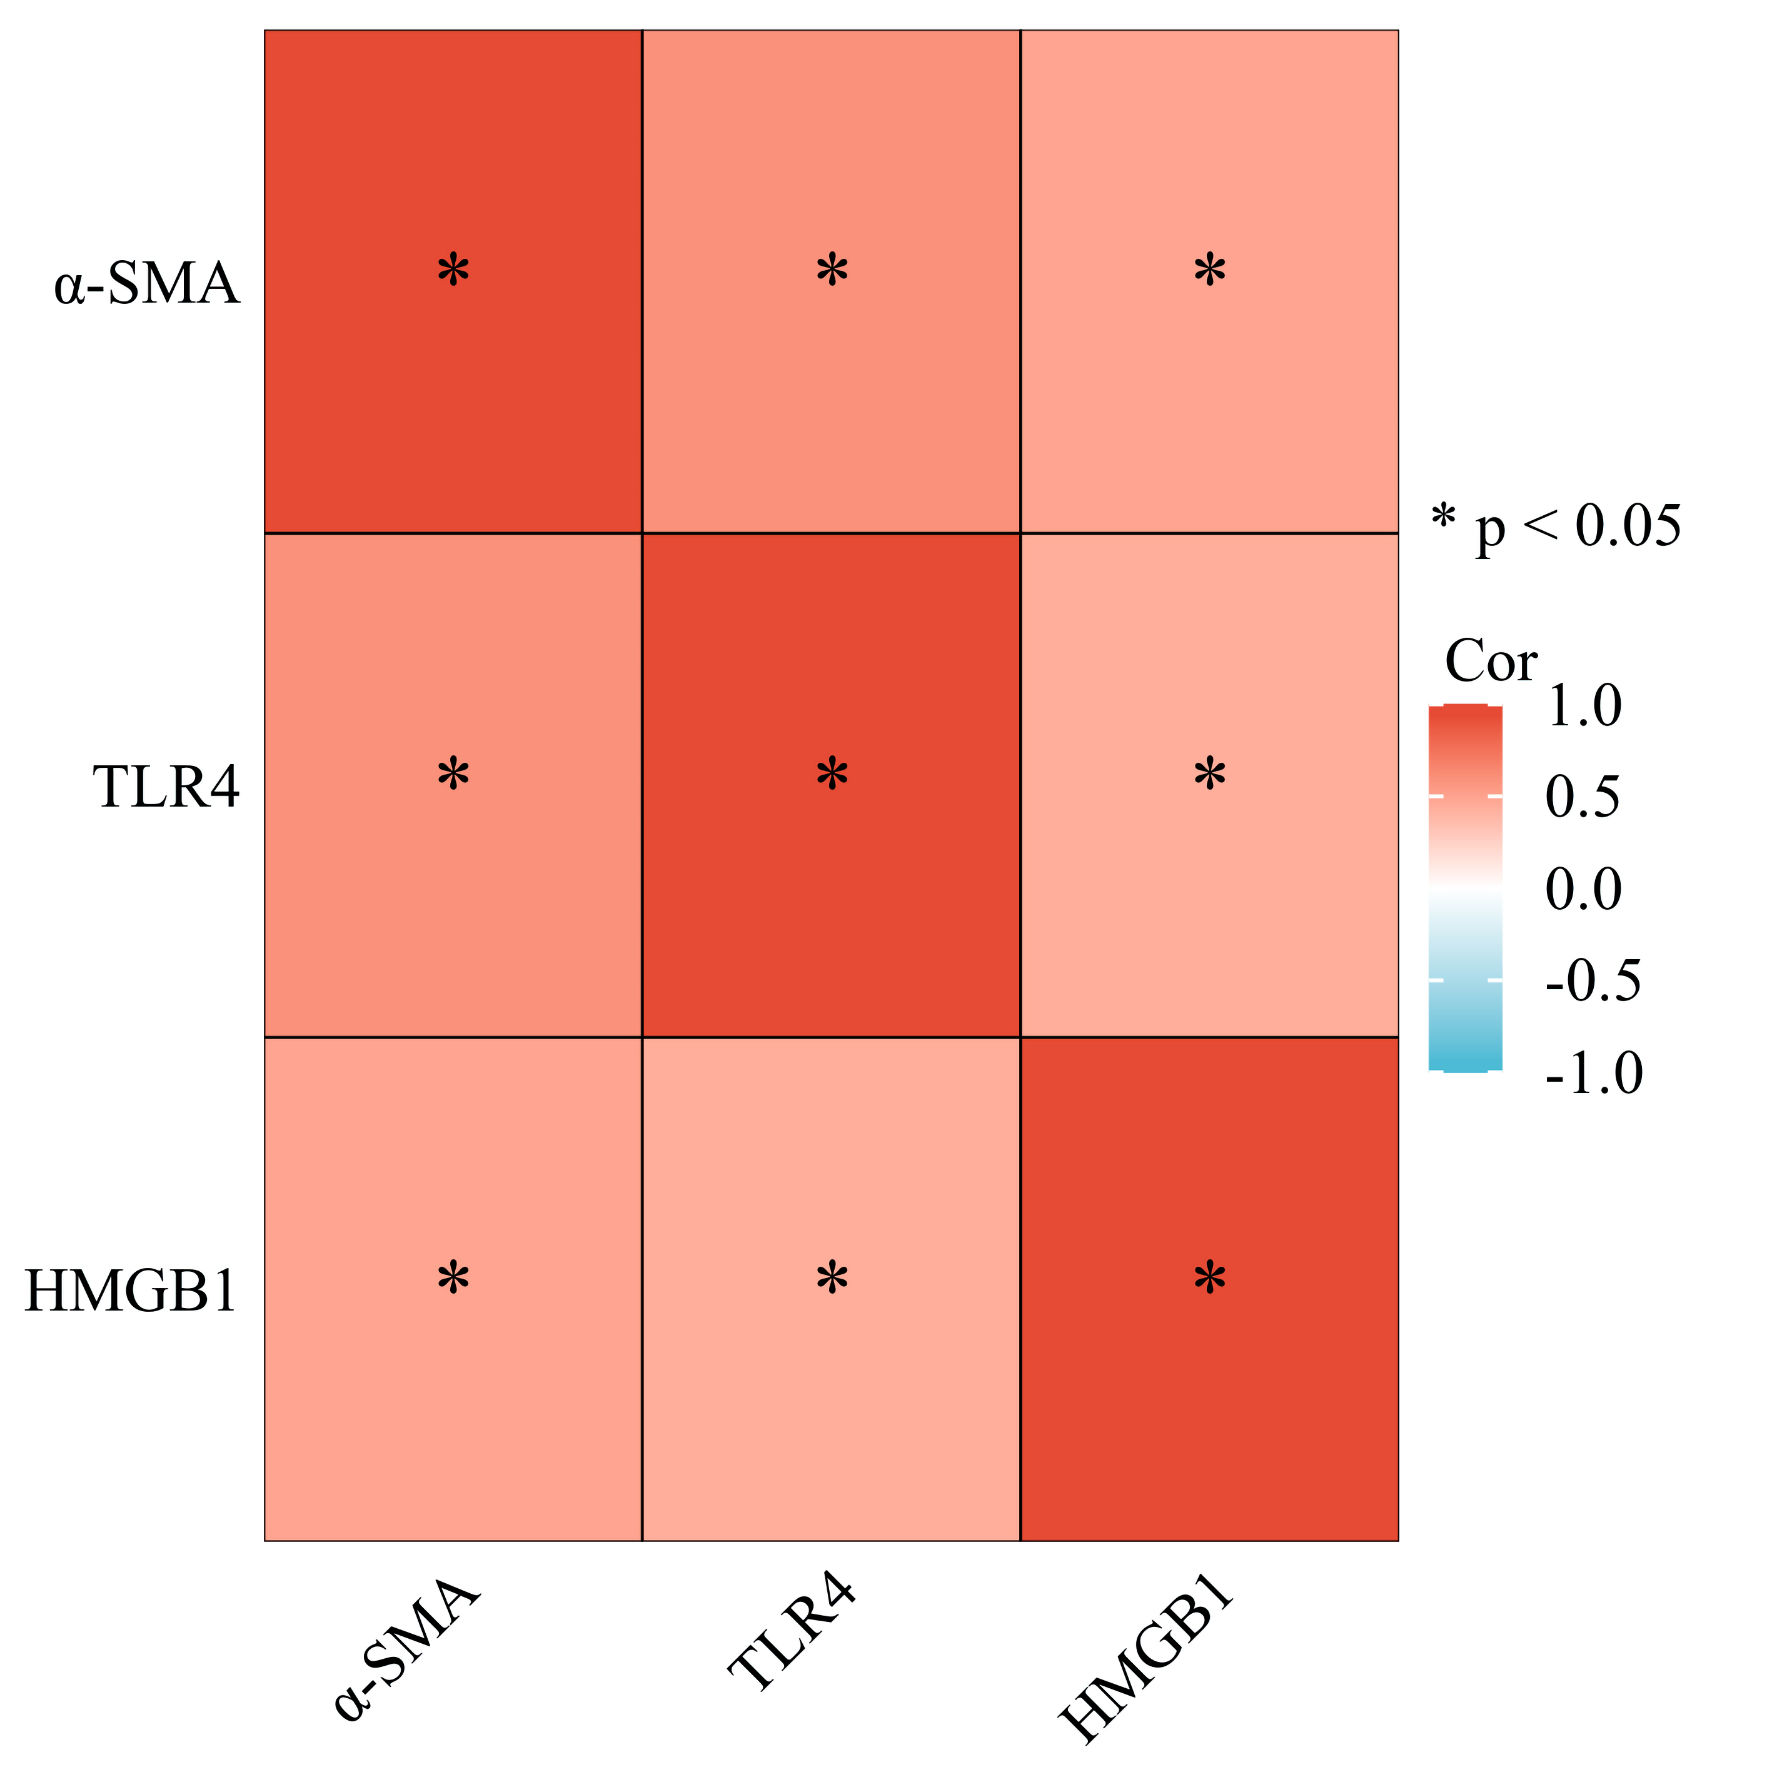
↓ Figure 6. Association between TLR4, HMGB1 and α-SMA. TLR4: toll-like receptor 4; α-SMA: α-smooth muscle actin; HMGB1: high-mobility group box 1.
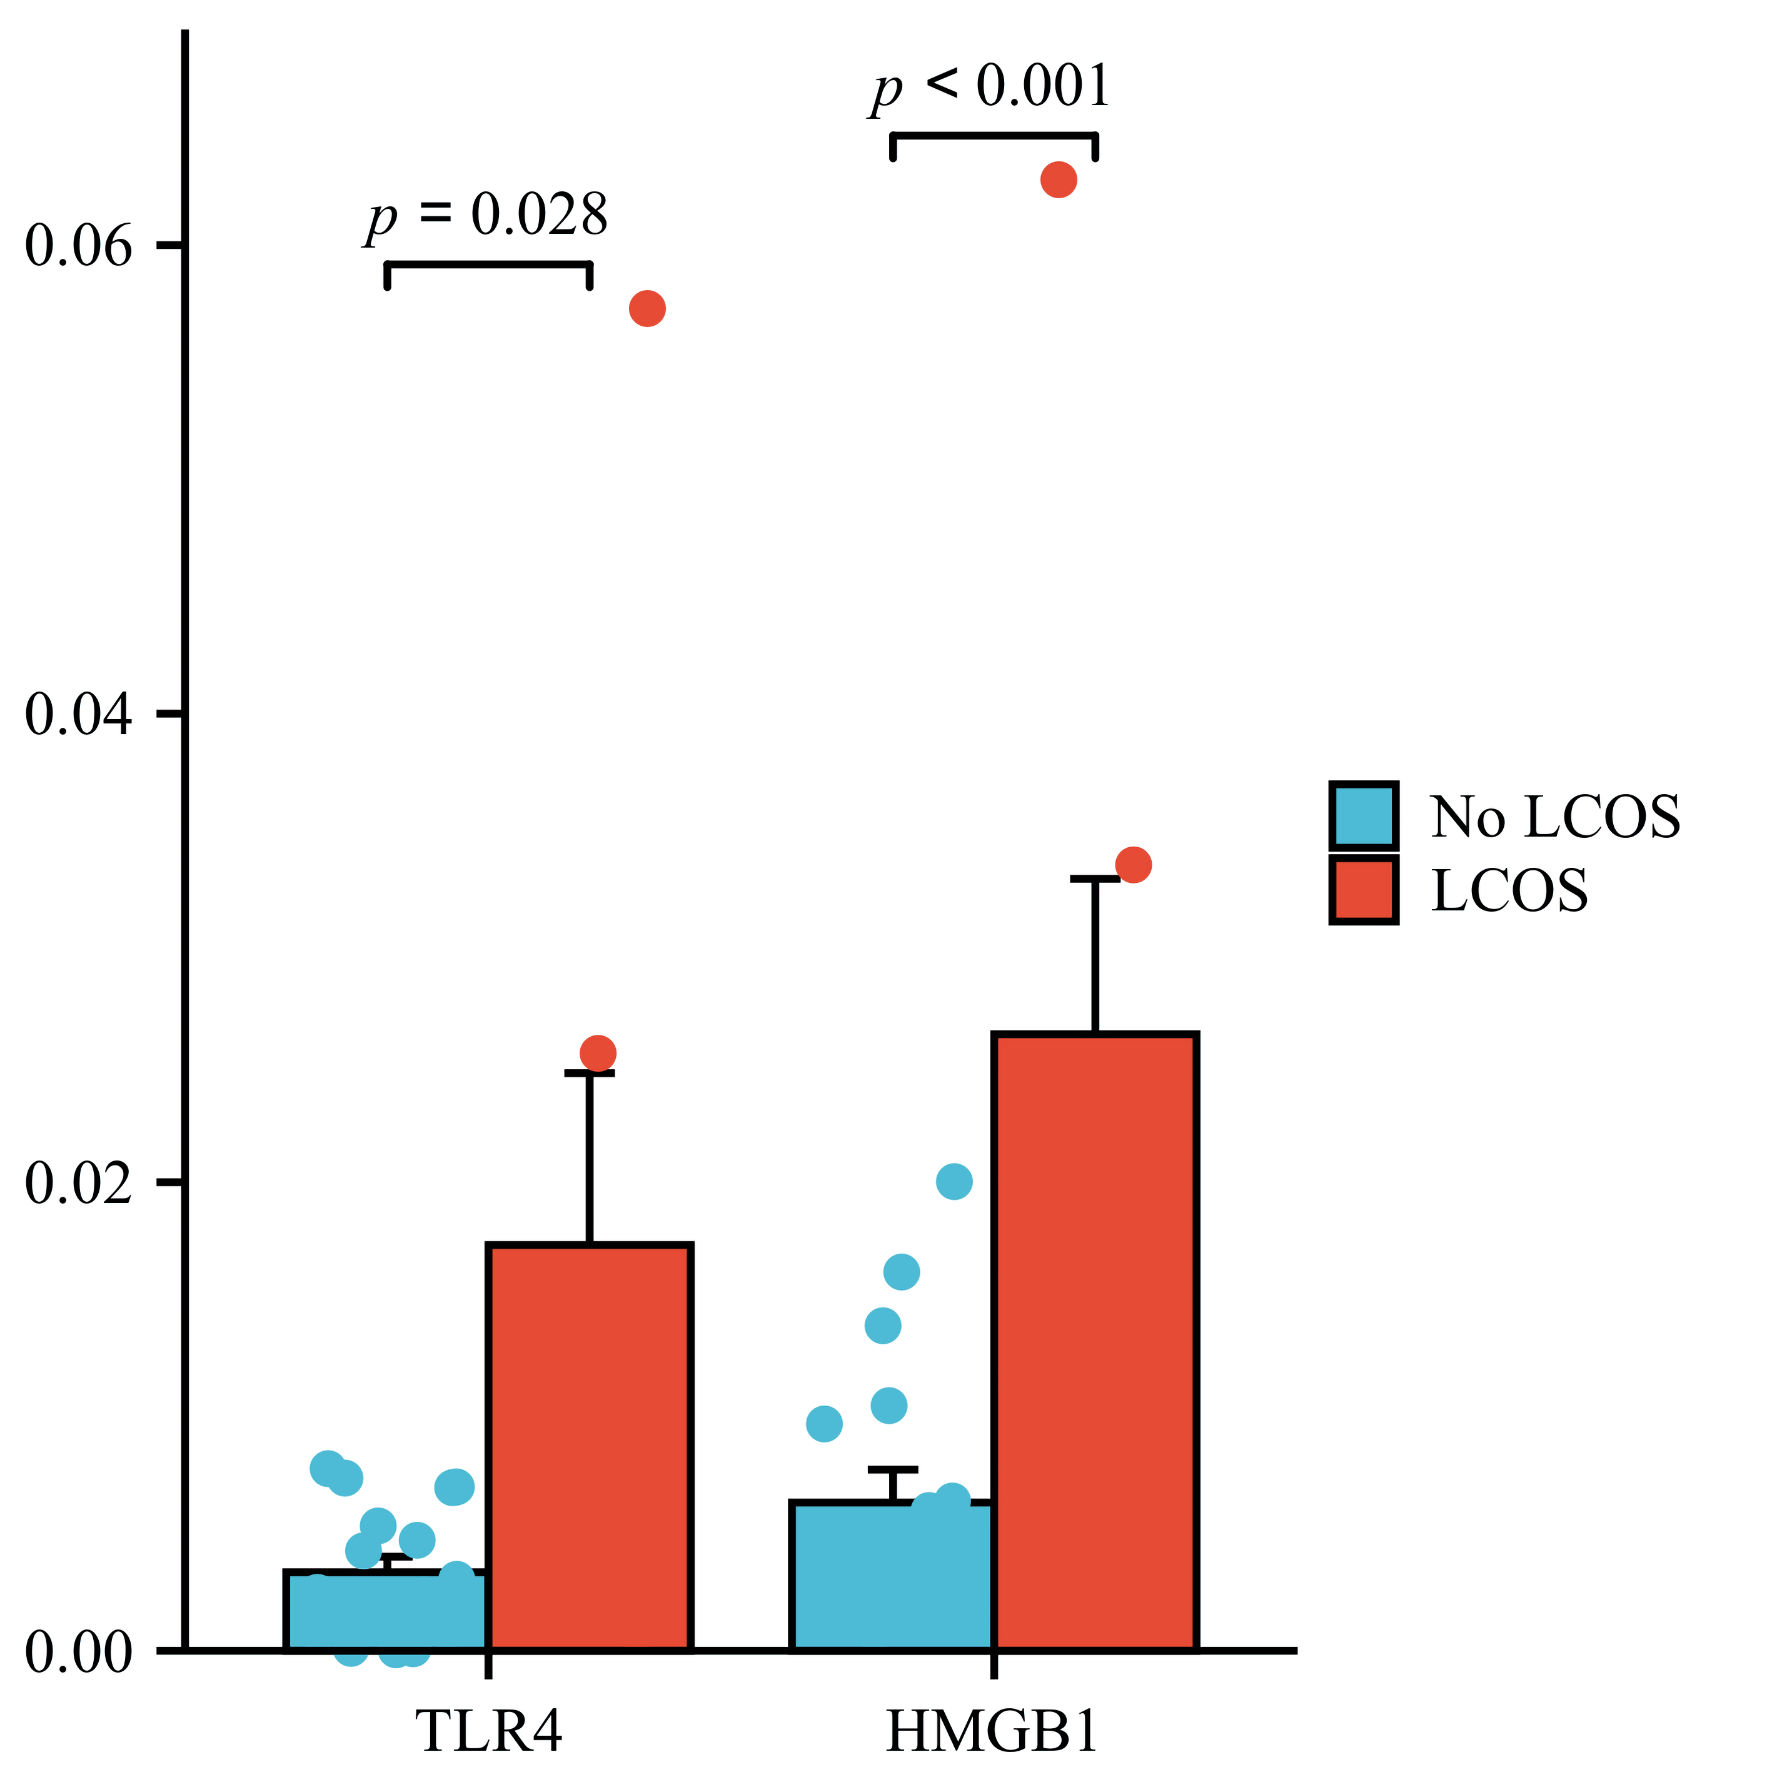
↓ Figure 7. Expression of TLR4 and HMGB1 in patients with and without postoperative LCOS. LCOS: low cardiac output syndrome; TLR4: toll-like receptor 4; HMGB1: high-mobility group box 1.
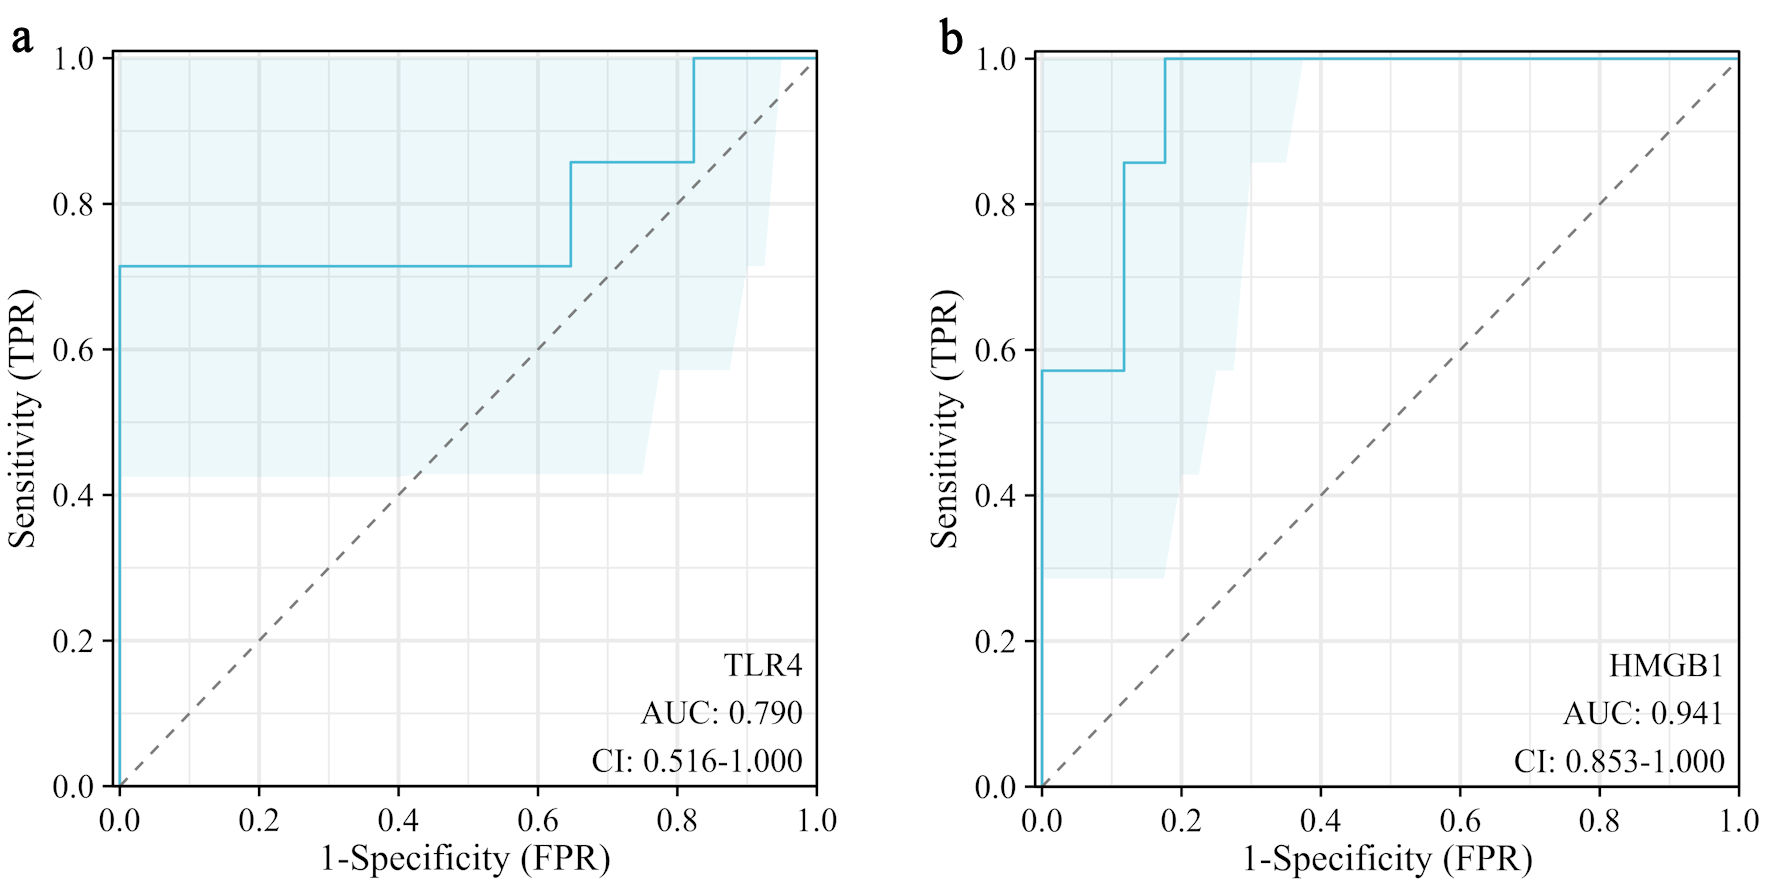
↓ Figure 8. ROC curve of TLR4 (a) and HMGB1 (b) for predicting postoperative LCOS. LCOS: low cardiac output syndrome; TLR4: toll-like receptor 4; HMGB1: high-mobility group box 1; ROC: receiver operating characteristic; AUC: area under the curve; CI: confidence interval; FPR: false positive rate.
Table
↓ Table 1. Clinical Characteristics of the Study Population
| Variables | N = 24 |
|---|
| Values presented as n (percentage) for categorical variables and median (range) for continuous variables. NYHA: New York Heart Association; BMI: body mass index; CVP: central venous pressure; LVEF: left ventricular ejection fraction (measured on echocardiogram); LCOS: low cardiac output syndrome. |
| Age, years | 65.5 (18.0–83.0) |
| Sex | |
| Male | 18 (75.0%) |
| Female | 6 (25.0%) |
| Etiology | |
| Tuberculosis | 22 (91.7%) |
| Idiopathic | 2 (8.3%) |
| NYHA functional class | |
| I | 0 (0%) |
| II | 10 (41.7%) |
| III | 11 (45.8%) |
| IV | 3 (12.5%) |
| BMI, kg/m2 | 21.7 (15.6–31.5) |
| CVP, cm H2O | 24.0 (16.0–36.4) |
| Pericardial thickness, mm | 8.6 (3.5–18.4) |
| LVEF, % | 58.3 (42.0–68.6) |
| Postoperative LCOS | 7 (29.2%) |