Figures
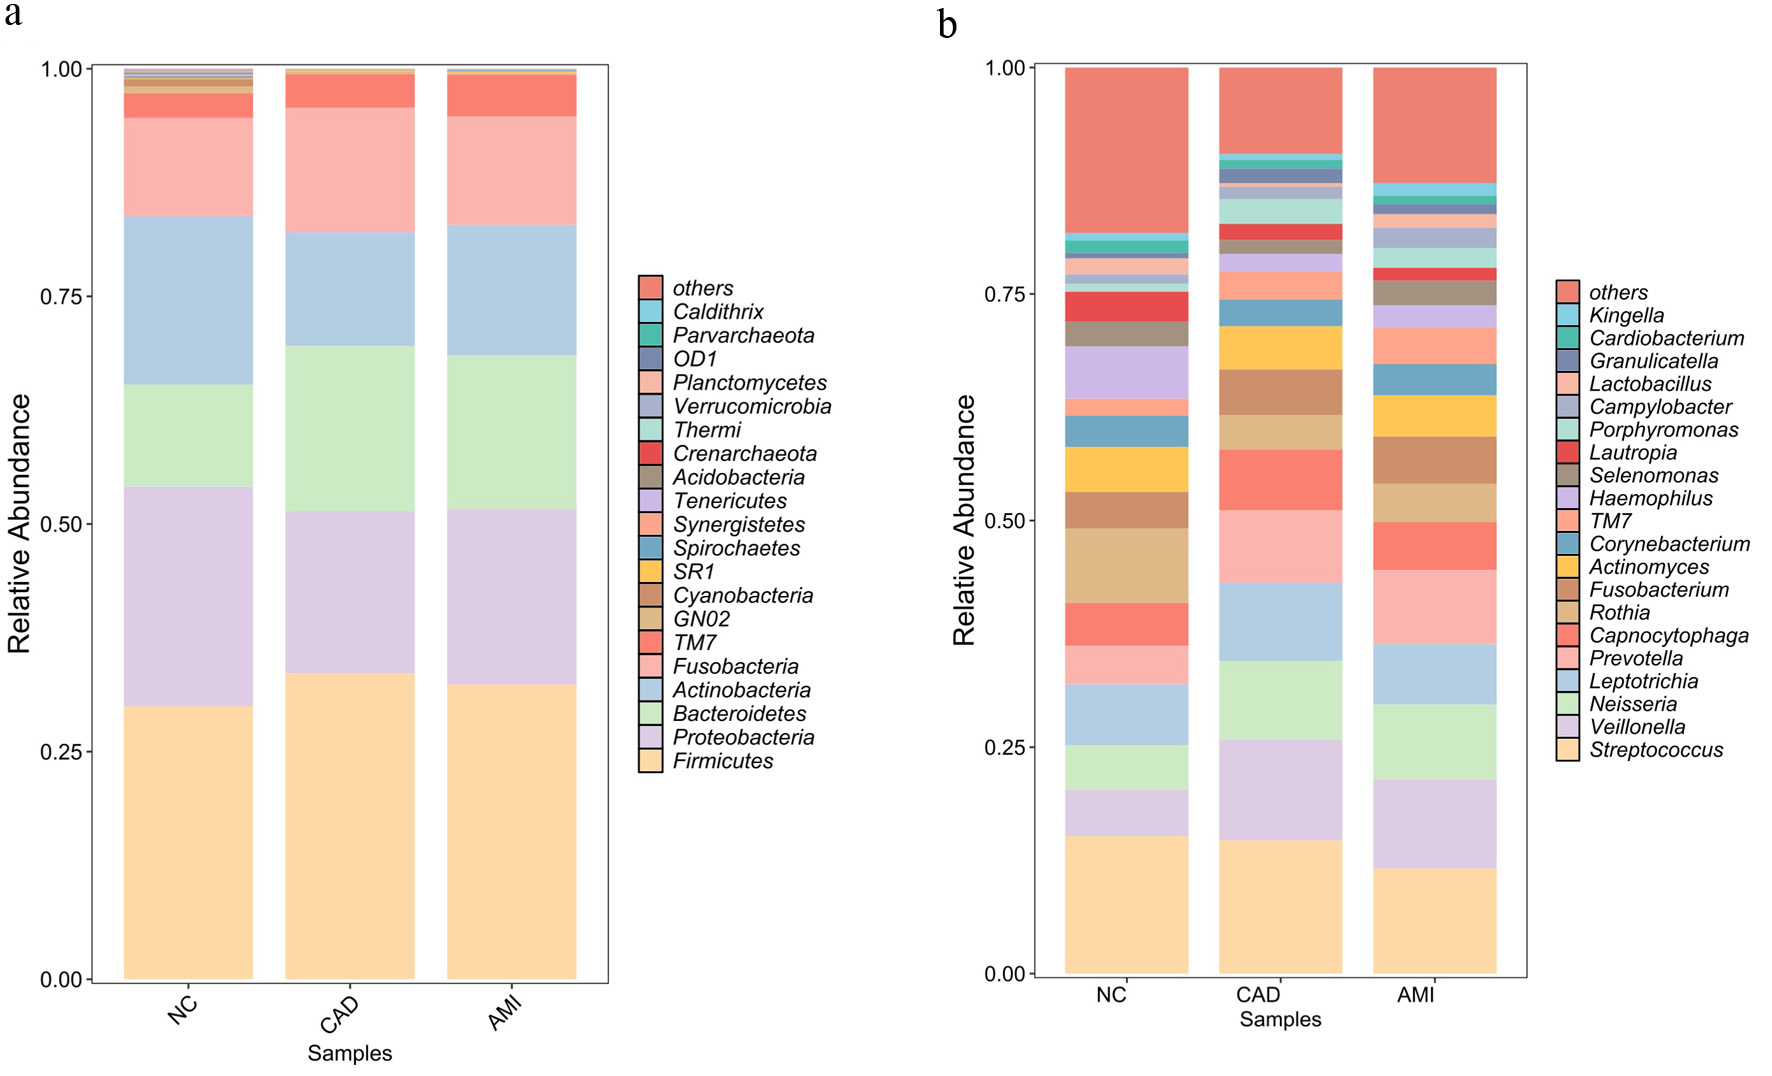
↓ Figure 1. Taxonomic composition of the oral plaque microbiome across study groups. (a) Relative abundance of dominant bacterial phyla in oral plaque samples from HCs, patients with CAD, and patients with AMI. Firmicutes, Bacteroidetes, Proteobacteria, Fusobacteria, and Actinobacteria were the predominant phyla across all groups, with a higher abundance of Bacteroidetes and TM7 and reduced Proteobacteria observed in the AMI group. (b) Relative abundance of key bacterial genera among the three groups. Patients with AMI exhibited enrichment of genera including Veillonella, TM7, and Neisseria, whereas commensal genera such as Haemophilus and Lautropia were reduced. AMI: acute myocardial infarction; CAD: coronary artery disease; HC: healthy control.
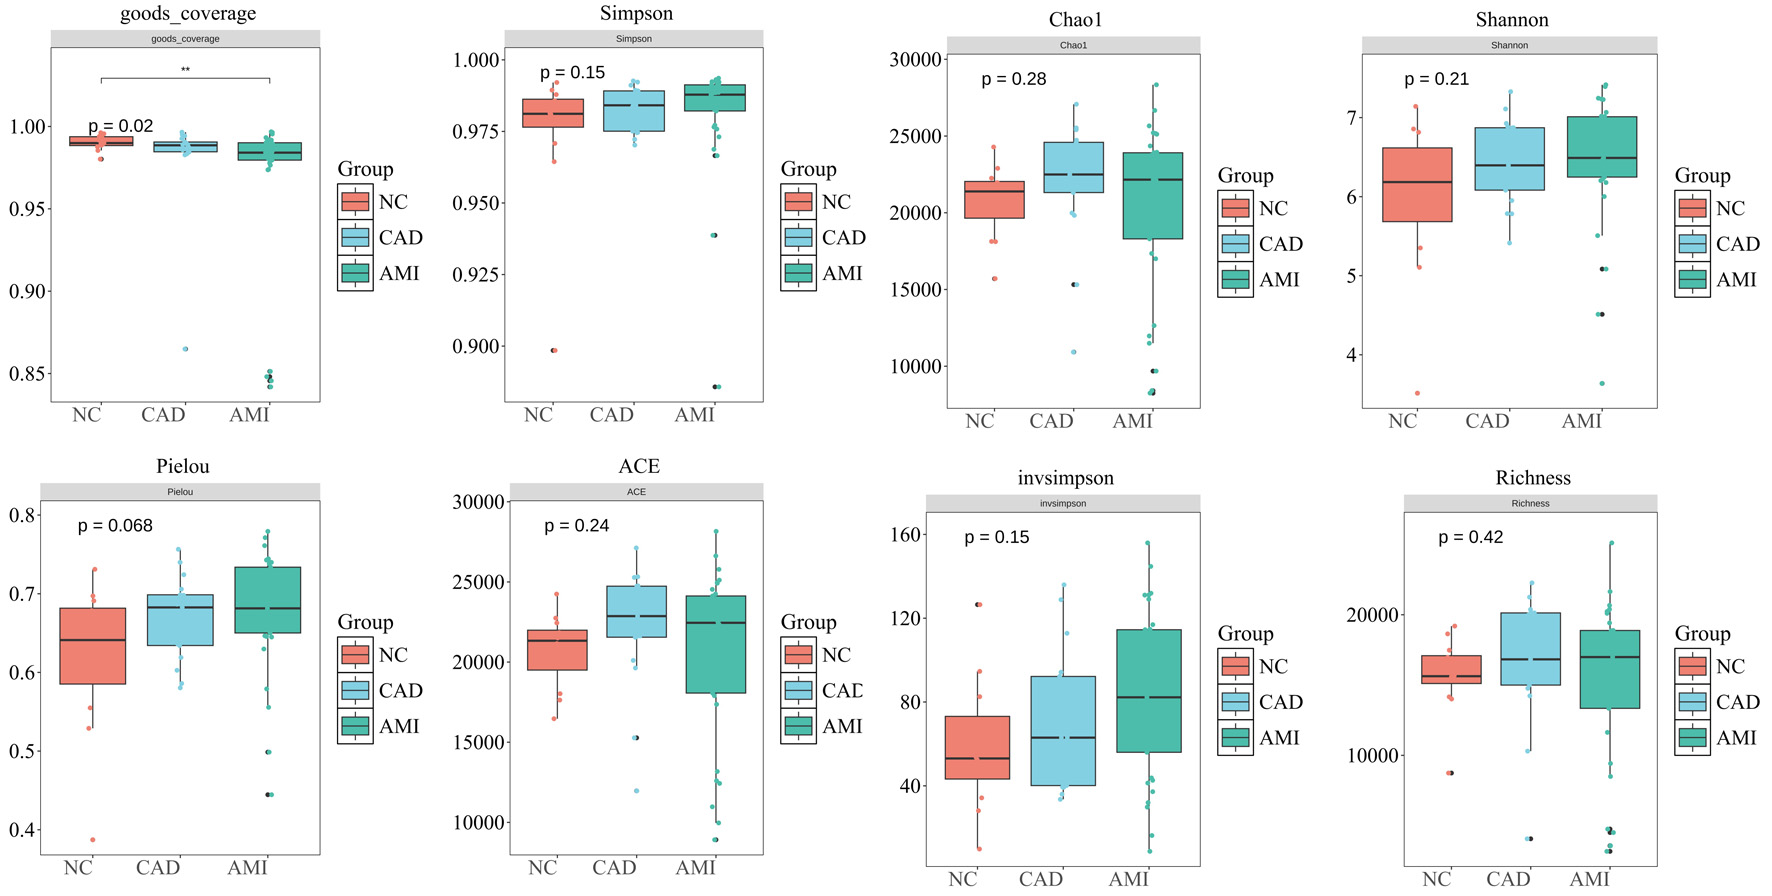
↓ Figure 2. Alpha diversity of the oral plaque microbiome. Alpha diversity indices including Shannon, ACE, Chao1, observed richness, inverse Simpson, Simpson, and Pielou’s evenness were used to evaluate within-sample microbial diversity in HC, CAD, and AMI groups. No significant differences were observed among the three groups (all P > 0.05), indicating similar microbial richness and evenness. ACE: abundance-based coverage estimator; AMI: acute myocardial infarction; CAD: coronary artery disease; HC: healthy control.
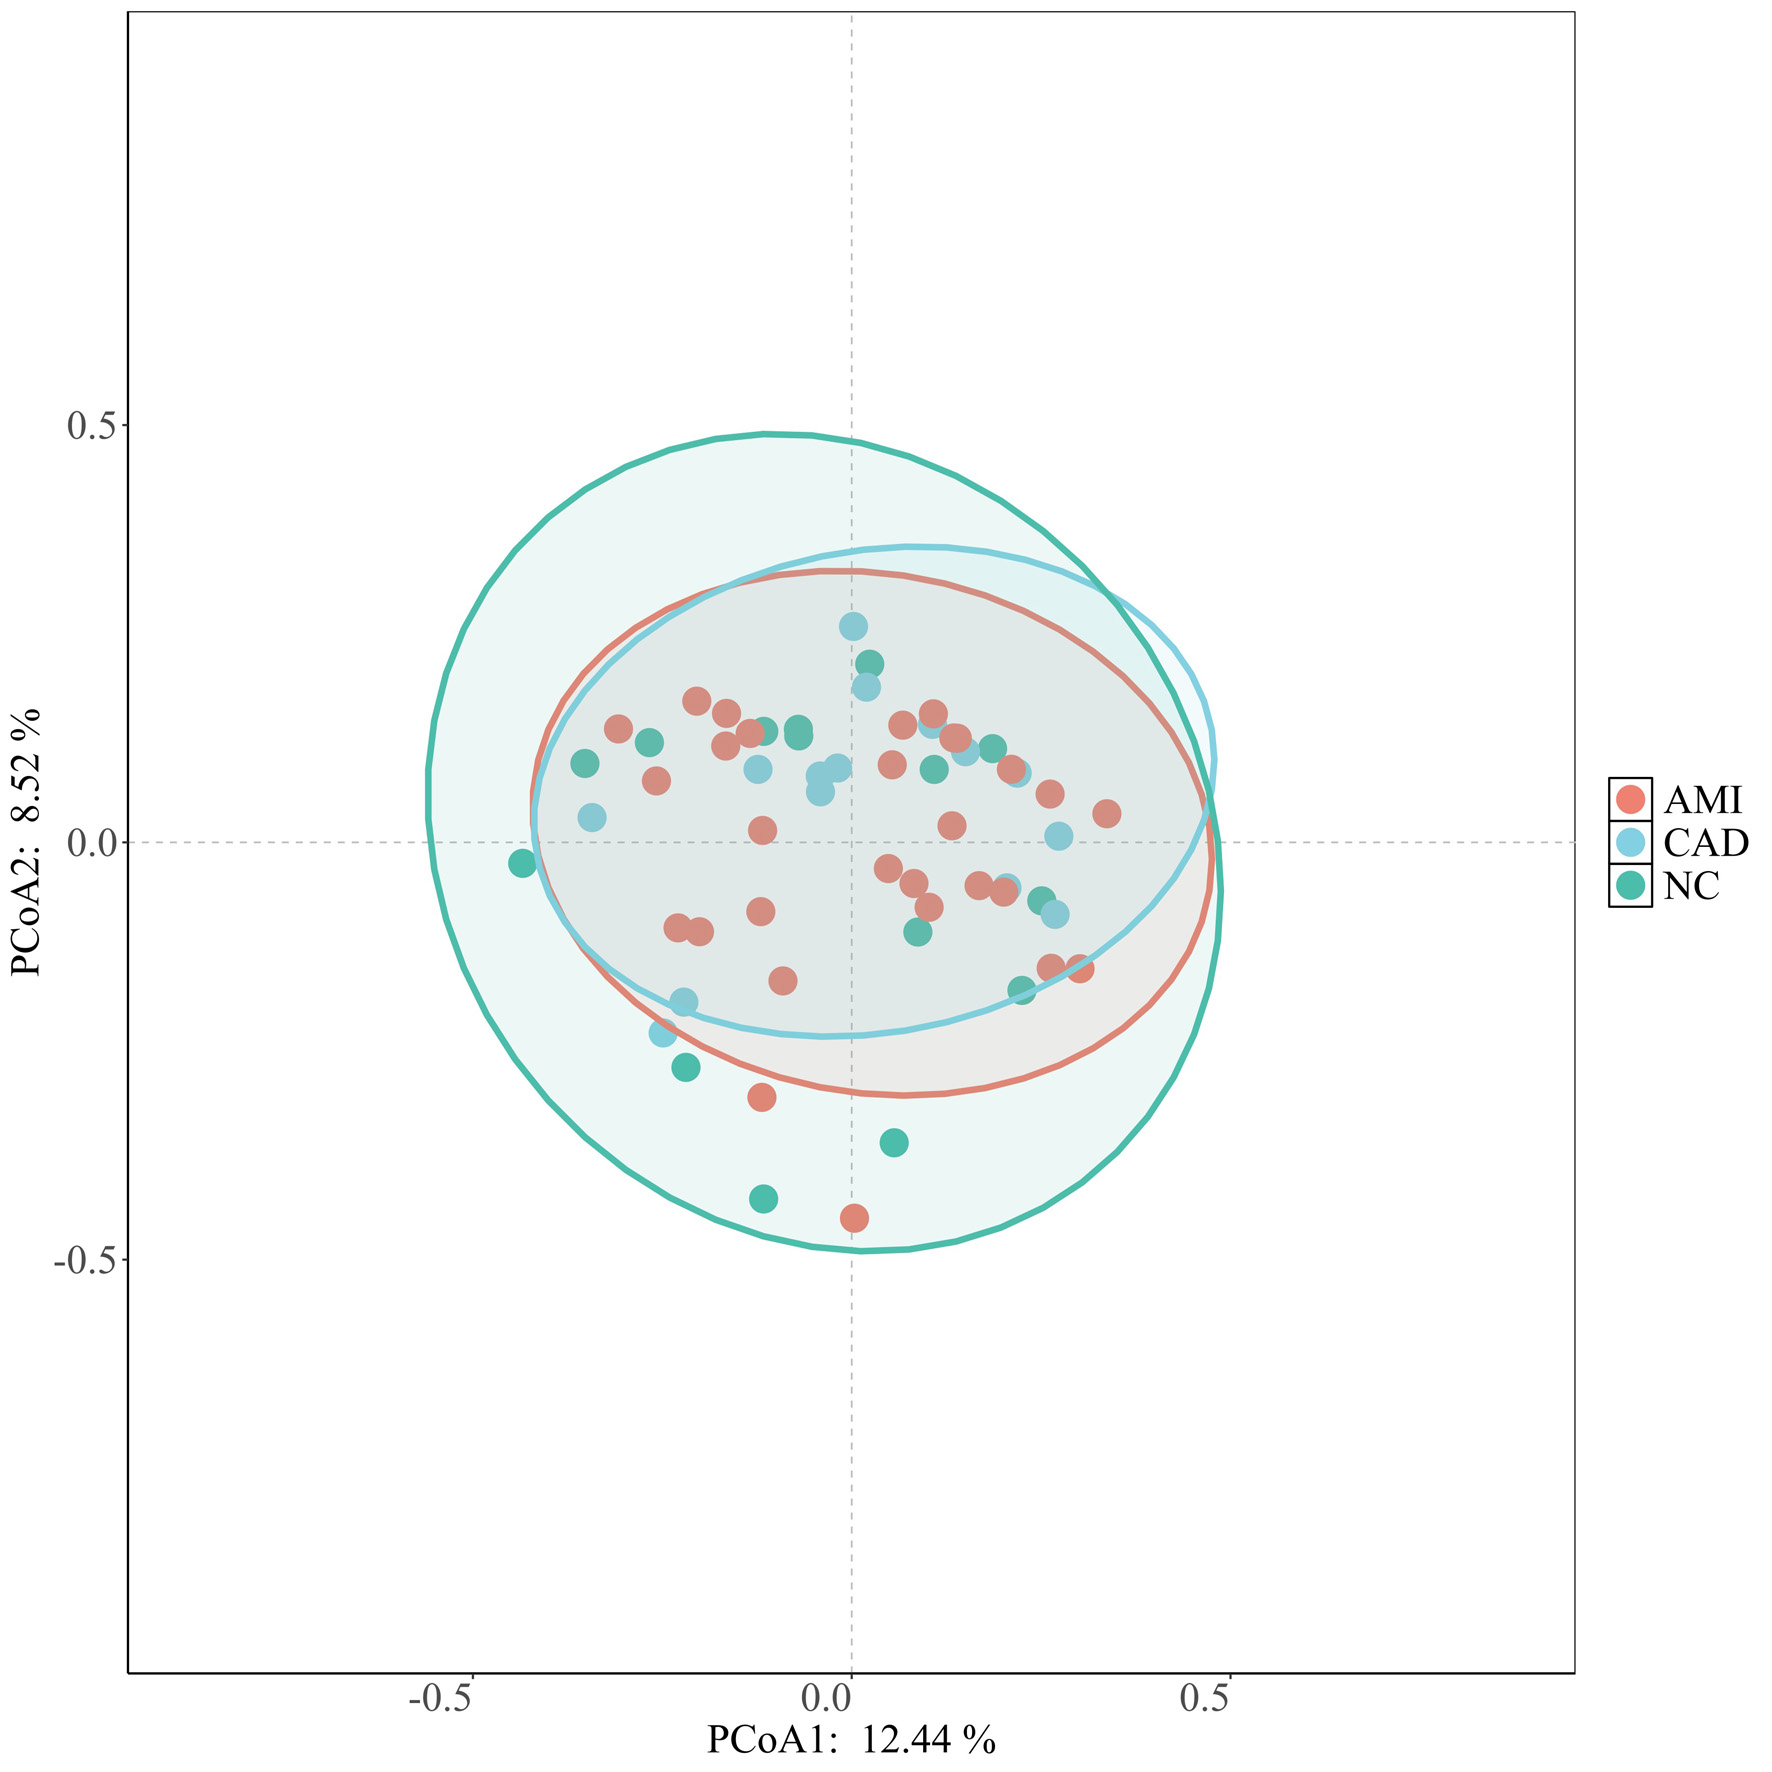
↓ Figure 3. Beta diversity analysis of oral microbiome composition. Principal coordinate analysis (PCoA) based on Bray–Curtis dissimilarity illustrating the overall microbial community structure among HC, CAD, and AMI groups. No clear clustering by disease status was observed, suggesting that the global microbial community composition remained broadly similar among the groups. AMI: acute myocardial infarction; CAD: coronary artery disease; HC: healthy control.
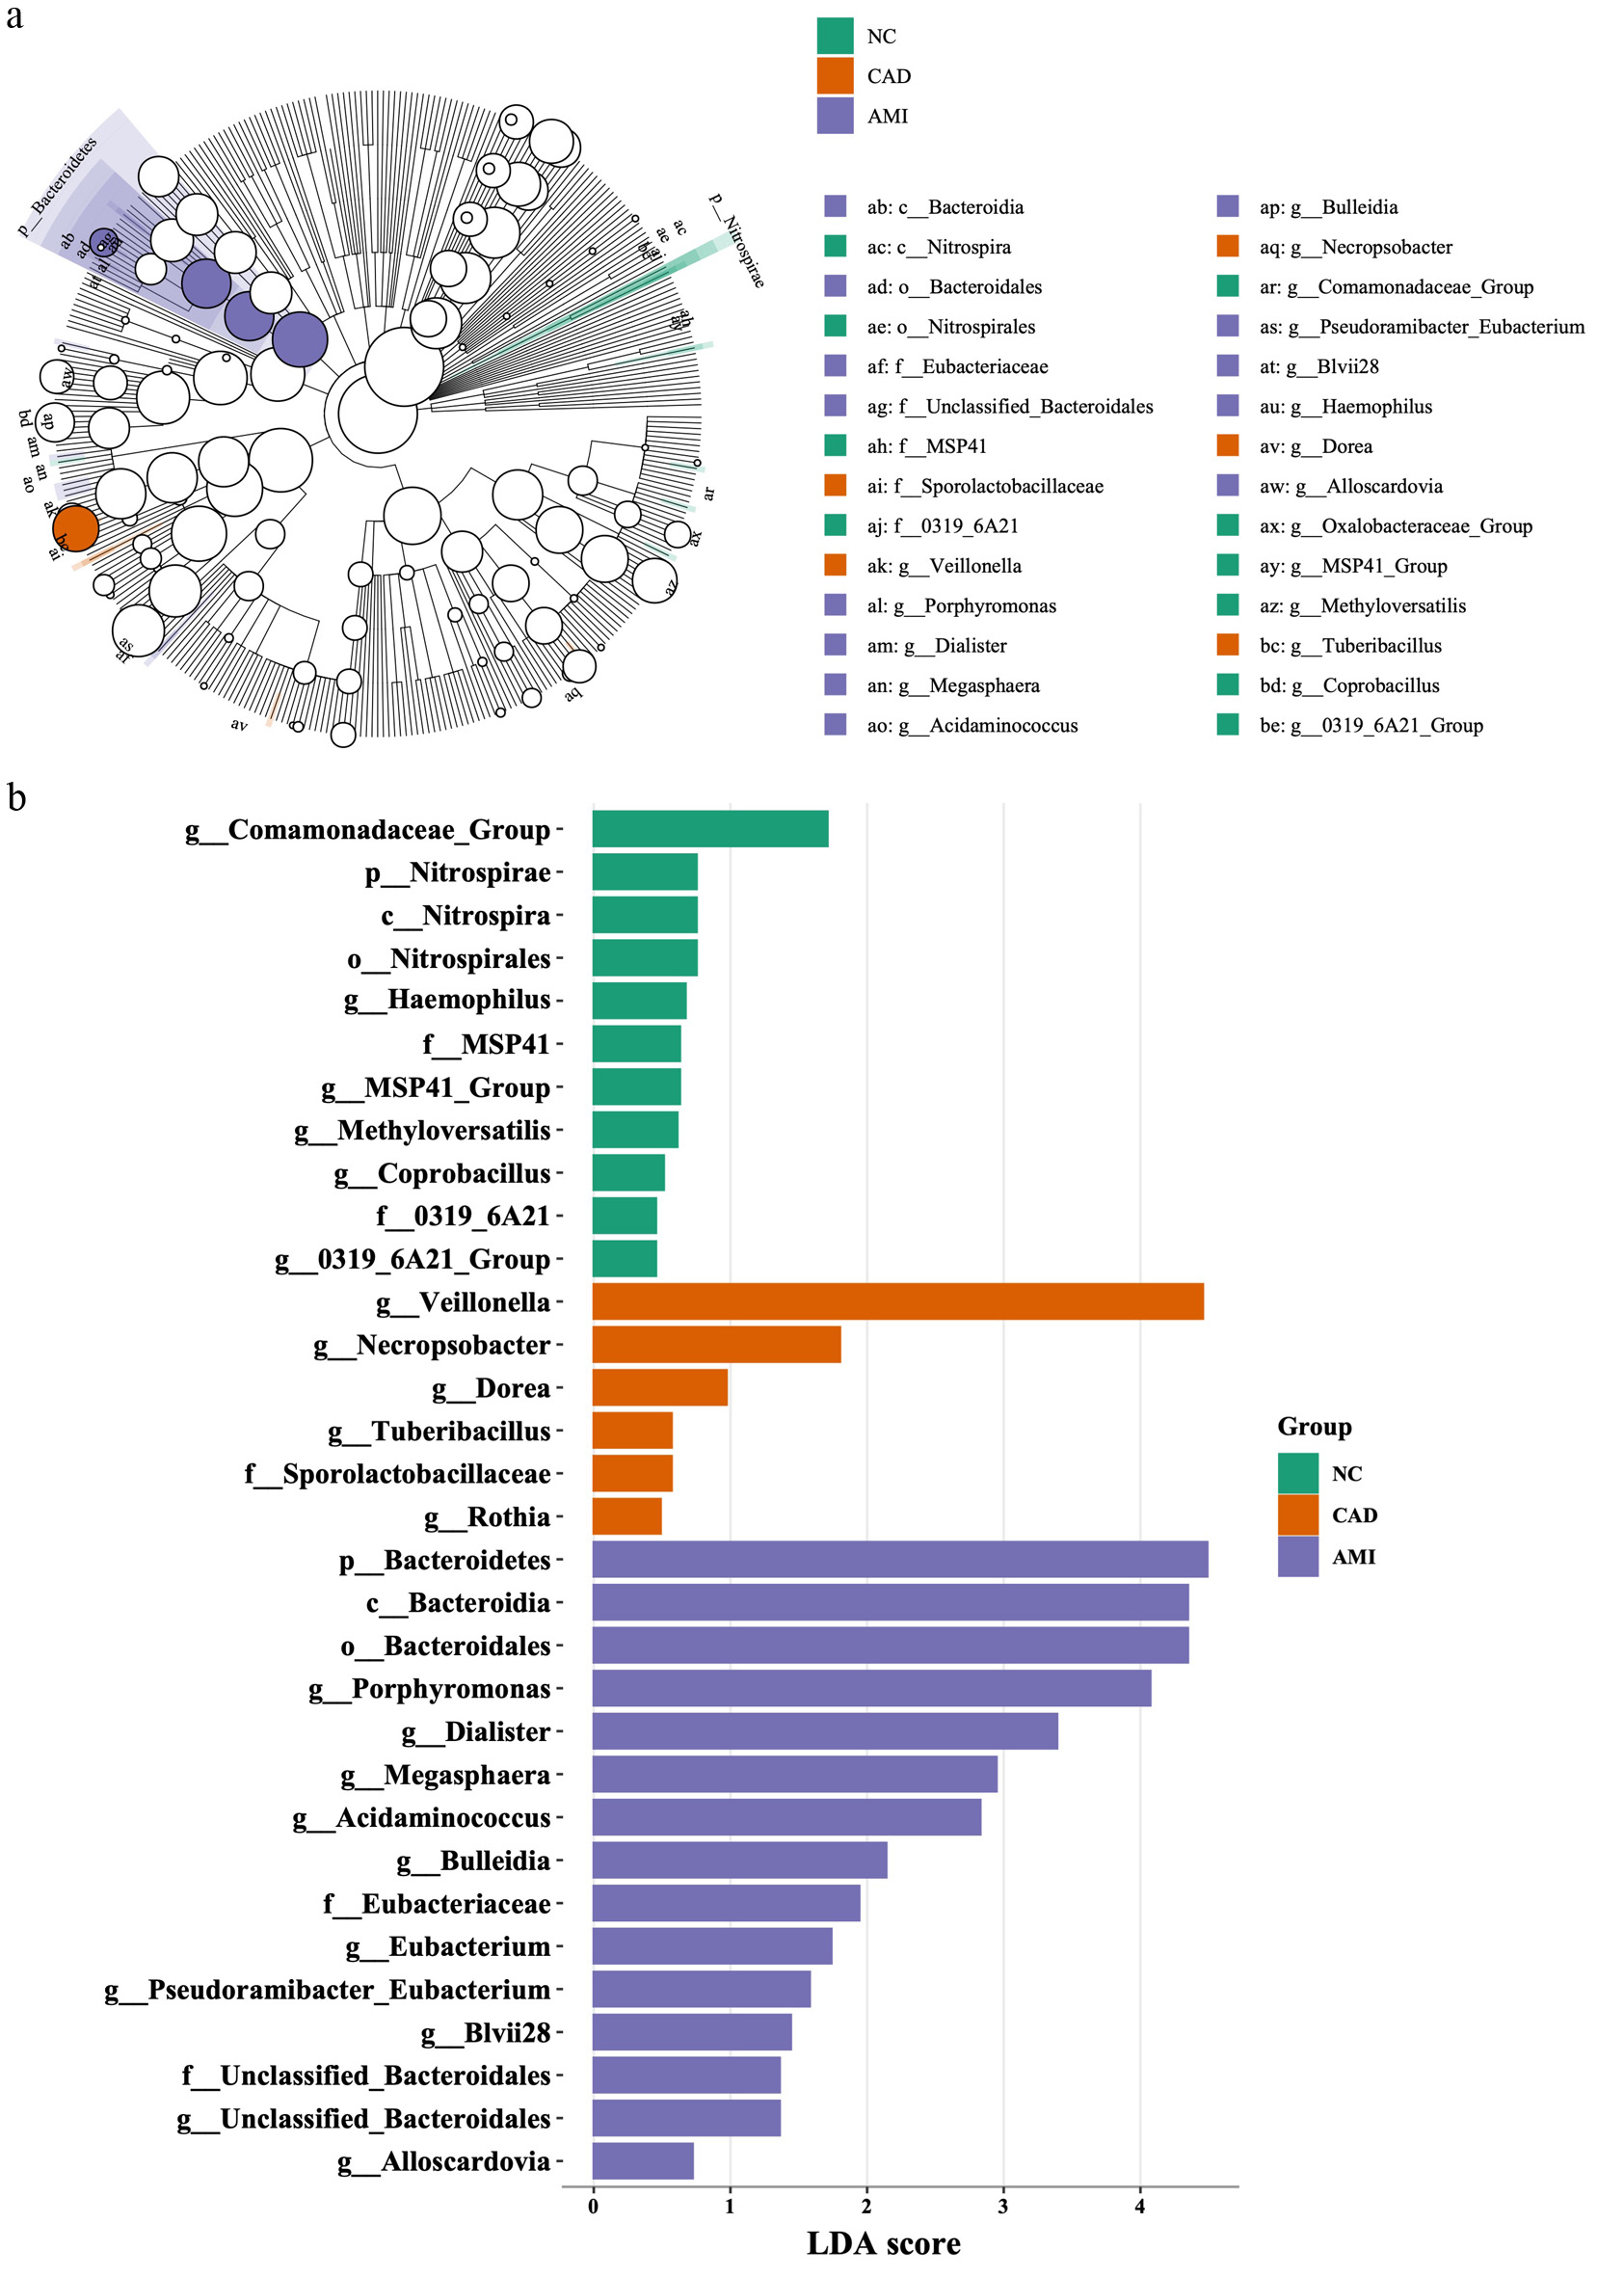
↓ Figure 4. LEfSe analysis identifying disease-specific microbial taxa. (a) Cladogram showing differentially enriched taxa across HC, CAD, and AMI groups identified by LEfSe. Taxa with logarithmic LDA scores > 3.0 and P < 0.05 were considered significant. Green, orange, and purple branches represent taxa enriched in HC, CAD, and AMI, respectively. Uncolored nodes indicate taxa without significant differences. (b) Histogram of LDA scores for taxa differentially abundant among the three groups, highlighting microbial signatures associated with each cardiovascular state. AMI: acute myocardial infarction; CAD: coronary artery disease; HC: healthy control; LDA: linear discriminant analysis; LEfSe: Linear Discriminant Analysis Effect Size.
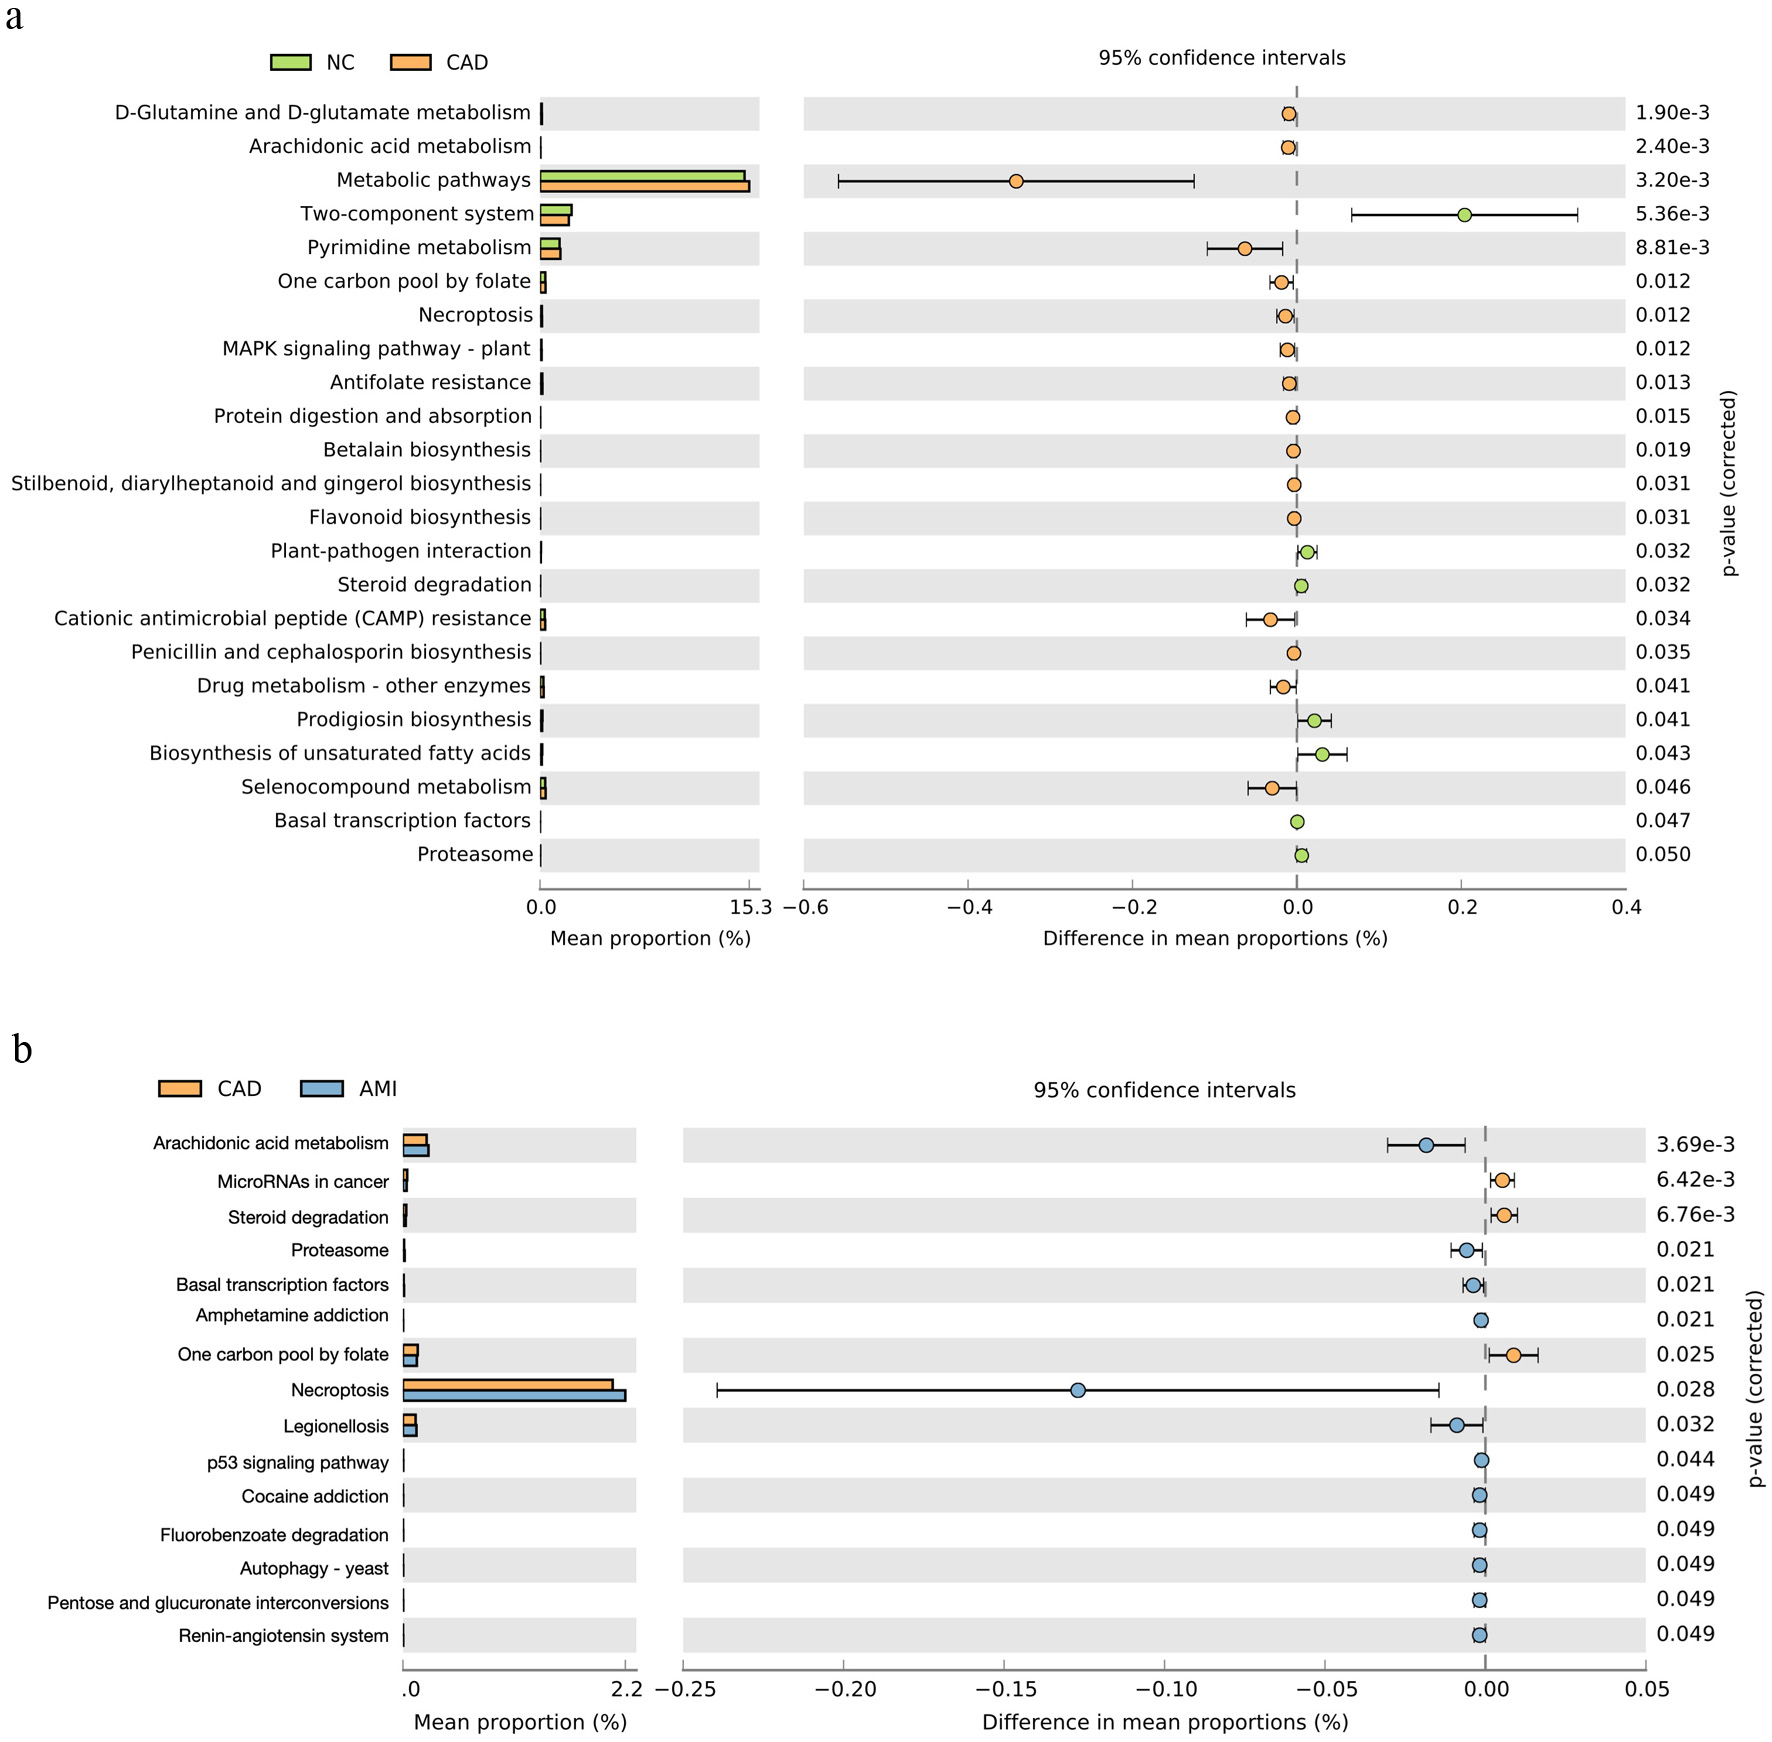
↓ Figure 5. Predicted functional pathways of the oral microbiome. (a) Differential KEGG pathway enrichment between HC and CAD groups predicted using Tax4Fun2. CAD samples showed increased pathways related to arachidonic acid metabolism, pyrimidine metabolism, and D-glutamine/D-glutamate metabolism. (b) Comparison of predicted pathways between CAD and AMI groups. AMI samples exhibited further enrichment of pathways associated with necroptosis, proteasome activity, and inflammation-related processes, while two-component signaling systems were more abundant in healthy controls. AMI: acute myocardial infarction; CAD: coronary artery disease; HC: healthy control; KEGG: Kyoto Encyclopedia of Genes and Genomes.
Table
↓ Table 1. Baseline Demographic and Clinical Characteristics of the Study Population
| Healthy control (N = 20) | CAD (N = 20) | MI (N = 20) | P value |
|---|
| CAD: coronary artery disease; DM: diabetes mellitus; HTN: hypertension; MI: myocardial infarction. |
| Age | 59 ± 17.2 | 60 ± 11.4 | 61 ± 16.4 | 0.874 |
| Male | 11 (73.3%) | 12 (80%) | 16 (80%) | 0.874 |
| HTN | 3 (15%) | 4 (20%) | 6 (30%) | 0.798 |
| DM | 1 (5%) | 2 (10%) | 4 (20%) | 0.529 |
| Smoke | 1 (5%) | 3 (15%) | 7 (35%) | 0.131 |
| Hyperlipidemia | 2 (10%) | 3 (15%) | 5 (25%) | 0.649 |
| Periodontal disease (mild/moderate/sever) | 13/6/1 | 8/9/3 | 7/8/5 | |
| Statin treatment | 2 (10%) | 13 (65%) | 3 (15%) | < 0.001 |
| Antiplatelet drugs | 0 (0%) | 20 (100%) | 20 (100%) | < 0.001 |