| Cardiology Research, ISSN 1923-2829 print, 1923-2837 online, Open Access |
| Article copyright, the authors; Journal compilation copyright, Cardiol Res and Elmer Press Inc |
| Journal website https://cr.elmerpub.com |
Original Article
Volume 17, Number 5, October 2026, pages 437-452
Dual Antioxidant Supplementation With N-Acetylcysteine and Taurine (Nefrosave®) for Cardio-Renal Protection in Chronic Kidney Disease Patients With Diabetes and/or Hypertension: A Real-World, Retrospective, Comparative Study
Figures


Tables
| Parameters | NAC + taurine + standard of care | Standard of care | P-value |
|---|---|---|---|
| *P < 0.05, **P < 0.01, and ***P < 0.001. NAC: N-acetylcysteine; SD: standard deviation; CKD: chronic kidney disease; SPO2: oxygen saturation; NA: not available. | |||
| Overall patients, n | 300 | 150 | - |
| Age (years), mean ± SD | 59.79 ± 12.30 | 56.53 ± 13.80 | 0.017* |
| Weight (kg), mean ± SD | 68.22 ± 9.63 | 68.77 ± 8.59 | 0.374 |
| Height (cm), mean ± SD | 165.74 ± 7.55 | 166.01 ± 7.33 | 0.998 |
| Sex | 0.999 | ||
| Male, n (%) | 196 (65.33%) | 98 (65.33%) | |
| Female, n (%) | 104 (34.67%) | 52 (34.67%) | |
| Stage of CKD | 0.006** | ||
| Stage 1, n (%) | 16 (5.33%) | 19 (12.67%) | |
| Stage 2, n (%) | 61 (20.33%) | 33 (22.00%) | 0.682 |
| Stage 3, n (%) | 223 (74.33%) | 98 (65.33%) | 0.047* |
| Systolic blood pressure (SBP) (mm Hg), mean ± SD | 137.93 ± 16.53 | 141.39 ± 12.90 | 0.010* |
| Diastolic blood pressure (DBP) (mm Hg), mean ± SD | 84.48 ± 7.97 | 85.85 ± 5.81 | 0.185 |
| Pulse rate (beats per minute), mean ± SD | 78.32 ± 6.50 | 77.01 ± 5.66 | 0.042* |
| SPO2 (%) | 0.07 | ||
| n | 71 | 30 | |
| Mean ± SD | 96.31 ± 0.71 | 96.60 ± 0.89 | |
| Temperature (°F) | 0.25 | ||
| n | 11 | 9 | |
| Mean ± SD | 97.91 ± 0.48 | 97.70 ± 0.36 | |
| Respiratory rate (breaths per minute) | 0.301 | ||
| n | 11 | 11 | |
| Mean ± SD | 19.82 ± 2.27 | 20.64 ± 2.50 | |
| Duration of CKD (years) | 0.999 | ||
| Number of patients with CKD (%) | 300 (100%) | 150 (100%) | |
| Mean ± SD | 3.11 ± 2.76 | 1.93 ± 1.31 | < 0.001*** |
| Duration of hypertension (years) | 0.027* | ||
| Number of patients with hypertension (%) | 270 (90.00%) | 144 (96.00%) | < 0.001*** |
| Mean ± SD | 9.56 ± 9.11 | 7.08 ± 9.46 | |
| Duration of type 2 diabetes mellitus (T2DM) (years) | |||
| Number of patients with T2DM (%) | 188 (62.67%) | 57 (38.00%) | < 0.001*** |
| Mean ± SD | 9.92 ± 9.10 | 11.67 ± 11.47 | 0.944 |
| Both hypertension and type 2 diabetes mellitus, n (%) | 158 (52.67%) | 51 (34.00%) | < 0.001*** |
| Alcohol status | |||
| Non-drinker | 259 (86.33%) | 130 (86.67%) | 0.922 |
| Quit drinking | 26 (8.67%) | 10 (6.67%) | 0.461 |
| Casual drinking | 5 (1.67%) | 4 (2.67%) | 0.619 |
| Occasional drinker | 7 (2.33%) | 6 (4.00%) | 0.320 |
| Social drinker | 3 (1.00%) | - | NA |
| Smoking status | |||
| Non-smoker | 244 (81.33%) | 120 (80.00%) | 0.735 |
| Quit smoking | 51 (17.00%) | 20 (13.33%) | 0.315 |
| Casual smoking | 1 (0.33%) | 1 (0.33%) | 0.499 |
| Moderate smoking | 1 (0.33%) | 2 (1.33%) | 0.248 |
| Light smoking | 3 (1.00%) | 6 (4.00%) | 0.243 |
| Chain smoker | - | 1 (0.67%) | NA |
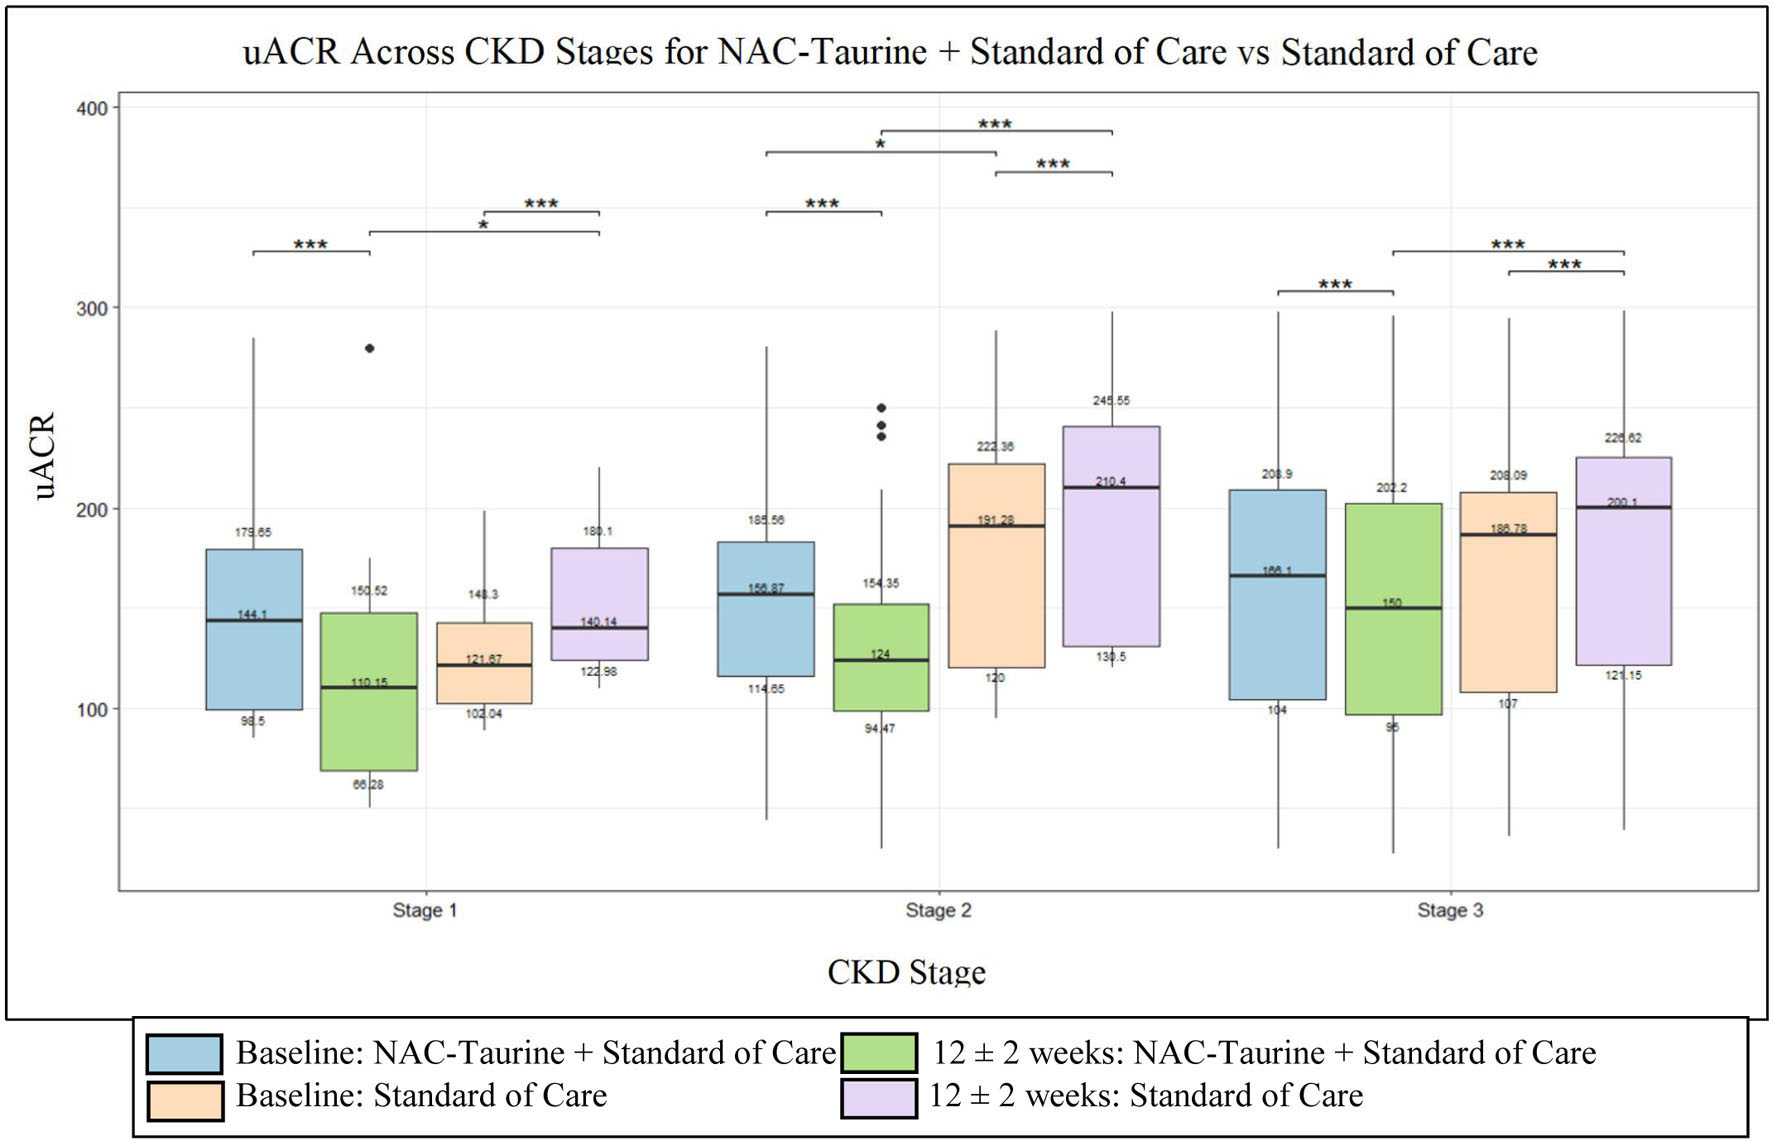
| Baseline | 12 ± 2 weeks | Mean difference from baseline to 12 ± 2 weeks, Δ (Δ%) (95% CI), P-value### | Adjusted mean difference from baseline to 12 ± 2 weeks, δ (95% CI), P-value# | Median of difference from baseline to 12 ± 2 weeks (95% CI), P-value## | |
|---|---|---|---|---|---|
| Statistical tests used: #Mann−Whitney U test; ##Wilcoxon signed-rank test; ###repeated-measures ANOVA; ***repeated-measures ANCOVA; between-group difference: univariate ANCOVA; level of significance, P < 0.001. uACR: urinary albumin-to-creatinine ratio; CI: confidence interval; NAC: N-acetylcysteine; SD: standard deviation; CKD: chronic kidney disease; Q1, Q3: first and third quartiles; ANOVA: repeated-measures analysis of variance; ANCOVA: repeated-measures analysis of covariance; min, max: minimum, maximum. | |||||
| Overall | |||||
| NAC + taurine + standard of care (n = 300) | |||||
| Mean ± SD, µg/mg | 159.87 ± 65.37 | 146.11 ± 64.89 | −13.76 (−8.61%), (−15.27, −12.26), < 0.001*** | −13.76 (−15.25, −12.27), < 0.001*** | −12.40 (−14.00, −10.80), < 0.001*** |
| Median (min, max) | 160.05 (30.00, 298.05) | 140.00 (27.00, 295.60) | |||
| Q1, Q3 | 104.00, 203.97 | 90.62, 199.90 | |||
| Standard of care (n = 150) | 18.68 (11.26%) (16.54, 20.81), < 0.001*** | 18.67 (16.50, 20.84), < 0.001*** | 18.10 (16.63, 19.66), < 0.001*** | ||
| Mean ± SD, µg/mg | 165.85 ± 58.71 | 184.53 ± 58.64 | |||
| Median (min, max) | 178.30 (36.00, 294.56) | 199.35 (39.00, 298.10) | |||
| Q1, Q3 | 108.60, 207.59 | 130.00, 224.71 | |||
| Between-group difference | −32.44 (−35.05, −29.83), < 0.001*** | −33.01 (−35.74, −30.28), < 0.001*** | −30.34 (−32.60, −28.00), < 0.001*** | ||
| Stage 1 CKD | |||||
| NAC + taurine + standard of care (n = 16) | |||||
| Mean ± SD, µg/mg | 146.16 ± 54.77 | 117.75 ± 59.70 | −28.41 (−19.44%) (−33.71, −23.11), < 0.001*** | −24.11 (−33.74, −14.49), < 0.001*** | −28.11 (−35.35, −21.89), < 0.001*** |
| Median (min, max) | 144.10 (85.00, 284.88) | 110.15 (50.10, 280.00) | |||
| Q1, Q3 | 98.50, 179.65 | 66.28, 150.52 | |||
| Standard of care (n = 19) | 24.85 (19.75%) (19.98, 29.71), < 0.001*** | 21.23 (12.90, 29.57), < 0.001*** | 24.31 (20.21, 29.39), < 0.001*** | ||
| Mean ± SD, µg/mg | 125.84 ± 31.58 | 150.69 ± 33.86 | |||
| Median (min, max) | 121.67 (88.50, 198.54) | 140.14 (109.80, 220.36) | |||
| Q1, Q3 | 102.04, 148.30 | 122.98, 180.10 | |||
| Between-group difference | −53.26 (−60.45, −46.06), < 0.001*** | −45.65 (−62.46, −28.84), < 0.001*** | −52.55 (−61.00, −45.20), < 0.001*** | ||
| Stage 2 CKD | |||||
| NAC + taurine + standard of care (n = 61) | |||||
| Mean ± SD, µg/mg | 155.61 ± 49.98 | 131.18 ± 46.86 | −24.43 (−15.70%) (−27.99, −20.87), < 0.001*** | −25.05 (−28.72, −21.38), < 0.001*** | −23.11 (−27.00, −19.69), < 0.001*** |
| Median (min, max) | 156.87 (44.00, 280.10) | 124.00 (30.00, 250.16) | |||
| Q1, Q3 | 114.65, 185.56 | 94.47, 154.35 | |||
| Standard of care (n = 33) | 19.91 (10.77%) (15.07, 24.75), < 0.001*** | 21.05 (15.76, 26.35), < 0.001*** | 19.41 (15.22, 23.29), < 0.001*** | ||
| Mean ± SD, µg/mg | 184.89 ± 59.13 | 204.80 ± 57.25 | |||
| Median (min, max) | 191.28 (94.60, 288.30) | 210.40 (120.00, 298.00) | |||
| Q1, Q3 | 120.00, 222.36 | 130.50, 245.55 | |||
| Between-group difference | −44.34 (−50.36, −38.34), < 0.001*** | −48.46 (−55.70, −41.22), < 0.001*** | −42.28 (−48.46, −37.00), < 0.001*** | ||
| Stage 3 CKD | |||||
| NAC + taurine + standard of care (n = 223) | |||||
| Mean ± SD, µg/mg | 162.02 ± 69.68 | 152.22 ± 68.42 | −9.80 (−6.05%) (−11.32, −8.27), < 0.001*** | −9.42 (−10.93, −7.90), < 0.001*** | −8.78 (−10.17, −7.52), < 0.001*** |
| Median (min, max) | 166.10 (30.00, 298.05) | 150.00 (27.00, 295.60) | |||
| Q1, Q3 | 104.00, 208.90 | 96.00, 202.20 | |||
| Standard of care (n = 98) | 17.06 (10.20%) (14.77, 19.36), < 0.001*** | 16.21 (13.87, 18.55), < 0.001*** | 16.52 (15.00, 18.26), < 0.001*** | ||
| Mean ± SD, µg/mg | 167.20 ± 59.31 | 184.26 ± 60.20 | |||
| Median (min, max) | 186.78 (36.00, 294.56) | 200.10 (39.00, 298.10) | |||
| Q1, Q3 | 107.00, 208.09 | 121.15, 226.62 | |||
| Between-group difference | −26.86 (−29.62, −24.10), < 0.001*** | −26.08 (−28.97, −23.18), < 0.001*** | −25.22 (−27.58, −23.04), < 0.001*** | ||
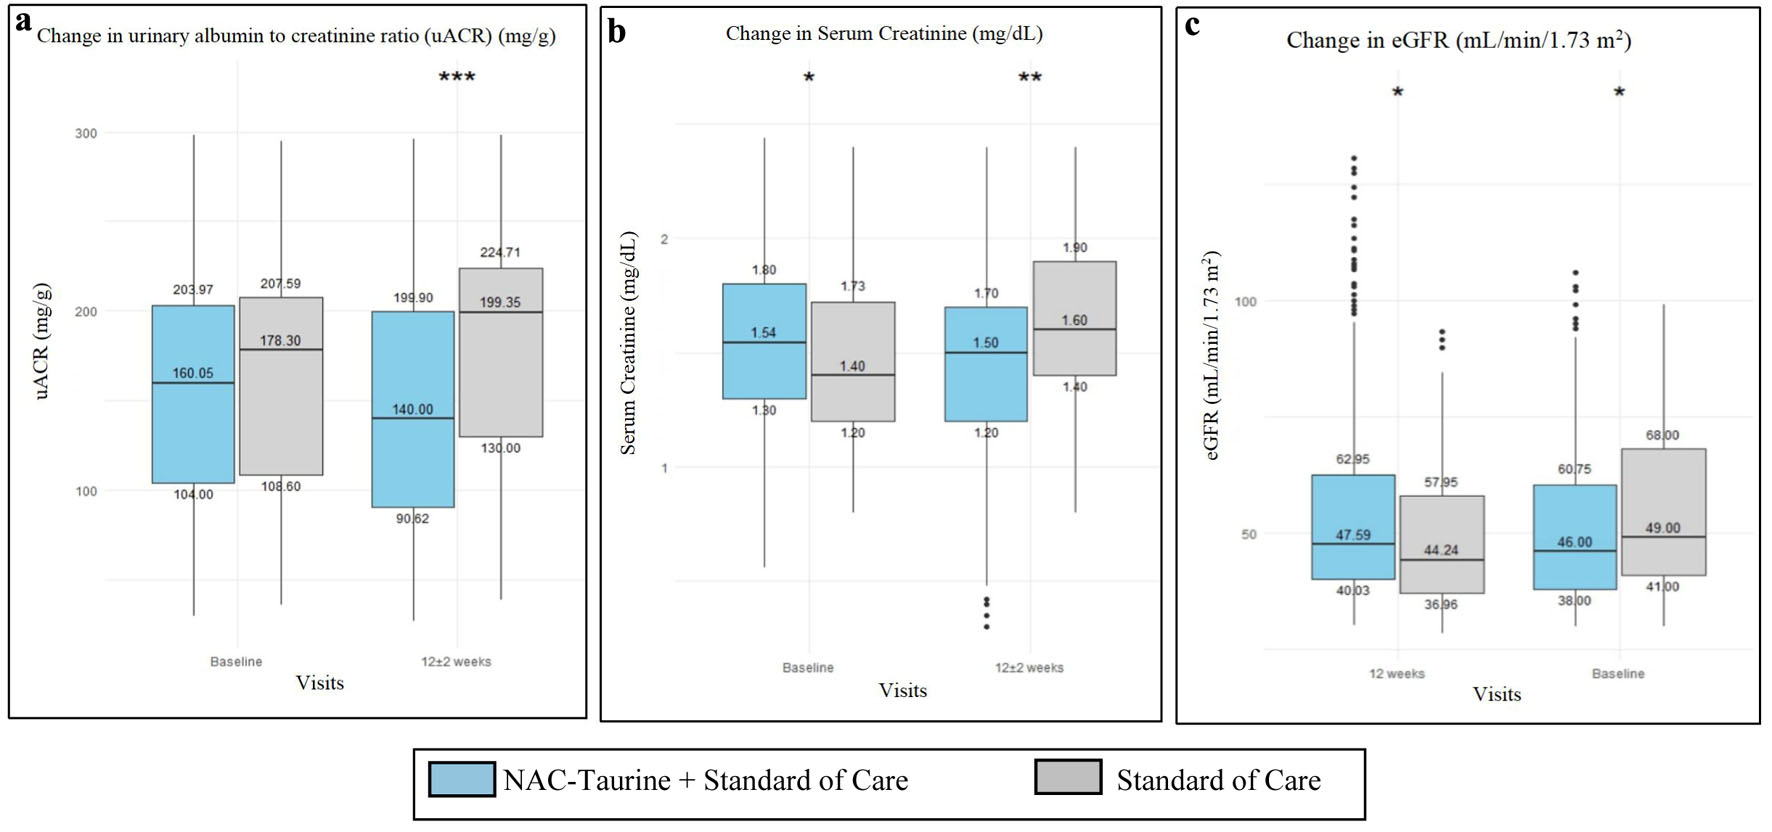
| Baseline | 12 ± 2 weeks | Median of difference from baseline to 12 ± 2 weeks (95% CI), P-value## | Median of difference between groups (95% CI), P-value# | |
|---|---|---|---|---|
| Statistical tests used: #Mann–Whitney U test; ##Wilcoxon signed-rank test; level of significance, ***P < 0.001. CI: confidence interval; NAC: N-acetylcysteine; SD: standard deviation; CKD: chronic kidney disease; Q1, Q3: first and third quartiles; min, max: minimum, maximum. | ||||
| Overall | ||||
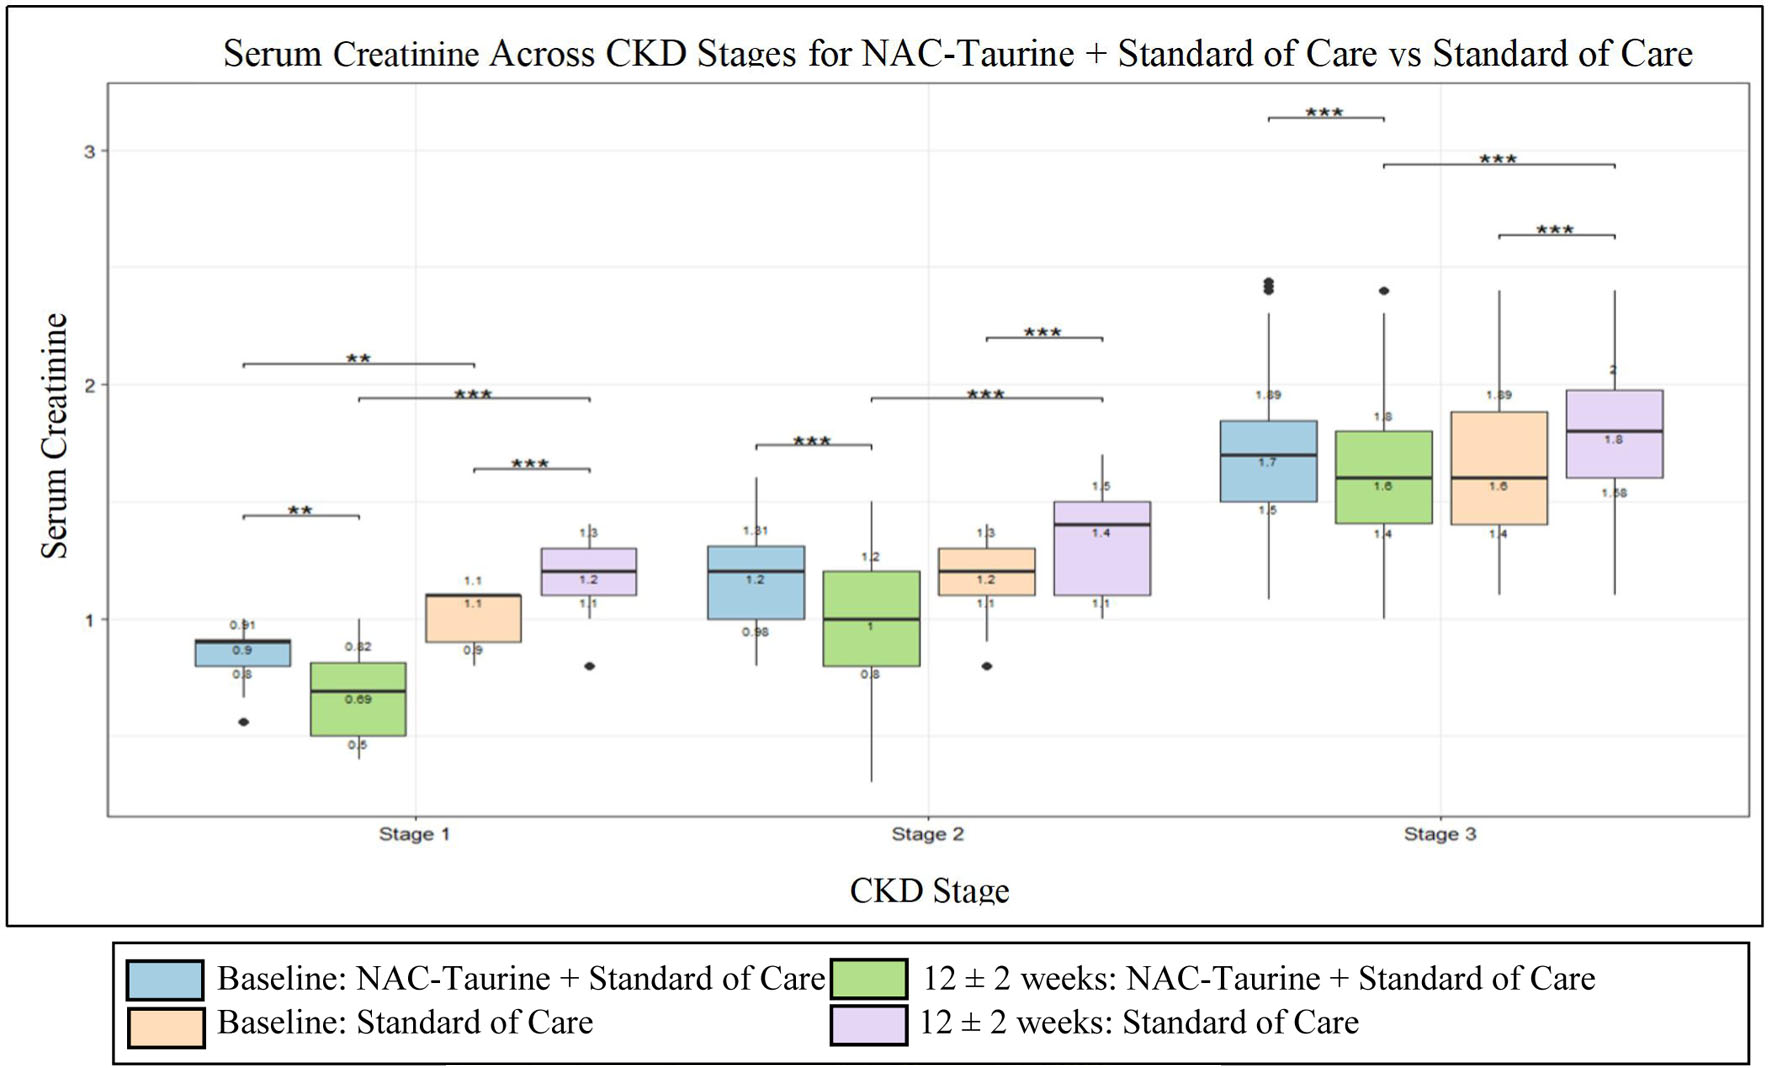
| NAC + taurine + standard of care (n = 300) | −0.05 (−0.06, −0.05), < 0.001*** | −0.20 (−0.20, −0.20), < 0.001*** | ||
| Mean ± SD, mg/dL | 1.54 ± 0.38 | 1.46 ± 0.43 | ||
| Median (min, max) | 1.54 (0.56, 2.44) | 1.50 (0.30, 2.40) | ||
| Q1, Q3 | 1.30, 1.80 | 1.20, 1.70 | ||
| Standard of care (n = 150) | 0.15 (0.11, 0.15), < 0.001*** | |||
| Mean ± SD, mg/dL | 1.47 ± 0.37 | 1.60 ± 0.35 | ||
| Median (min, max) | 1.40 (0.80, 2.40) | 1.60 (0.80, 2.40) | ||
| Q1, Q3 | 1.20, 1.73 | 1.40, 1.90 | ||
| Stage 1 CKD | ||||
| NAC + taurine + standard of care (n = 16) | −0.20 (−0.29, −0.09), 0.001** | −0.36 (−0.48, −0.26), < 0.001*** | ||
| Mean ± SD, mg/dL | 0.85 ± 0.12 | 0.66 ± 0.19 | ||
| Median (min, max) | 0.90 (0.56, 1.00) | 0.69 (0.40, 1.00) | ||
| Q1, Q3 | 0.80, 0.91 | 0.50, 0.82 | ||
| Standard of care (n = 19) | 2.00 (0.15, 2.50), < 0.001*** | |||
| Mean ± SD, mg/dL | 1.01 ± 0.11 | 1.19 ± 0.16 | ||
| Median (min, max) | 1.10 (0.80, 1.10) | 1.20 (0.80, 1.40) | ||
| Q1, Q3 | 0.90, 1.10 | 1.10, 1.30 | ||
| Stage 2 CKD | ||||
| NAC + taurine + standard of care (n = 61) | −0.13 (−0.18, −0.10), < 0.001*** | −0.30 (−0.35, −0.21), < 0.001*** | ||
| Mean ± SD, mg/dL | 1.16 ± 0.21 | 1.00 ± 0.28 | ||
| Median (min, max) | 1.20 (0.80, 1.60) | 1.00 (0.30, 1.50) | ||
| Q1, Q3 | 0.98, 1.31 | 0.80, 1.20 | ||
| Standard of care (n = 33) | 0.15 (0.12, 0.20), < 0.001*** | |||
| Mean ± SD, mg/dL | 1.16 ± 0.16 | 1.33 ± 0.20 | ||
| Median (min, max) | 1.20 (0.80, 1.40) | 1.40 (1.00, 1.70) | ||
| Q1, Q3 | 1.10, 1.30 | 1.10, 1.50 | ||
| Stage 3 CKD | ||||
| NAC + taurine + standard of care (n = 223) | −0.05 (−0.05, −0.03), < 0.001*** | −0.17 (−0.20, −0.13), < 0.001*** | ||
| Mean ± SD, mg/dL | 1.69 ± 0.29 | 1.65 ± 0.30 | ||
| Median (min, max) | 1.70 (1.08, 2.44) | 1.60 (1.00, 2.40) | ||
| Q1, Q3 | 1.50, 1.89 | 1.40, 1.80 | ||
| Standard of care (n = 98) | 0.11 (0.10, 0.14), < 0.001*** | |||
| Mean ± SD, mg/dL | 1.66 ± 0.30 | 1.78 ± 0.28 | ||
| Median (min, max) | 1.60 (1.10, 2.40) | 1.80 (1.10, 2.40) | ||
| Q1, Q3 | 1.40, 1.89 | 1.58, 2.00 | ||
| Baseline | 12 ± 2 weeks | Median of difference from baseline to 12 ± 2 weeks (95% CI), P-value## | Median of difference between groups (95% CI), P-value# | |
|---|---|---|---|---|
| Statistical tests used: #Mann–Whitney U test; ##Wilcoxon signed-rank test; level of significance, ***P < 0.001. eGFR: estimated glomerular filtration rate; CI: confidence interval; NAC: N-acetylcysteine; SD: standard deviation; CKD: chronic kidney disease; Q1, Q3: first and third quartiles; min, max: minimum, maximum. | ||||
| Overall | ||||
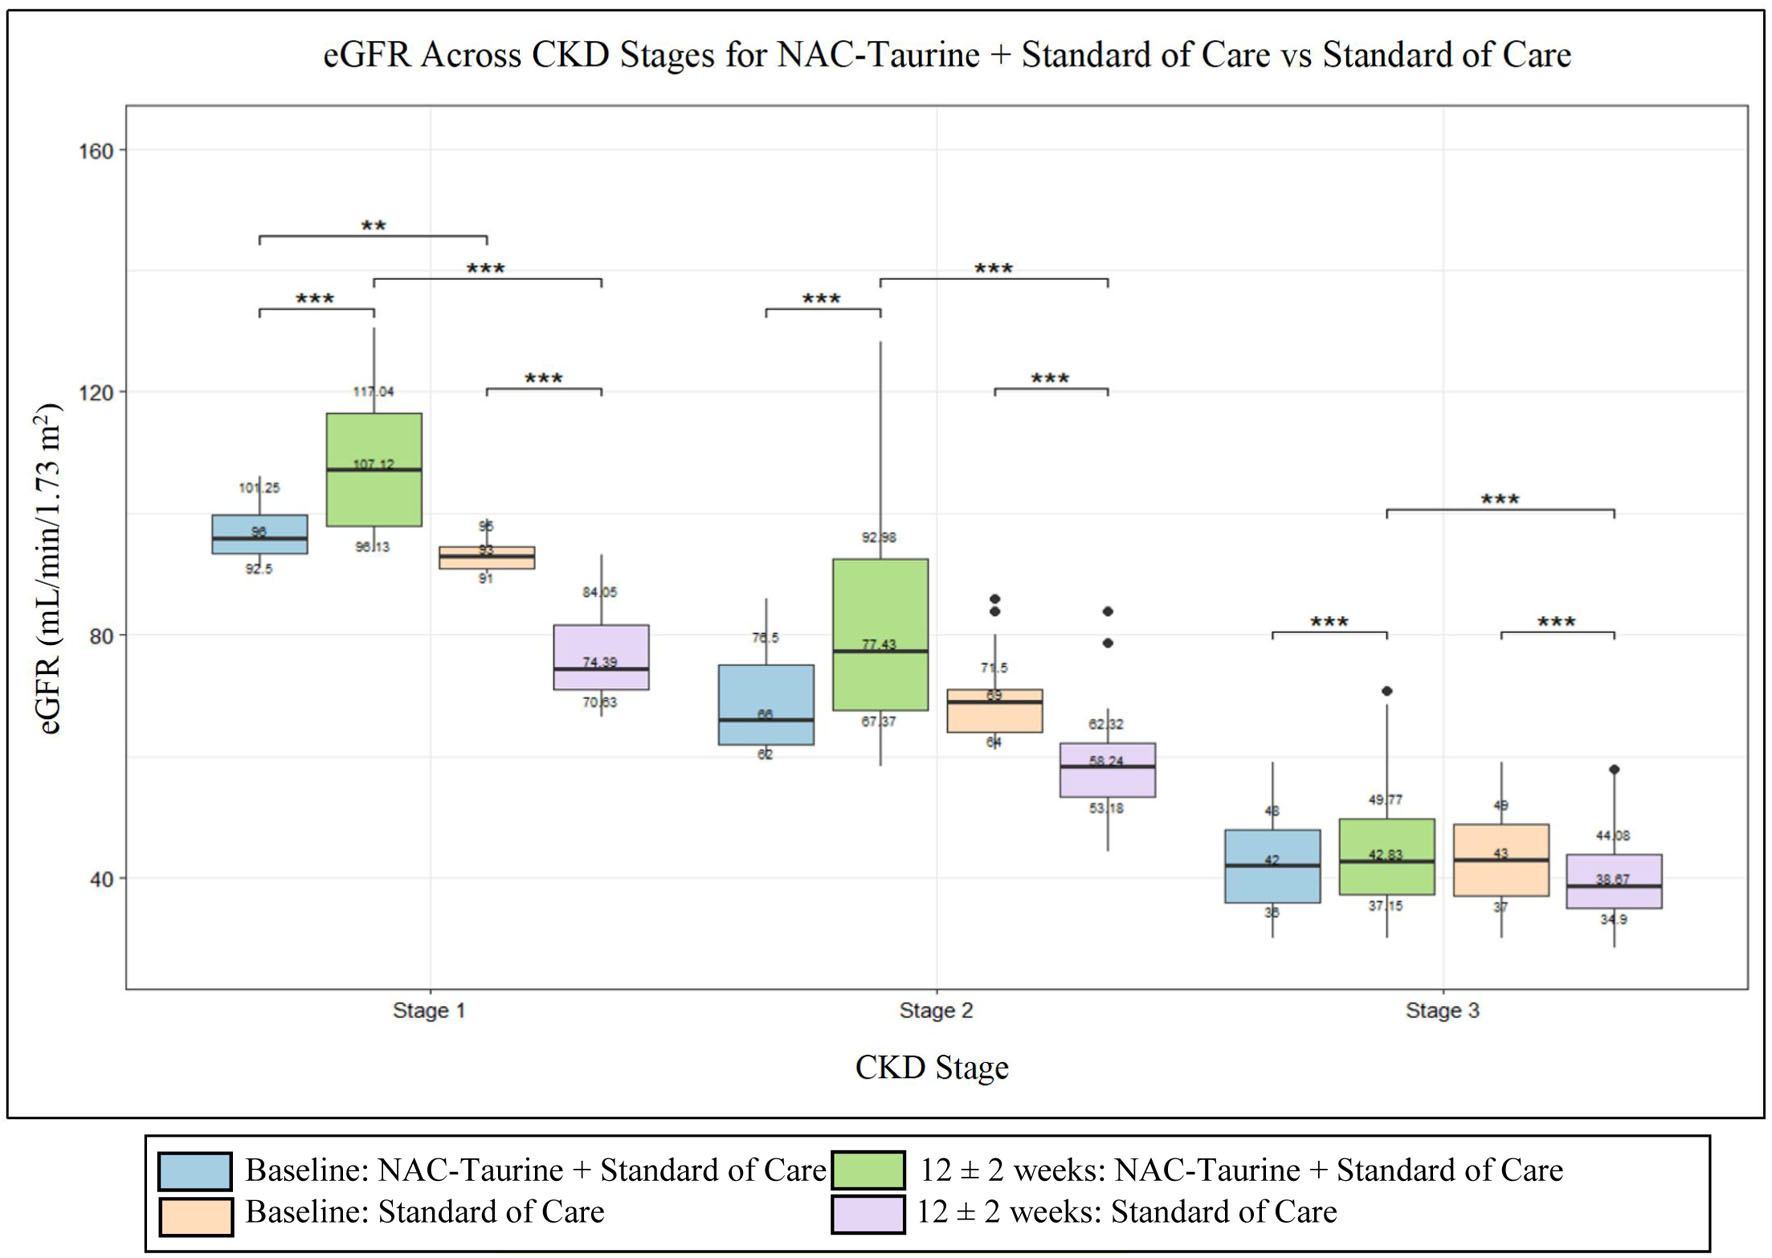
| NAC + taurine + standard of care (n = 300) | 2.06 (1.60, 2.71), < 0.001*** | 7.51 (6.52, 8.92), < 0.001*** | ||
| Mean ± SD, mL/min/1.73 m2 | 50.62 ± 17.19 | 54.97 ± 22.42 | ||
| Median (min, max) | 46.00 (30.00, 106.00) | 47.59 (30.13, 130.60) | ||
| Q1, Q3 | 38.00, 60.75 | 40.03, 62.95 | ||
| Standard of care (n = 150) | −5.47 (−6.75, −4.54), < 0.001*** | |||
| Mean ± SD, mL/min/1.73 m2 | 55.30 ± 19.18 | 48.62 ± 15.24 | ||
| Median (min, max) | 49.00 (30.00, 99.00) | 44.24 (28.39, 93.19) | ||
| Q1, Q3 | 41.00, 68.00 | 36.96, 57.95 | ||
| Stage 1 CKD | ||||
| NAC + taurine + standard of care (n = 16) | 10.05 (3.97, 17.20), < 0.001*** | 25.97 (19.89, 33.65), < 0.001*** | ||
| Mean ± SD, mL/min/1.73 m2 | 97.00 ± 4.62 | 108.07 ± 11.81 | ||
| Median (min, max) | 96.00 (91.00, 106.00) | 107.12 (93.68, 130.60) | ||
| Q1, Q3 | 92.50, 101.25 | 96.13, 117.04 | ||
| Standard of care (n = 19) | ||||
| Mean ± SD, mL/min/1.73 m2 | 93.00 ± 2.38 | 76.92 ± 8.02 | −17.40 (−20.56, −11.73), < 0.001*** | |
| Median (min, max) | 93.00 (90.00, 99.00) | 74.39 (66.53, 93.19) | ||
| Q1, Q3 | 91.00, 95.00 | 70.63, 84.05 | ||
| Stage 2 CKD | ||||
| NAC + taurine + standard of care (n = 61) | 9.96 (7.33, 13.44), < 0.001*** | 19.67 (16.00, 24.20), < 0.001*** | ||
| Mean ± SD, mL/min/1.73 m2 | 69.34 ± 7.87 | 81.56 ± 16.79 | ||
| Median (min, max) | 66.00 (60.00, 86.00) | 77.43 (58.37, 128.35) | ||
| Q1, Q3 | 62.00, 76.50 | 67.37, 92.98 | ||
| Standard of care (n = 33) | −10.22 (−12.70, −7.76), < 0.001*** | |||
| Mean ± SD, mL/min/1.73 m2 | 68.94 ± 6.34 | 58.71 ± 8.39 | ||
| Median (min, max) | 69.00 (61.00, 86.00) | 58.24 (44.38, 83.84) | ||
| Q1, Q3 | 64.00, 71.50 | 53.18, 62.32 | ||
| Stage 3 CKD | ||||
| NAC + taurine + standard of care (n = 223) | 1.26 (0.98, 1.51), < 0.001*** | 11.39 (9.58, 12.79), < 0.001*** | ||
| Mean ± SD, mL/min/1.73 m2 | 42.17 ± 7.54 | 43.89 ± 8.40 | ||
| Median (min, max) | 42.00 (30.00, 59.00) | 42.83 (30.13, 70.87) | ||
| Q1, Q3 | 36.00, 48.00 | 37.15, 49.77 | ||
| Standard of care (n = 98) | −3.47 (−4.07, −2.95), < 0.001*** | |||
| Mean ± SD, mL/min/1.73 m2 | 43.40 ± 8.14 | 39.73 ± 7.08 | ||
| Median (min, max) | 43.00 (30.00, 59.00) | 38.67 (28.39, 57.88) | ||
| Q1, Q3 | 37.00, 49.00 | 34.90, 44.08 | ||