| Cardiology Research, ISSN 1923-2829 print, 1923-2837 online, Open Access |
| Article copyright, the authors; Journal compilation copyright, Cardiol Res and Elmer Press Inc |
| Journal website https://cr.elmerpub.com |
Original Article
Volume 17, Number 5, October 2026, pages 453-458
Concordance Between E/e’ Ratio and N-Terminal Pro-B-type Natriuretic Peptide Levels for Predicting Post-Discharge Heart Failure Events Within Ninety Days After Acute Coronary Syndrome
Figure

Tables
| Characteristic | Concordantly low (n = 34) | Discordant (n = 69) | Concordantly high (n = 92) | P value |
|---|---|---|---|---|
| Data are presented as n (%), mean (standard deviation), or median (interquartile range), as appropriate. P values with * are significant at alpha level of 0.05. aOne-way ANOVA; bChi-square; cFisher’s exact; dKruskal–Wallis. BMI: body mass index; NSTEMI: non–ST-segment elevation myocardial infarction; eGFR: estimated glomerular filtration rate; LVEF: left ventricular ejection fraction; SGLT2: sodium-glucose cotransporter 2; NT-proBNP: N-terminal pro-B-type natriuretic peptide; ANOVA: analysis of variance. | ||||
| Age, years | 61.5 (13.4) | 68.6 (13.1) | 71.7 (12.9) | < 0.001*a |
| BMI, kg/m2 | 25.6 (3.5) | 24.5 (4.6) | 24.7 (4.7) | 0.458a |
| Hypertension | 23 (67.6%) | 54 (78.3%) | 75 (81.5%) | 0.248b |
| Dyslipidemia | 23 (67.6%) | 53 (76.8%) | 72 (78.3%) | 0.454b |
| Diabetes mellitus | 13 (38.2%) | 41 (59.4%) | 46 (50.0%) | 0.122b |
| Coronary artery disease | 9 (26.5%) | 15 (21.7%) | 25 (27.2%) | 0.719b |
| Chronic kidney disease | 4 (11.8%) | 23 (33.3%) | 21 (22.8%) | 0.050b |
| NSTEMI | 23 (67.6%) | 47 (68.1%) | 76 (82.6%) | 0.037*c |
| Killip class III–IV | 2 (5.9%) | 12 (17.4%) | 23 (25.0%) | < 0.001*b |
| eGFR, mL/min/1.73 m2 | 79.9 (61.0, 92.1) | 63.3 (40.0, 86.5) | 60.4 (42.5, 81.1) | 0.011*d |
| LVEF, % | 50.0 (45.0, 60.0) | 41.0 (30.0, 55.0) | 34.0 (24.5, 42.0) | < 0.001*d |
| SGLT2 inhibitor at discharge | 3 (8.8%) | 23 (33.3%) | 33 (35.9%) | 0.011*b |
| Mineralocorticoid receptor antagonist at discharge | 6 (17.6%) | 20 (29.0%) | 39 (42.4%) | 0.021*b |
| Outcome | Total | Concordantly low | Discordant | Concordantly high |
|---|---|---|---|---|
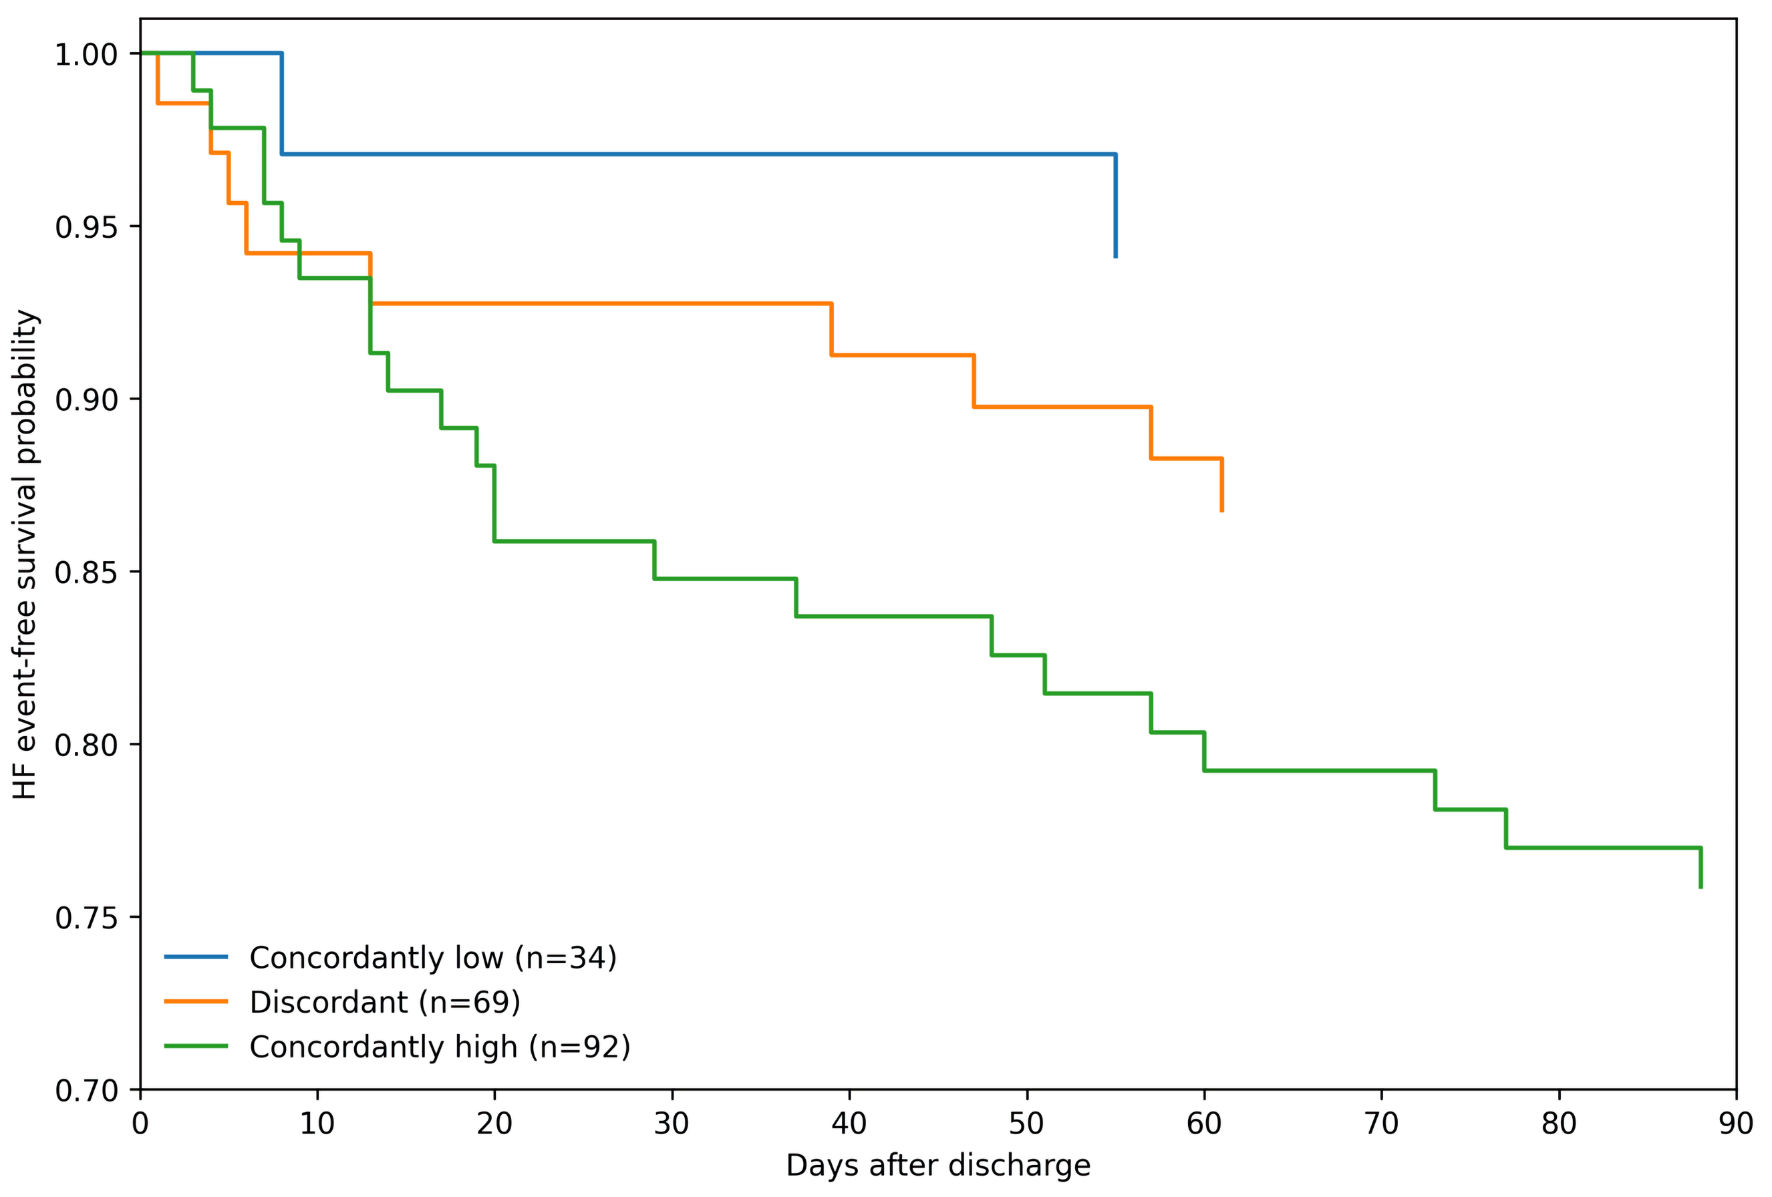
| The log-rank P value was 0.036 for post-discharged HF events. HF: heart failure. | ||||
| Post-discharged HF events, n (%) | 33/195 (16.9%) | 2/34 (5.9%) | 9/69 (13.0%) | 22/92 (23.9%) |
| Total person-days for primary outcome | 15,302 | 2,943 | 5,495 | 6,864 |
| Event rate per 1,000 person-days | 2.16 (1.53–3.03) | 0.68 (0.17–2.72) | 1.64 (0.85–3.15) | 3.21 (2.11–4.87) |
| Group | Univariable HR (95% CI) | P value | Reported adjusted HR (95% CI) | P value |
|---|---|---|---|---|
| The reported multivariable model was adjusted for age category, sex, eGFR, LVEF, sodium-glucose cotransporter-2 inhibitor use, and mineralocorticoid receptor antagonist use. HF: heart failure; HR: hazard ratio; CI: confidence interval; eGFR: estimated glomerular filtration rate; LVEF: left ventricular ejection fraction. | ||||
| Concordantly low | Reference | Reference | ||
| Discordant | 2.36 (0.51–10.93) | 0.271 | 2.40 (0.49–11.73) | 0.279 |
| Concordantly high | 4.50 (1.06–19.14) | 0.042 | 5.97 (1.22–29.10) | 0.027 |
| Outcome | Total | Concordantly low | Discordant | Concordantly high |
|---|---|---|---|---|
| Log-rank P values were 0.046 for all-cause mortality, and 0.028 for HF hospitalization. HF: heart failure. | ||||
| All-cause mortality, n (%) | 6/195 (3.1%) | 0/34 (0.0%) | 2/69 (2.9%) | 4/92 (4.4%) |
| HF hospitalization, n (%) | 17/195 (8.7%) | 1/34 (2.9%) | 5/69 (7.3%) | 11/92 (12.0%) |