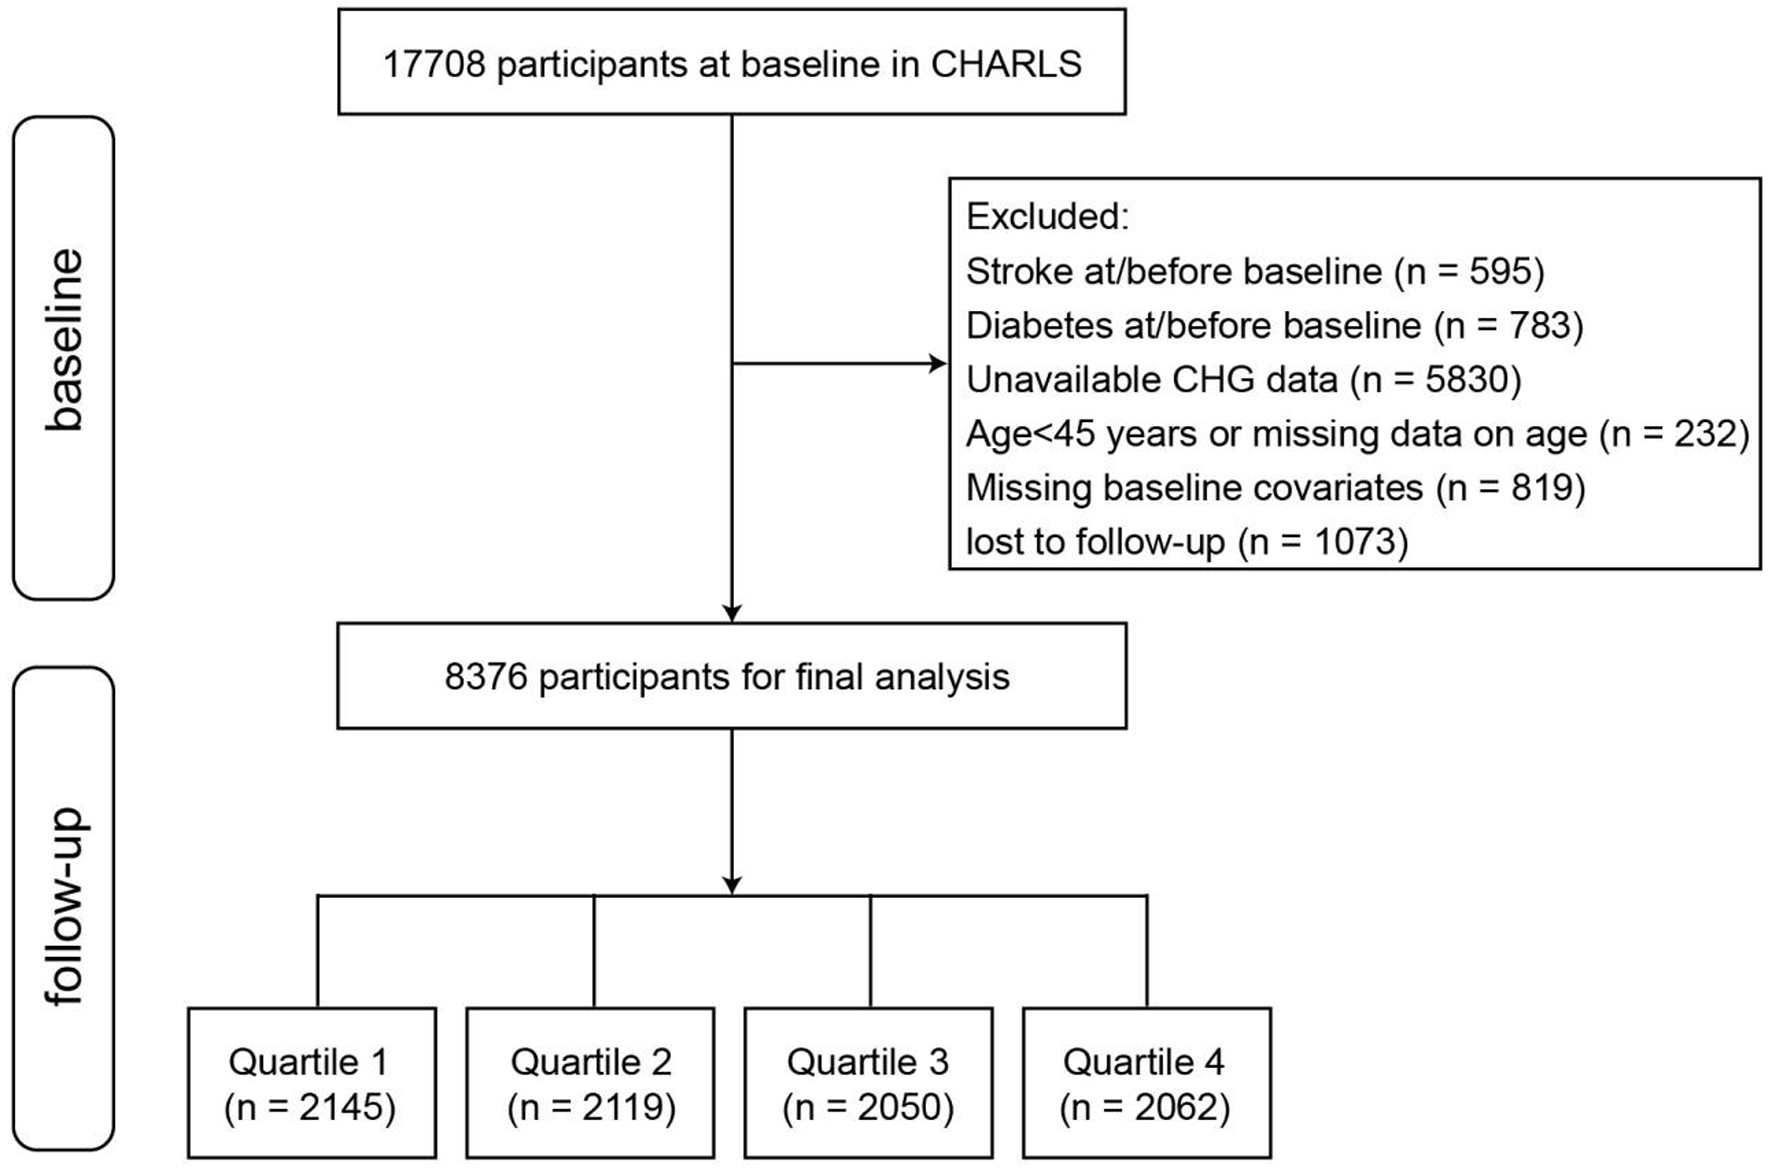
↓ Figure 1. Flowchart of the study participants.
| Cardiology Research, ISSN 1923-2829 print, 1923-2837 online, Open Access |
| Article copyright, the authors; Journal compilation copyright, Cardiol Res and Elmer Press Inc |
| Journal website https://cr.elmerpub.com |
Original Article
Volume 17, Number 5, October 2026, pages 497-508
Association Between Cholesterol–HDL–Glucose Index and Stroke Risk in Middle-Aged and Elderly Adults Without Diabetes: Evidence From Two National Cohort Studies
Figures
Tables
| Characteristics | Overall | Quartiles of CHG | P value | |||
|---|---|---|---|---|---|---|
| Q1 | Q2 | Q3 | Q4 | |||
| Data are presented as median (interquartile range) or n (%). BMI: body mass index; CHG index: cholesterol–HDL–glucose index; DBP: diastolic blood pressure; FBG: fasting blood glucose; HbA1c: hemoglobin A1c; HDL-C: high-density lipoprotein cholesterol; LDL-C: low-density lipoprotein cholesterol; SBP: systolic blood pressure; TC: total cholesterol; TG: triglyceride; WC: waist circumference. | ||||||
| Number of participants | 8,376 | 2,145 | 2,119 | 2,050 | 2,062 | |
| Age, years | 57.00 (51.00–63.00) | 57.00 (50.00–63.00) | 57.00 (51.00–63.00) | 57.00 (51.00–63.00) | 58.00 (52.00–64.00) | 0.009 |
| Gender, n (%) | 0.088 | |||||
| Male | 3,746 (44.72%) | 1,008 (46.99%) | 922 (43.51%) | 914 (44.59%) | 902 (43.74%) | |
| Female | 4,630 (55.28%) | 1,137 (53.01%) | 1,197 (56.49%) | 1,136 (55.41%) | 1,160 (56.26%) | |
| Marital status, n (%) | 0.026 | |||||
| Married | 8,239 (98.36%) | 2,095 (97.67%) | 2,090 (98.63%) | 2,018 (98.44%) | 2,036 (98.74%) | |
| Others | 137 (1.64%) | 50 (2.33%) | 29 (1.37%) | 32 (1.56%) | 26 (1.26%) | |
| Residence, n (%) | < 0.001 | |||||
| Rural | 7,008 (83.67%) | 1,889 (88.07%) | 1,806 (85.23%) | 1,688 (82.34%) | 1,625 (78.81%) | |
| Urban | 1368 (16.33%) | 256 (11.93%) | 313 (14.77%) | 362 (17.66%) | 437 (21.19%) | |
| Education, n (%) | 0.078 | |||||
| Below primary school | 3,907 (46.64%) | 1,066 (49.70%) | 975 (46.01%) | 948 (46.24%) | 918 (44.52%) | |
| Primary school | 1,809 (21.60%) | 449 (20.93%) | 477 (22.51%) | 434 (21.17%) | 449 (21.77%) | |
| Middle school | 1,758 (20.99%) | 417 (19.44%) | 449 (21.19%) | 438 (21.37%) | 454 (22.02%) | |
| High school or above | 902 (10.77%) | 213 (9.93%) | 218 (10.29%) | 230 (11.22%) | 241 (11.69%) | |
| Smoking, n (%) | 3,116 (37.20%) | 845 (39.39%) | 769 (36.29%) | 762 (37.17%) | 740 (35.89%) | 0.082 |
| Drinking, n (%) | 3,178 (37.94%) | 905 (42.19%) | 787 (37.14%) | 753 (36.73%) | 733 (35.55%) | < 0.001 |
| Hypertension, n (%) | 2,705 (32.29%) | 528 (24.62%) | 600 (28.32%) | 700 (34.15%) | 877 (42.53%) | < 0.001 |
| Dyslipidemia, n (%) | 3,983 (47.55%) | 287 (13.38%) | 619 (29.21%) | 1,206 (58.83%) | 1,871 (90.74%) | < 0.001 |
| Cancer, n (%) | 80 (0.96%) | 18 (0.84%) | 22 (1.04%) | 19 (0.93%) | 21 (1.02%) | 0.904 |
| Heart disease, n (%) | 914 (10.91%) | 198 (9.23%) | 221 (10.43%) | 219 (10.68%) | 276 (13.39%) | < 0.001 |
| Kidney disease, n (%) | 531 (6.34%) | 156 (7.27%) | 134 (6.32%) | 115 (5.61%) | 126 (6.11%) | 0.160 |
| Medication, n (%) | ||||||
| Lipid-lowering | 395 (4.72%) | 40 (1.86%) | 80 (3.78%) | 90 (4.39%) | 185 (8.97%) | 0.002 |
| Antihypertensive | 1,455 (17.37%) | 259 (12.07%) | 292 (13.78%) | 376 (18.34%) | 528 (25.61%) | 0.011 |
| WC, cm | 84.20 (77.30–91.50) | 79.20 (73.60–86.00) | 82.40 (76.40–89.00) | 86.40 (79.50–93.07) | 90.00 (83.00–97.00) | < 0.001 |
| BMI, kg/m2 | 23.17 (20.90–25.81) | 21.50 (19.73–23.77) | 22.64 (20.62–24.84) | 23.86 (21.56–26.30) | 24.99 (22.70–27.55) | < 0.001 |
| SBP, mm Hg | 125.67 (113.67–140.33) | 122.00 (111.00–136.67) | 123.67 (112.33–138.33) | 127.33 (115.00–141.33) | 130.50 (118.67–145.00) | < 0.001 |
| DBP, mm Hg | 74.33 (67.00–83.00) | 72.33 (65.00–81.00) | 73.33 (66.00–82.00) | 75.00 (68.33–83.33) | 77.33 (70.00–85.33) | < 0.001 |
| TC, mg/dL | 190.21 (167.40–214.95) | 173.20 (155.03–195.62) | 186.34 (165.46–207.60) | 195.43 (173.20–216.88) | 209.15 (184.79–239.31) | < 0.001 |
| TG, mg/dL | 105.32 (75.22–153.99) | 72.57 (57.53–93.81) | 92.04 (71.68–120.36) | 121.25 (92.04–157.53) | 178.77 (126.78–249.57) | < 0.001 |
| HDL-C, mg/dL | 49.48 (40.59–59.92) | 63.02 (54.90–73.45) | 52.96 (46.39–60.70) | 45.23 (39.82–52.19) | 37.89 (32.47–44.46) | < 0.001 |
| LDL-C, mg/dL | 114.82 (94.33–137.63) | 96.26 (81.96–112.89) | 115.21 (97.81–132.60) | 124.87 (104.87–144.88) | 128.74 (103.32–156.57) | < 0.001 |
| HbA1c, % | 5.10 (4.90–5.40) | 5.00 (4.80–5.30) | 5.10 (4.90–5.40) | 5.20 (4.90–5.40) | 5.30 (5.00–5.70) | < 0.001 |
| FBG, mg/dL | 100.06 (92.27–110.32) | 94.32 (87.48–100.98) | 99.72 (93.69–106.47) | 103.50 (96.84–112.14) | 106.88 (99.48–118.27) | < 0.001 |
| CHG index | 5.28 (5.03–5.55) | 4.87 (4.75–4.96) | 5.16 (5.10–5.23) | 5.41 (5.34–5.48) | 5.78 (5.65–5.98) | 0.009 |
| Stroke, n (%) | 651 (7.77%) | 115 (5.36%) | 147 (6.94%) | 179 (8.73%) | 210 (10.18%) | < 0.001 |
| Case | Model 1 | Model 2 | Model 3 | ||||
|---|---|---|---|---|---|---|---|
| HR (95% CI) | P value | HR (95% CI) | P value | HR (95% CI) | P value | ||
| Model 1: unadjusted. Model 2: adjusted for age and gender. Model 3: adjusted for age, gender, marital status, residence, education, smoking status, drinking status, and hypertension. CHG index: cholesterol–HDL–glucose index; CI: confidence interval; HR: hazard ratio. | |||||||
| CHG (per 1-unit) | 651 | 1.258 (1.065–1.486) | 0.007 | 1.264 (1.070–1.493) | 0.006 | 1.255 (1.038–1.518) | 0.019 |
| CHG quartile | |||||||
| Q1 | 115 | Ref | Ref | Ref | |||
| Q2 | 147 | 1.358 (1.063–1.734) | 0.014 | 1.366 (1.070–1.744) | 0.012 | 1.378 (1.073–1.771) | 0.012 |
| Q3 | 179 | 1.414 (1.118–1.789) | 0.004 | 1.417 (1.120–1.793) | 0.004 | 1.447 (1.137–1.842) | 0.003 |
| Q4 | 210 | 1.473 (1.173–1.851) | < 0.001 | 1.481 (1.179–1.861) | < 0.001 | 1.463 (1.147–1.868) | 0.002 |