| Cardiology Research, ISSN 1923-2829 print, 1923-2837 online, Open Access |
| Article copyright, the authors; Journal compilation copyright, Cardiol Res and Elmer Press Inc |
| Journal website https://cr.elmerpub.com |
Original Article
Volume 17, Number 5, October 2026, pages 489-496
Relationship Between the Systemic Coagulation–Inflammation Index and Radial Artery Occlusion After Transradial Coronary Angiography
Figure

Tables
| Variables | RAO (+) (n = 96) | RAO (–) (n = 1,959) | P value |
|---|---|---|---|
| RAO: radial artery occlusion; COPD: chronic obstructive pulmonary disease; ASA: acetylsalicylic acid; PCI: percutaneous coronary intervention; WBC: white blood cell count; AST: aspartate aminotransferase; CRP: C-reactive protein; LDL: low-density lipoprotein cholesterol; HDL: high-density lipoprotein cholesterol; NLR: neutrophil-to-lymphocyte ratio; PLR: platelet-to-lymphocyte ratio; SII: Systemic Immune–Inflammation Index; SCII: Systemic Coagulation–Inflammation Index. | |||
| Age (years) | 55.4 ± 11.4 | 60.5 ± 12.1 | < 0.001 |
| Male sex, n (%) | 58 (60.4%) | 1390 (71.0%) | 0.033 |
| Hypertension, n (%) | 47 (49.0%) | 920 (47.0%) | 0.667 |
| Diabetes mellitus, n (%) | 11 (11.5%) | 98 (5.0%) | 0.008 |
| COPD, n (%) | 7 (7.3%) | 119 (6.1%) | 0.640 |
| Stroke, n (%) | 3 (3.1%) | 39 (2.0%) | 0.489 |
| Atrial fibrillation, n (%) | 5 (5.2%) | 78 (4.0%) | 0.796 |
| Medications | |||
| ASA, n (%) | 41 (42.7%) | 803 (41.0%) | 0.753 |
| P2Y12 inhibitors, n (%) | 33 (34.4%) | 685 (35.0%) | 0.885 |
| Oral anticoagulants, n (%) | 6 (6.2%) | 84 (4.3%) | 0.408 |
| Statins, n (%) | 38 (39.6%) | 627 (32.0%) | 0.210 |
| Procedure type | |||
| PCI | 19 (19.8%) | 594 (30.3%) | 0.024 |
| Laboratory | |||
| Hemoglobin (g/dL) | 14.2 ± 1.6 | 14.5 ± 1.4 | 0.093 |
| WBC (103/µL) | 8.30 ± 1.46 | 8.54 ± 1.83 | 0.129 |
| Neutrophil (103/µL) | 5.9 ±1.0 | 5.7 ± 1.0 | 0.115 |
| Lymphocyte (103/µL) | 1.61 ± 0.58 | 1.73 ± 0.54 | 0.084 |
| Platelet (103/µL) | 293 ± 65 | 257 ± 79 | 0.001 |
| AST (U/L) | 30 ± 18 | 27 ± 16 | 0.218 |
| CRP (mg/L) | 12.1 ± 5.6 | 10.8 ± 7.4 | 0.020 |
| Creatinine (mg/dL) | 1.08 ± 0.32 | 0.97 ± 0.38 | 0.004 |
| Glucose (mg/dL) | 106 ± 32 | 112 ± 35 | 0.114 |
| Albumin (g/L) | 42.3 ± 4.9 | 41.3 ± 5.3 | 0.128 |
| Fibrinogen (mg/dL) | 342 ± 68 | 308 ± 65 | 0.001 |
| Triglyceride (mg/dL) | 184 ± 69 | 173 ± 61 | 0.092 |
| LDL (mg/dL) | 115 ± 45 | 121 ± 47 | 0.105 |
| HDL (mg/dL) | 38 ± 9 | 40 ± 10 | 0.209 |
| NLR | 3.66 ± 1.20 | 3.30 ± 1.10 | 0.004 |
| PLR | 182 ± 52 | 149 ± 46 | < 0.001 |
| SII | 1070 ± 380 | 850 ± 330 | < 0.001 |
| SCII | 120.7 ± 36.4 | 93.1 ± 41.5 | < 0.001 |
| Variables | Univariate OR (95% CI) | P value | Multivariate OR (95% CI) | P value |
|---|---|---|---|---|
| CI: confidence interval; OR: odds ratio; DM: diabetes mellitus; PCI: percutaneous coronary intervention; CRP: C-reactive protein; SCII: Systemic Coagulation–Inflammation Index. | ||||
| Age, years | 0.966 (0.950–0.982) | < 0.001 | 0.966 (0.949–0.983) | < 0.001 |
| Sex | 0.638 (0.420–0.967) | 0.034 | 0.701 (0.453–1.083) | 0.109 |
| DM | 2.354 (1.232–4.499) | 0.010 | 2.342 (1.203–4.560) | 0.012 |
| PCI | 0.576 (0.345–0.960) | 0.030 | 0.614 (0.361–1.042) | 0.068 |
| CRP (mg/L) | 1.019 (1.005–1.039) | 0.003 | 1.015 (0.987–1.044) | 0.285 |
| Creatinine (mg/dL) | 2.030 (1.302–3.183) | 0.002 | 1.340 (0.801–2.252) | 0.270 |
| SCII (per 10-unit increase) | 1.189 (1.140–1.239) | < 0.001 | 1.174 (1.120–1.228) | < 0.001 |
| Variable | AUC | 95% CI | P value |
|---|---|---|---|
| AUC: area under the curve; CI: confidence interval; SCII: Systemic Coagulation–Inflammation Index; PLR: platelet-to-lymphocyte ratio; SII: Systemic Immune–Inflammation Index; NLR: neutrophil-to-lymphocyte ratio. | |||
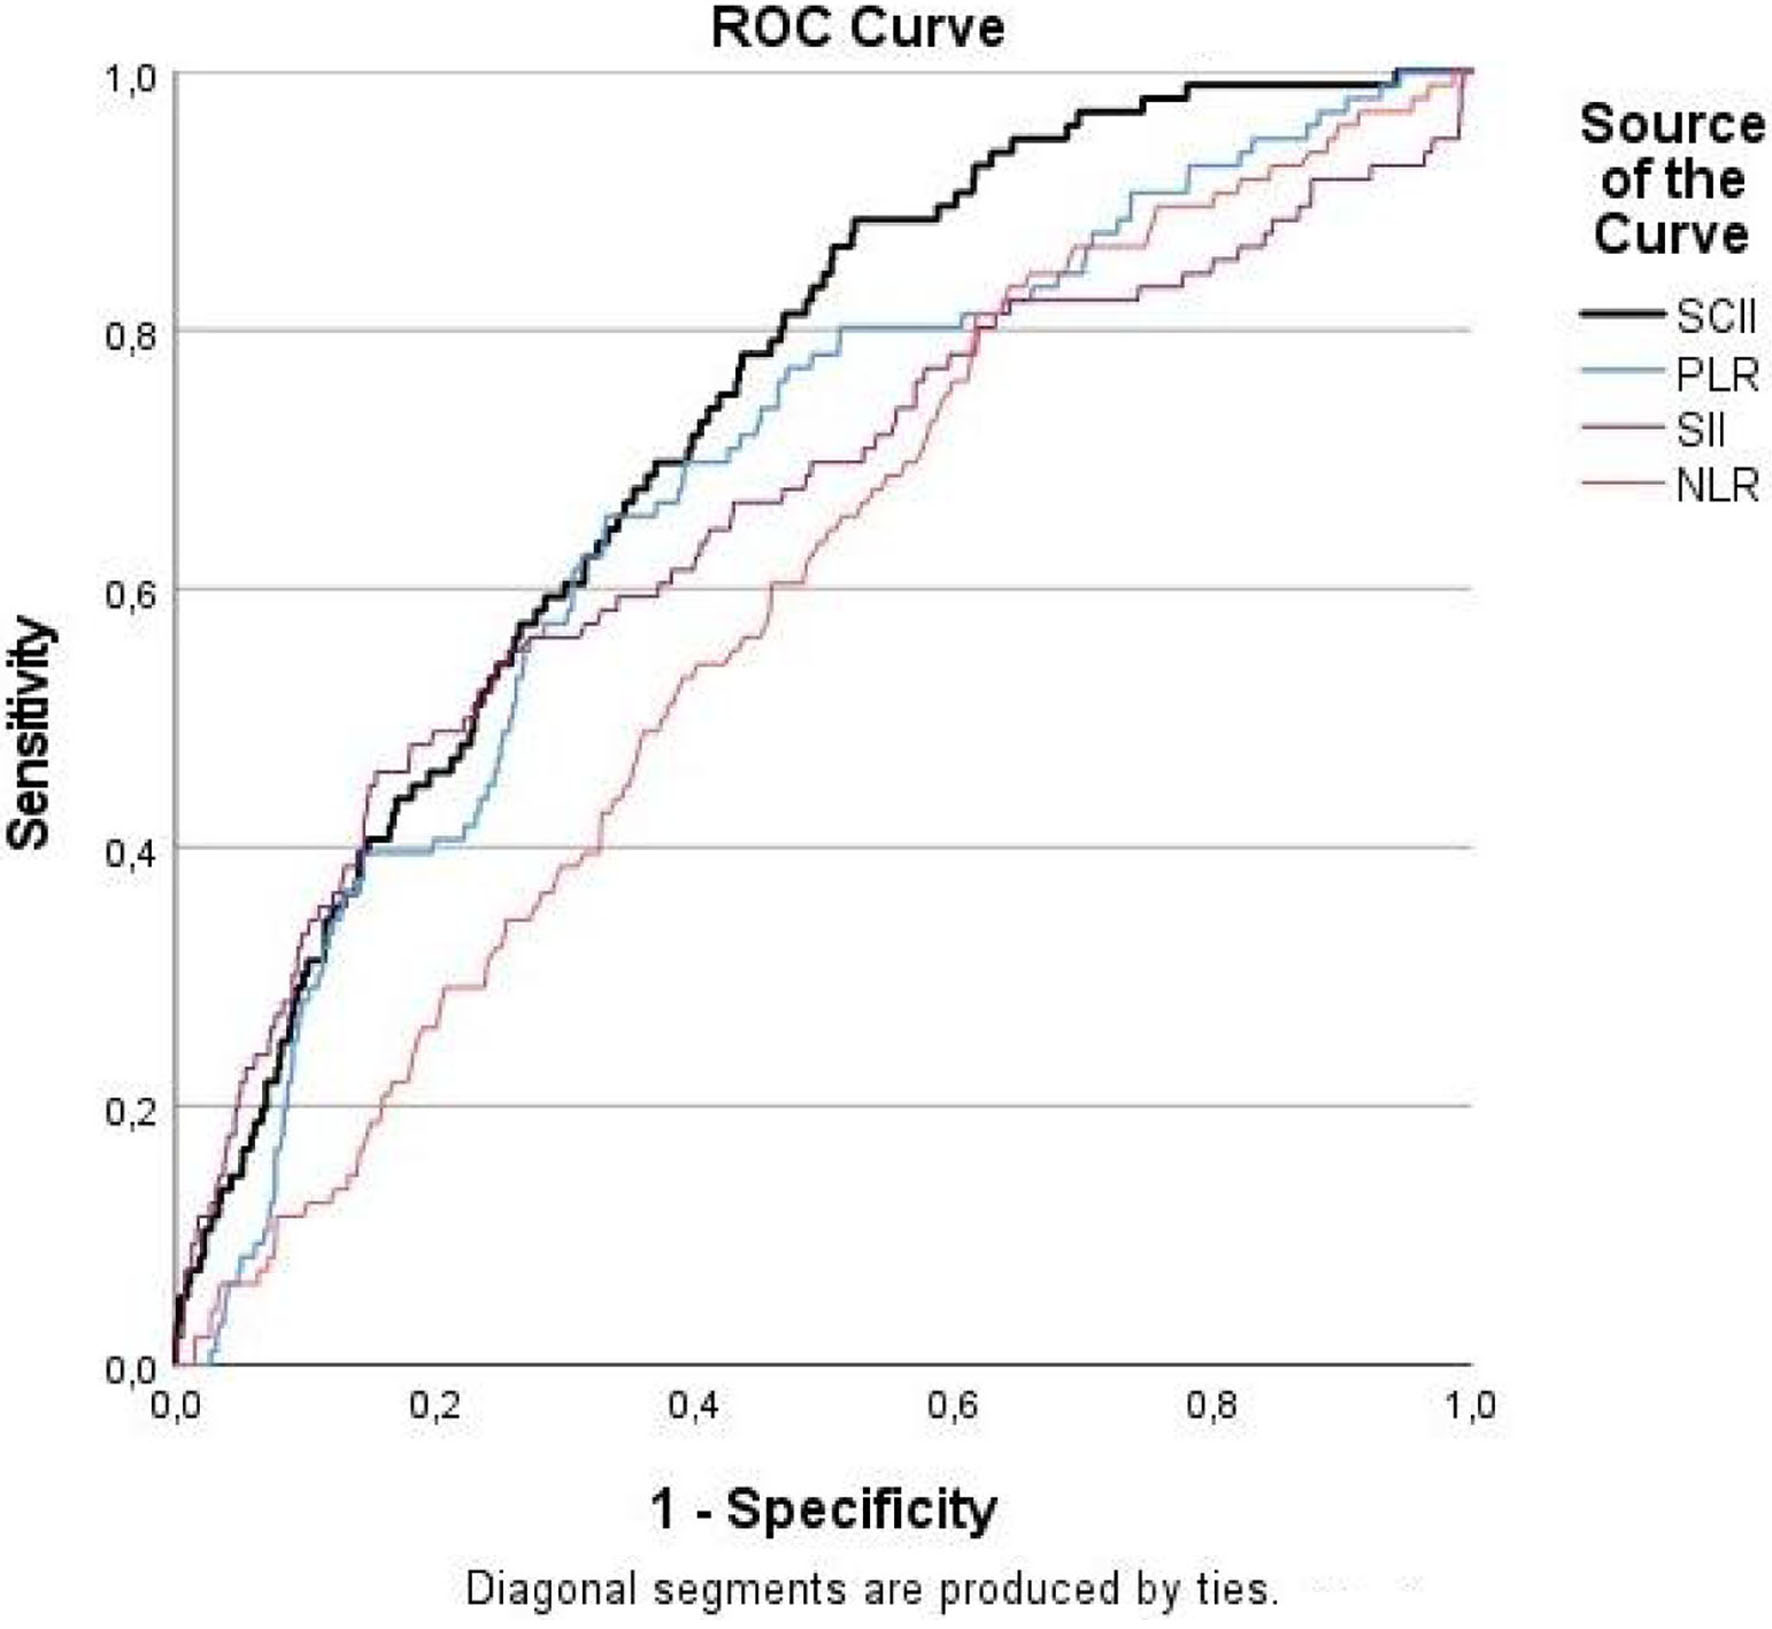
| SCII | 0.730 | 0.686–0.774 | < 0.001 |
| PLR | 0.678 | 0.625–0.732 | < 0.001 |
| SII | 0.659 | 0.594–0.723 | < 0.001 |
| NLR | 0.589 | 0.536–0.643 | 0.003 |