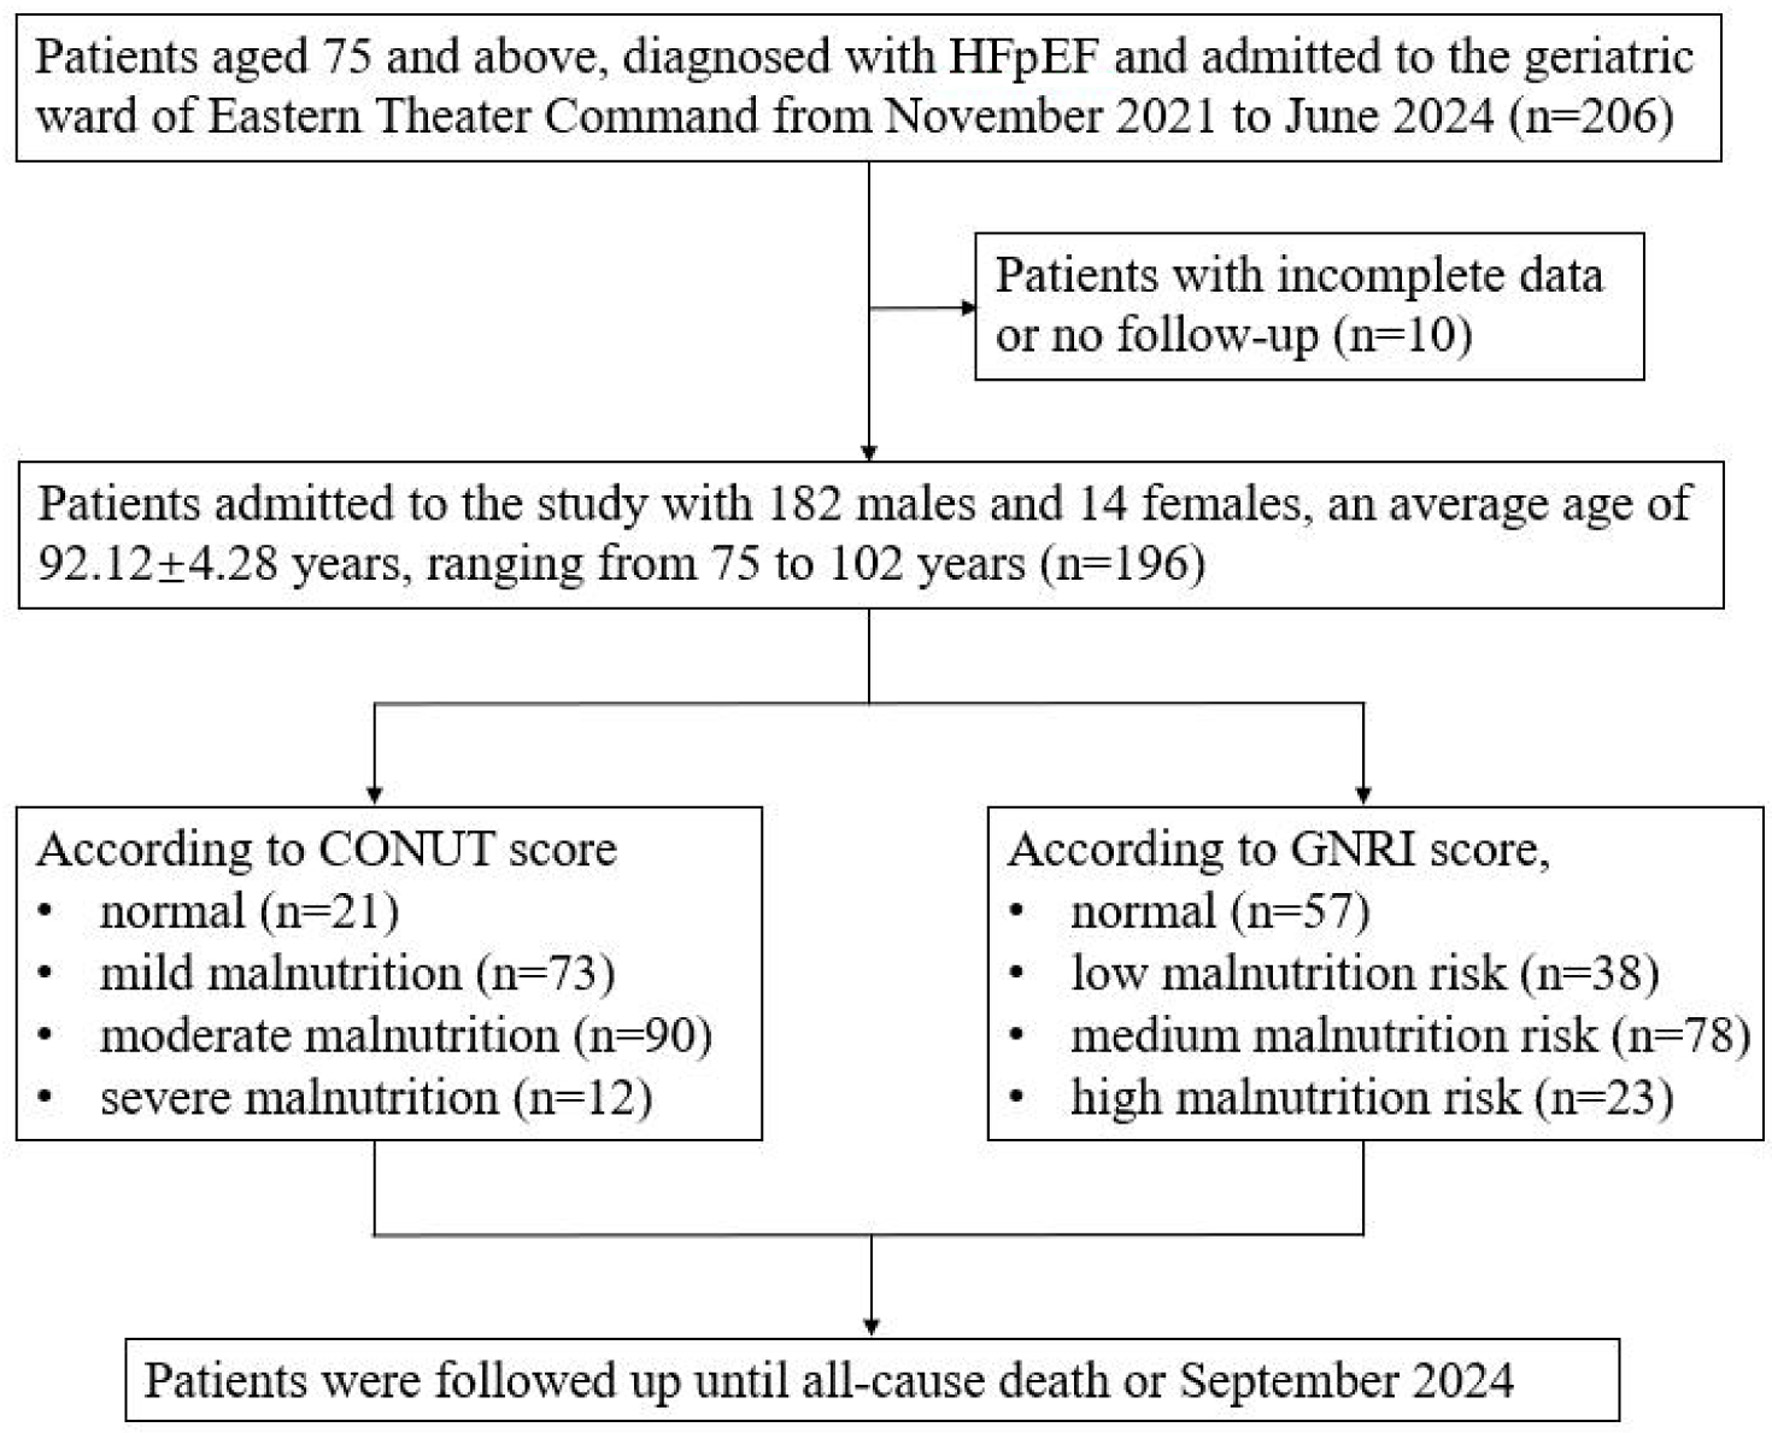
↓ Figure 1. Patient flowchart. HFpEF: heart failure with preserved ejection fraction; CONUT: Controlling Nutritional Status; GNRI: Geriatric Nutritional Risk Index.
| Cardiology Research, ISSN 1923-2829 print, 1923-2837 online, Open Access |
| Article copyright, the authors; Journal compilation copyright, Cardiol Res and Elmer Press Inc |
| Journal website https://cr.elmerpub.com |
Original Article
Volume 000, Number 000, October 2026, pages 000-000
Prognostic Value of the Geriatric Nutritional Risk Index and Controlling Nutritional Status Score in Patients Aged ≥ 75 Years With Heart Failure With Preserved Ejection Fraction
Figures
Tables
| Characteristic | CONUT score | P value | |||||||||
|---|---|---|---|---|---|---|---|---|---|---|---|
| Normal (0–1, n = 21) | Mild malnutrition (2–4, n = 73) | Moderate malnutrition (5–8, n = 90) | Severe malnutrition (9–12, n = 12) | ||||||||
| General situation | |||||||||||
| Hospitalization days (days) | 18 (10, 33) | 29 (17, 41) | 31 (20, 47)a | 46 (22, 55)a | 0.011 | ||||||
| Age (years) | 93 (91, 95) | 92 (90, 94) | 92 (91, 94) | 94 (92, 96) | 0.318 | ||||||
| Male (%) | 20 (95.2) | 67 (91.8) | 85 (94.4) | 10 (83.3) | 0.413 | ||||||
| Heart rate (beats/min) | 70 (66, 78) | 72 (66, 81) | 73 (65, 80) | 78 (75, 89) | 0.078 | ||||||
| Systolic blood pressure (mm Hg) | 132 (120, 158) | 132 (120, 144) | 132 (120, 145) | 123 (115, 145) | 0.560 | ||||||
| Diastolic blood pressure (mm Hg) | 71 (62, 80) | 71 (61, 78) | 68 (62, 76) | 73 (63, 77) | 0.452 | ||||||
| BMI (kg/m2) | 22.0 (21.5, 24.6) | 23.0 (22.5, 25.9) | 22.4 (20.8, 24.2) | 24.5 (22.0, 24.7) | 0.289 | ||||||
| CONUT score | 1 (0, 1) | 3 (2.5, 4)a | 6 (5, 7)a, b | 9 (9, 9)a, b, c | < 0.001 | ||||||
| GNRI score | 98.4 (96.1, 102.6) | 96.5 (91.6, 105.0)a | 88.0 (83.9, 91.4)a, b | 82.1 (76.5, 87.1)a, b, c | < 0.001 | ||||||
| Laboratory data | |||||||||||
| Albumin (g/L) | 38.4 ± 1.8 | 36.2 ± 4.0a | 31.0 ± 3.0a, b | 26.5 ± 2.6a, b, c | < 0.001 | ||||||
| Lymphocyte (× 109/L) | 1.8 (1.7, 2.1) | 1.5 (1.2, 1.9)a | 1.0 (0.7, 1.2)a, b | 0.7 (0.6, 1.4)a, b | < 0.001 | ||||||
| Cholesterol (mmol/L) | 4.6 (3.9, 5.5) | 3.7 (2.9, 4.0)a | 3.3 (2.9, 3.8)a | 2.6 (2.5, 3.3)a, b, c | < 0.001 | ||||||
| Hemoglobin (g/L) | 124 (116, 131) | 120 (100.5, 130) | 107 (96.5, 120)a, b | 99 (85.3, 121)a, b | < 0.001 | ||||||
| C-reactive protein (mg/L) | 0.5 (0.5, 3.5) | 2.2 (0.5, 15.1) | 14.5 (3.7, 52.2)a, b | 13.6 (3.3, 50.6)a, b | < 0.001 | ||||||
| Urea nitrogen (mmol/L) | 8 (6.7, 12.5) | 10.1 (7.6, 14) | 9.2 (7.1, 13.6) | 10.0 (6.7, 14) | 0.419 | ||||||
| Creatinine (µmol/L) | 101.6 (80.2, 124.5) | 110.4 (80.8, 174.5) | 102.2 (79.6, 141.1) | 100.8 (63.8, 135.4) | 0.535 | ||||||
| Prealbumin (mg/L) | 229.2 ± 43.6 | 209.3 ± 51.6 | 185.3 ± 58.5a, b | 150.5 ± 80.1a, b | <0.001 | ||||||
| Triglyceride (mmol/L) | 1.1 (0.9, 1.3) | 1.0 (0.7, 1.3) | 0.9 (0.6, 1.3) | 0.7 (0.6, 1.1) | 0.173 | ||||||
| LDL-C (mmol/L) | 2.4 (2.0, 3.0) | 1.7 (1.3, 2.1)a | 1.6 (1.3, 2.0)a | 1.4 (1.1, 1.7)a, b, c | < 0.001 | ||||||
| HDL-C (mmol/L) | 1.2 (1.0, 1.5) | 1.0 (0.8, 1.2)a | 0.9 (0.8, 1.2)a | 0.9 (0.8, 1.1)a | 0.003 | ||||||
| PCT (µg/L) | 0.05 (0.03, 0.11) | 0.07 (0.04, 0.11) | 0.11 (0.06, 0.22)a, b | 0.10 (0.06, 0.27)a | < 0.001 | ||||||
| IL-6 (ng/L) | 7.5 (3.7, 12.3) | 10.7 (7.5, 20.9)a | 18.9 (8.9, 37.8)a, b | 36.6 (13.3, 56.7)a, b | < 0.001 | ||||||
| NT-proBNP (pmol/L) | 230.8 (143.8, 341.5) | 269.5 (195, 392.9) | 329.0 (225.5, 519.3)a, b | 398.4 (242.8, 600.8)a | 0.012 | ||||||
| TSAT (%) | 0.31 (0.24, 0.40) | 0.26 (0.19, 0.34) | 0.24 (0.18, 0.33)a | 0.20 (0.15, 0.27)a | 0.041 | ||||||
| SF (µmol/L) | 13.2 (11.6, 18.8) | 11.6 (8.0, 13.8)a | 9.1 (6.5, 11.5)a, b | 8.1 (5.4, 10.3)a, b | < 0.001 | ||||||
| UIBC (µmol/L) | 31.8 (27.5, 38.1) | 30.4 (23.5, 37.5) | 25.5 (20.6, 32.1)a, b | 28.4 (22.5, 32.9) | 0.009 | ||||||
| TIBC (µmol/L) | 48.7 (42.9, 52.3) | 42.9 (34.2, 51.1)a | 35.7 (30.3, 41.4)a, b | 36.1 (30.8, 41.9)a | < 0.001 | ||||||
| Echocardiographic data | |||||||||||
| LVEF (%) | 63 (58.5, 69) | 60 (57, 64) | 61 (56, 66.3) | 59.5 (55.8, 64) | 0.180 | ||||||
| AOD (mm) | 34 (32, 37) | 34 (32, 37.5) | 35 (32.8, 38) | 34.5 (33.3, 36.8) | 0.797 | ||||||
| LAD (mm) | 43 (37.5, 45) | 44 (38.5, 48.5) | 41 (37, 45) | 41 (39.3, 44.8) | 0.072 | ||||||
| LVDD (mm) | 47 (42.5, 49.5) | 47 (43.5, 50.5) | 47 (44, 51) | 45 (42.3, 46.8) | 0.167 | ||||||
| RVD (mm) | 24 (21, 26) | 25 (23, 26) | 25 (22, 26) | 24 (22.3, 26.8) | 0.417 | ||||||
| IVS (mm) | 11 (10, 12) | 11 (10, 12) | 11 (10, 12) | 11 (11, 13) | 0.155 | ||||||
| LVPW (mm) | 10 (9, 11) | 10 (10, 11) | 10 (10, 11) | 11 (10, 13) | 0.284 | ||||||
| Comorbidity | |||||||||||
| Hypertension (%) | 15 (71.4) | 59 (80.8) | 70 (77.8) | 9 (75) | 0.776 | ||||||
| Diabetes (%) | 5 (23.8) | 32 (43.8) | 40 (44.4) | 5 (41.7) | 0.373 | ||||||
| Coronary heart disease (%) | 20 (95.2) | 70 (95.9) | 85 (94.4) | 12 (100) | 0.940 | ||||||
| COPD (%) | 2 (9.5) | 29 (39.7)a | 31 (34.3)a | 5 (41.7)a | 0.055 | ||||||
| Chronic renal insufficiency (%) | 8 (38.1) | 33 (45.2) | 41 (45.6) | 5 (41.7) | 0.931 | ||||||
| Anemia (%) | 2 (9.5) | 28 (38.4)a | 54 (60.0)a, b | 7 (58.3)a | < 0.001 | ||||||
| Atrial fibrillation (%) | 10 (47.6) | 40 (54.8) | 28 (31.1)b | 7 (58.3) | 0.014 | ||||||
| Medications | |||||||||||
| Diuretic (%) | 10 (47.6) | 48 (65.8) | 55 (61.1) | 9 (75) | 0.366 | ||||||
| ACEI/ARB/ARNI (%) | 11 (52.4) | 27 (37.0) | 16 (17.8)a, b | 3 (25) | 0.003 | ||||||
| β-Blocker (%) | 11 (52.4) | 45 (61.6) | 37 (41.1)b | 7 (58.3) | 0.069 | ||||||
| Spironolactone (%) | 7 (33.3) | 34 (46.6) | 34 (37.8) | 4 (33.3) | 0.552 | ||||||
| SGLT2i (%) | 2 (9.5) | 6 (8.2) | 1 (1.1) | 0 (0) | 0.064 | ||||||
| Cardiotonic (%) | 0 (0) | 6 (8.2) | 6 (6.7) | 4 (33.3)a, b, c | 0.024 | ||||||
| Iron agents (%) | 0 (0) | 11 (15.1) | 12 (13.3) | 3 (25) | 0.128 | ||||||
| Nutrition support (%) | 4 (19.0) | 19 (26.0) | 38 (42.2)a, b | 9 (75)a, b, c | 0.002 | ||||||
| GNRI score | |||||||||||
| Normal (> 98, n = 57) | Low malnutrition risk (92 ≤ GNRI ≤ 98, n = 38) | Medium malnutrition risk (82 ≤ GNRI < 92, n = 78) | High malnutrition risk (< 82, n = 23) | ||||||||
| aP values < 0.05 vs. normal malnutrition or no risk of malnutrition. bP values < 0.05 vs. mild malnutrition or low malnutrition risk. cP values < 0.05 vs. moderate malnutrition or medium malnutrition risk. BMI: body mass index; CONUT: Controlling Nutritional Status; GNRI: Geriatric Nutritional Risk Index; LDL-C: low-density lipoprotein cholesterol; HDL-C: high-density lipoprotein cholesterol; PCT: procalcitonin; IL-6: interleukin-6; NT-proBNP: N-terminal pro-B-type natriuretic peptide; TSAT: transferrin saturation; SF: serum ferritin; UIBC: unsaturated iron-binding capacity; TIBC: total iron-binding capacity; LVEF: left ventricular ejection fraction; AOD: aortic diameter; LAD: left atrial diameter; LVDD: left ventricular diastolic diameter; RVD: right ventricular diameter; IVS: interventricular septum; LVPW: left ventricular posterior wall; COPD: chronic obstructive pulmonary disease; ACEI: angiotensin-converting-enzyme inhibitor; ARB: angiotensin II receptor blocker; ARNI: angiotensin-receptor-neprilysin inhibitor; SGLT2i: sodium-dependent glucose transporters 2 inhibitor. | |||||||||||
| General situation | |||||||||||
| Hospitalization days (days) | 27 (16, 40) | 28.5 (16.8, 39.3) | 29 (18, 43.3) | 42 (25, 56)a, b, c | 0.037 | ||||||
| Age (years) | 92 (90, 94) | 92.5 (90.5, 94) | 93 (90, 94.25) | 94 (91, 97) | 0.149 | ||||||
| Male (%) | 53 (93.0) | 35 (92.1) | 75 (96.2) | 19 (82.6) | 0.175 | ||||||
| Heart rate (beats/min) | 73 (68, 79.5) | 70 (63.5, 83.5) | 73 (65, 79.25) | 77 (70, 84) | 0.559 | ||||||
| Systolic blood pressure (mm Hg) | 134 (119.5, 150) | 138.5 (121, 150) | 126 (120, 144) | 135 (115, 140) | 0.515 | ||||||
| Diastolic blood pressure (mm Hg) | 70 (63, 79) | 70 (61.75, 77) | 68 (61.75, 76) | 70 (63, 79) | 0.36 | ||||||
| BMI (kg/m2) | 25.9 (23.7, 28.1) | 22.7 (21.3, 24.4)a | 22 (20.6, 22.9)a, b | 20.3 (19.0, 22.1)a, b | < 0.001 | ||||||
| CONUT score | 3 (2, 4) | 4 (2, 5) | 6 (4, 7)a, b | 7 (6, 9)a, b, c | < 0.001 | ||||||
| GNRI score | 102.6 (99.6, 106.7) | 94.5 (93.1, 96.3)a | 87.8 (86.2, 89.8)a, b | 78.7 (76.3, 80.5)a, b, c | < 0.001 | ||||||
| Laboratory data | |||||||||||
| Albumin (g/L) | 37.63 ± 4.34 | 34.92 ± 0.66a | 31.63 ± 2.49a, b | 26.78 ± 2.44a, b, c | < 0.001 | ||||||
| Lymphocyte (× 109/L) | 1.51 (1.10, 1.82) | 1.40 (0.905, 1.835) | 1.1 (0.735, 1.54)a, b | 1.11 (0.66, 1.56)a, b | 0.001 | ||||||
| Cholesterol (mmol/L) | 3.39 (2.70, 4.00) | 3.75 (3.33, 4.49) | 3.25 (2.91, 3.8525) | 3.63 (3.16, 4.05) | 0.067 | ||||||
| Hemoglobin (g/L) | 118 (99.5, 135.5) | 117 (106.5, 126.25) | 112 (100.75, 123.25) | 99 (87, 109)a, b, c | 0.004 | ||||||
| C-reactive protein (mg/L) | 2.6 (0.5, 14.25) | 2.35 (0.5, 16.15) | 12.1 (2, 44.325)a, b | 18.2 (7.5, 55.1)a, b | < 0.001 | ||||||
| Urea nitrogen (mmol/L) | 10.2 (7.65, 13.9) | 9.4 (7.2, 12.425) | 8.9 (6.8, 13.375) | 9.5 (7.2, 14) | 0.454 | ||||||
| Creatinine (µmol/L) | 122.7 (81.4, 176.9) | 96.9 (78.4, 136.4) | 98.9 (76.7, 135.9) | 102.9 (78.4, 125.8) | 0.113 | ||||||
| Prealbumin (mg/L) | 221.79 ± 56.29 | 210.03 ± 51.45 | 184.5 ± 49.98a, b | 149 ± 73.7a, b | < 0.001 | ||||||
| Triglyceride (mmol/L) | 1.02 (0.715, 1.32) | 1.03 (0.675, 1.6325) | 0.89 (0.66, 1.28) | 0.79 (0.61, 1.21) | 0.419 | ||||||
| LDL-C (mmol/L) | 1.63 (1.26, 2.28) | 1.82 (1.21, 2.28) | 1.68 (1.37, 2.17) | 1.81 (1.42, 2.13) | 0.916 | ||||||
| HDL-C (mmol/L) | 0.96 (0.79, 1.145) | 1.15 (0.93, 1.47)a | 0.97 (0.81, 1.14)b | 1 (0.85, 1.33) | 0.023 | ||||||
| PCT (µg/L) | 0.08 (0.04, 0.12) | 0.05 (0.04, 0.11) | 0.10 (0.05,0.21)a, b | 0.16 (0.10, 0.39)a, b, c | < 0.001 | ||||||
| IL-6 (ng/L) | 10.65 (5.77, 20.14) | 8.94 (5.62, 17.67) | 17.74 (9.91, 37.84)a, b | 25.6 (13.0, 52.23)a, b | < 0.001 | ||||||
| NT-proBNP (pmol/L) | 249 (208.5, 380.8) | 278.5 (170.8, 373.4) | 316.9 (209.9, 500.7) | 361.4 (270.9, 724.4)a, b | 0.012 | ||||||
| TSAT (%) | 0.27 (0.20, 0.34) | 0.26 (0.23, 0.35) | 0.27 (0.18, 0.35) | 0.22 (0.14, 0.26)a, b, c | 0.033 | ||||||
| SF (µmol/L) | 11.6 (8.4, 15.8) | 12.4 (8.65, 13.525) | 9.6 (6.75, 12.3)a | 6.9 (5.4, 9)a, b, c | < 0.001 | ||||||
| UIBC (µmol/L) | 32.2 (25.95, 38.4) | 30.35 (23.5, 37.93) | 25.75 (20.18, 31.33)a, b | 26.9 (22.4, 32.3)a | 0.001 | ||||||
| TIBC (µmol/L) | 45.1 (37.2, 51.35) | 40.45 (34.85, 51) | 35.85 (30.28, 40.43)a, b | 33.8 (28.2, 42.2)a, b | < 0.001 | ||||||
| Echocardiographic data | |||||||||||
| LVEF (%) | 59 (56, 63.5) | 61 (58, 64) | 61 (57, 66.3) | 60 (57, 66) | 0.558 | ||||||
| AOD (mm) | 35 (42, 50) | 35 (32, 37.25) | 34 (31.75, 38) | 34 (33, 36) | 0.653 | ||||||
| LAD (mm) | 45 (42, 50) | 43 (39.75, 45.5)a | 41 (37, 44)a | 39 (35, 41)a, b | < 0.001 | ||||||
| LVDD (mm) | 48 (45, 50) | 49.5 (44.75, 53) | 45 (43, 49)a, b | 46 (42, 49)a, b | 0.002 | ||||||
| RVD (mm) | 25 (23, 26) | 24 (22.5, 26) | 25 (22, 27) | 23 (18, 26) | 0.102 | ||||||
| IVS (mm) | 11 (10, 12) | 10 (10, 11)a | 11 (10, 12)a | 11 (10, 12) | 0.025 | ||||||
| LVPW (mm) | 11 (10, 12) | 10 (10, 11)a | 10 (9, 11)a | 10 (10, 11) | 0.020 | ||||||
| Comorbidity | |||||||||||
| Hypertension (%) | 47 (82.5) | 28 (73.7) | 61 (78.2) | 17 (73.9) | 0.729 | ||||||
| Diabetes (%) | 27 (47.4) | 16 (42.1) | 32 (41.0) | 7 (30.4) | 0.579 | ||||||
| Coronary heart disease (%) | 55 (96.5) | 37 (97.4) | 75 (96.2) | 20 (87.0) | 0.264 | ||||||
| COPD (%) | 22 (38.6) | 13 (34.2) | 24 (30.8) | 8 (34.8) | 0.825 | ||||||
| Chronic renal insufficiency (%) | 32 (56.1) | 12 (31.6) | 33 (42.3) | 10 (43.5) | 0.119 | ||||||
| Anemia (%) | 24 (42.1) | 13 (34.2) | 37 (46.4) | 17 (73.9)a, b, c | 0.021 | ||||||
| Atrial fibrillation (%) | 34 (59.6) | 14 (36.8)a | 31 (39.7)a | 6 (26.1)a | 0.018 | ||||||
| Medications | |||||||||||
| Diuretic (%) | 37 (64.9) | 19 (50.0) | 49 (62.8) | 17 (73.9) | 0.268 | ||||||
| ACEI/ARB/ARNI (%) | 26 (45.6) | 9 (23.7)a | 21 (26.9) | 1 (4.3)a, b, c | 0.002 | ||||||
| β-Blocker (%) | 35 (61.4) | 17 (44.7) | 35 (44.9) | 13 (56.5) | 0.211 | ||||||
| Spironolactone (%) | 27 (47.4) | 10 (26.3) | 32 (41.0) | 10 (43.5) | 0.223 | ||||||
| SGLT2i (%) | 3 (5.3) | 4 (10.5) | 2 (2.6) | 0 (0) | 0.217 | ||||||
| Cardiotonic (%) | 6 (10.5) | 1 (2.6) | 5 (6.4) | 4 (17.4) | 0.176 | ||||||
| Iron agents (%) | 5 (8.8) | 6 (15.8) | 10 (12.8) | 5 (21.7) | 0.447 | ||||||
| Nutrition support (%) | 10 (17.5) | 11 (28.9) | 31 (39.7) | 18 (78.3)a, b, c | < 0.001 | ||||||
| Prognosis | CONUT score | P value | |||||||||
|---|---|---|---|---|---|---|---|---|---|---|---|
| Normal (0–1, n = 21) | Mild malnutrition (2–4, n = 73) | Moderate malnutrition (5–8, n = 90) | Severe malnutrition (9–12, n = 12) | ||||||||
| All-cause death (%) | 1 (4.8) | 13 (17.8) | 57 (63.3)a, b | 12 (100)a, b | < 0.001 | ||||||
| Cardiovascular death (%) | 0 (0.0) | 4 (5.5) | 14 (15.6) | 3 (25.0) | 0.019 | ||||||
| All-cause readmission (%) | 11 (52.4) | 59 (80.8)a | 84 (93.3)a, b | 10 (83.3)a | < 0.001 | ||||||
| HF-related readmission (%) | 2 (9.5) | 23 (31.5)a | 55 (61.1)a, b | 10 (83.3)a, b | < 0.001 | ||||||
| Prognosis | GNRI score | P value | |||||||||
| Normal (> 98, n = 57) | Low malnutrition risk (92 ≤ GNRI ≤ 98, n = 38) | Medium malnutrition risk (82 ≤ GNRI < 92, n = 78) | High malnutrition risk (< 82, n = 23) | ||||||||
| aP values < 0.05 vs. normal malnutrition or no risk of malnutrition. bP values < 0.05 vs. mild malnutrition or low malnutrition risk. cP values < 0.05 vs. moderate malnutrition or medium malnutrition risk. CONUT: Controlling Nutritional Status; GNRI: Geriatric Nutritional Risk Index. | |||||||||||
| All-cause death (%) | 11 (19.3) | 9 (23.7) | 41 (52.6)a, b | 22 (95.7)a, b, c | < 0.001 | ||||||
| Cardiovascular death (%) | 2 (3.5) | 4 (10.5) | 12 (15.4) | 3 (13.0) | 0.136 | ||||||
| All-cause readmission (%) | 43 (75.4) | 29 (76.3) | 71 (91.0)a | 21 (91.3) | 0.038 | ||||||
| HF-related readmission (%) | 15 (26.3) | 12 (31.6) | 46 (59.0)a, b | 17 (73.9)a, b | < 0.001 | ||||||
| P value | HR (95% CI) | |
|---|---|---|
| CI: confidence interval; CONUT: Controlling Nutritional Status; GNRI: Geriatric Nutritional Risk Index; HR: hazard ratio; NT-proBNP: N-terminal pro-B-type natriuretic peptide. | ||
| Age | 0.318 | 1.208 (0.974–1.085) |
| Hypertension | 0.130 | 0.671 (0.400–1.125) |
| Diabetes | 0.124 | 1.444 (0.904–2.307) |
| Chronic renal insufficiency | 0.283 | 1.288 (0.812–2.042) |
| GNRI score | 0.043 | 0.962 (0.927–0.999) |
| CONUT score | 0.001 | 1.366 (1.181–1.579) |
| NT-proBNP | 0.017 | 1.000 (1.000–1.001) |