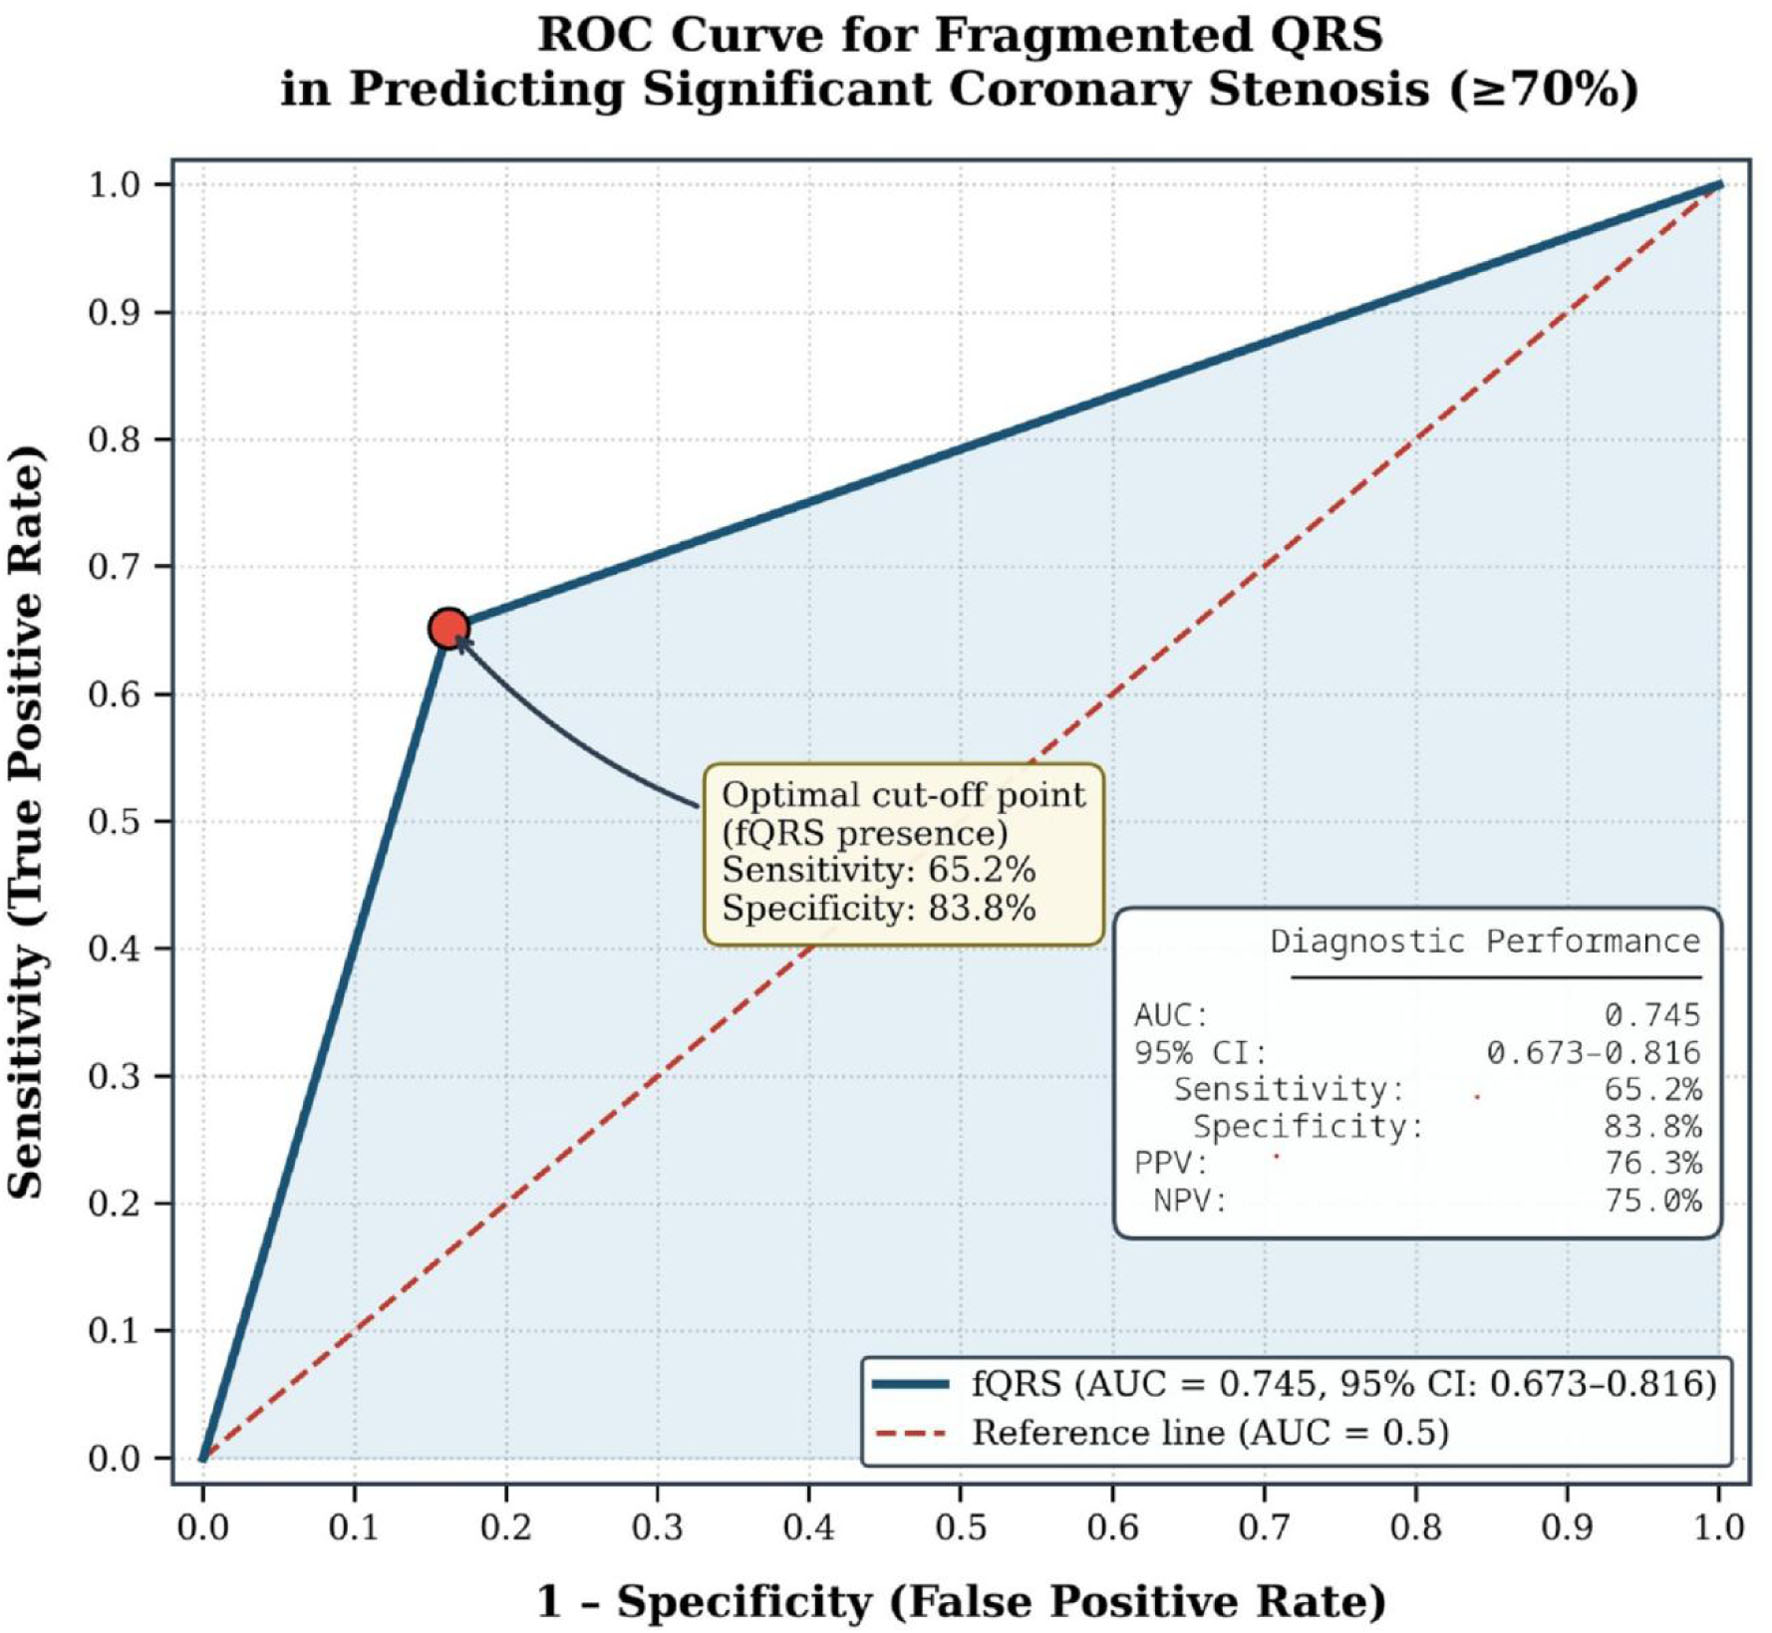
↓ Figure 1. Receiver operating characteristic (ROC) curve analysis of fragmented QRS (fQRS) for predicting anatomically significant coronary stenosis (≥ 70%) on invasive coronary angiography.
| Cardiology Research, ISSN 1923-2829 print, 1923-2837 online, Open Access |
| Article copyright, the authors; Journal compilation copyright, Cardiol Res and Elmer Press Inc |
| Journal website https://cr.elmerpub.com |
Original Article
Volume 17, Number 5, October 2026, pages 519-525
Fragmented QRS on Baseline Electrocardiography Predicts Anatomically Significant Stenosis in Patients With Intermediate Coronary Lesions on Coronary Computed Tomography Angiography
Figure
Tables
| Variables | Group 2 (< 70% stenosis, n = 111) | Group 1 (≥ 70% stenosis, n = 89) | P |
|---|---|---|---|
| Data are presented as mean ± standard deviation or n (%). *P-values indicate statistical significance (P < 0.05). BMI: body mass index; COPD: chronic obstructive pulmonary disease; CT: computed tomography; HbA1c: glycated hemoglobin; LDL: low-density lipoprotein; T4: thyroxine; TSH: thyroid-stimulating hormone. | |||
| Age (years) | 58.6 ± 7.9 | 56.8 ± 11.3 | 0.392 |
| Gender, male (n, %) | 41 (36.9) | 60 (67.4) | < 0.001* |
| Weight (kg) | 80.1 ± 6.9 | 86.5 ± 6.2 | < 0.001* |
| Height (cm) | 167.5 ± 6.5 | 170.2 ± 5.9 | 0.006* |
| BMI (kg/m2) | 28.7 ± 3.2 | 29.9 ± 2.4 | 0.002* |
| Fragmented QRS presence (n, %) | 18 (16.2) | 58 (65.2) | < 0.001* |
| Hypertension (n, %) | 67 (60.4) | 56 (62.9) | 0.711 |
| Diabetes mellitus (n, %) | 25 (22.5) | 32 (36.0) | 0.036* |
| COPD (n, %) | 18 (16.2) | 13 (14.6) | 0.755 |
| Family history (n, %) | 56 (50.5) | 43 (48.3) | 0.764 |
| Coronary CT bridge presence (n, %) | 22 (19.8) | 14 (15.7) | 0.454 |
| Hyperlipidemia (n, %) | 38 (34.2) | 48 (53.9) | 0.005* |
| Smoking (n, %) | 36 (32.4) | 54 (60.7) | < 0.001* |
| Glucose (mg/dL) | 130.5 ± 57.7 | 139.3 ± 63.4 | 0.111 |
| Urea (mg/dL) | 28.1 ± 11.2 | 27.3 ± 11.0 | 0.978 |
| Creatinine (mg/dL) | 0.82 ± 0.19 | 0.82 ± 0.19 | 0.840 |
| HbA1c (%) | 6.62 ± 1.48 | 6.69 ± 1.58 | 0.861 |
| TSH (mIU/L) | 2.54 ± 1.47 | 2.55 ± 1.52 | 0.879 |
| T4 (ng/dL) | 14.4 ± 2.3 | 14.6 ± 2.5 | 0.436 |
| Triglyceride (mg/dL) | 187.4 ± 122.0 | 153.8 ± 67.0 | 0.088 |
| LDL (mg/dL) | 112.6 ± 27.4 | 110.0 ± 22.3 | 0.700 |
| Hemoglobin (g/dL) | 15.5 ± 2.2 | 15.1 ± 2.1 | 0.504 |
| Platelet (× 103/µL) | 287.4 ± 73.7 | 266.1 ± 72.5 | 0.043* |
| Acetylsalicylic acid (n, %) | 32 (29) | 25 (28) | 0.206 |
| Beta blocker (n, %) | 24 (22) | 23 (25) | 0.394 |
| Statins (n, %) | 29 (26) | 24 (27) | 0.276 |
| Variable | Univariate model | Multivariate model | ||||
|---|---|---|---|---|---|---|
| OR | 95% CI | P | OR | 95% CI | P | |
| *P-values indicate statistical significance (P < 0.05). BMI: body mass index; LDL: low-density lipoprotein; OR: odds ratio; 95% CI: confidence interval. | ||||||
| Male gender | 3.512 | 1.980–6.230 | < 0.001* | 4.167 | 1.798–9.655 | 0.001* |
| BMI (kg/m2) | 1.071 | 0.977–1.175 | 0.147 | 0.918 | 0.811–1.039 | 0.177 |
| Hypertension | 1.304 | 0.773–2.199 | 0.320 | 1.151 | 0.586–2.258 | 0.684 |
| Diabetes mellitus | 1.928 | 1.041–3.570 | 0.036 | 1.087 | 0.471–2.506 | 0.846 |
| Smoking | 3.047 | 1.789–5.191 | < 0.001* | 1.429 | 0.614–3.323 | 0.408 |
| Hyperlipidemia | 2.539 | 1.481–4.352 | 0.001* | 2.342 | 1.106–4.959 | 0.026* |
| Family history | 1.296 | 0.776–2.165 | 0.321 | 0.672 | 0.360–1.256 | 0.214 |
| Fragmented QRS presence | 4.998 | 2.677–9.331 | < 0.001* | 5.814 | 2.478–13.645 | < 0.001* |
| Triglyceride | 0.997 | 0.994–1.001 | 0.305 | 0.998 | 0.995–1.001 | 0.221 |
| LDL | 1.006 | 0.996–1.016 | 0.267 | 0.990 | 0.977–1.003 | 0.149 |
| < 70% Stenosis (n = 111) | ≥ 70% Stenosis (n = 89) | Total | |
|---|---|---|---|
| fQRS (−) | 93 | 31 | 124 |
| fQRS (+) | 18 | 58 | 76 |
| Total | 111 | 89 | 200 |
| Measure | Value | ||
| AUC (95% CI) | 0.745 (0.673–0.816) | ||
| P-value | < 0.001 | ||
| Sensitivity | 65.2% | ||
| Specificity | 83.8% | ||
| Positive predictive value | 76.3% | ||
| Negative predictive value | 75.0% |