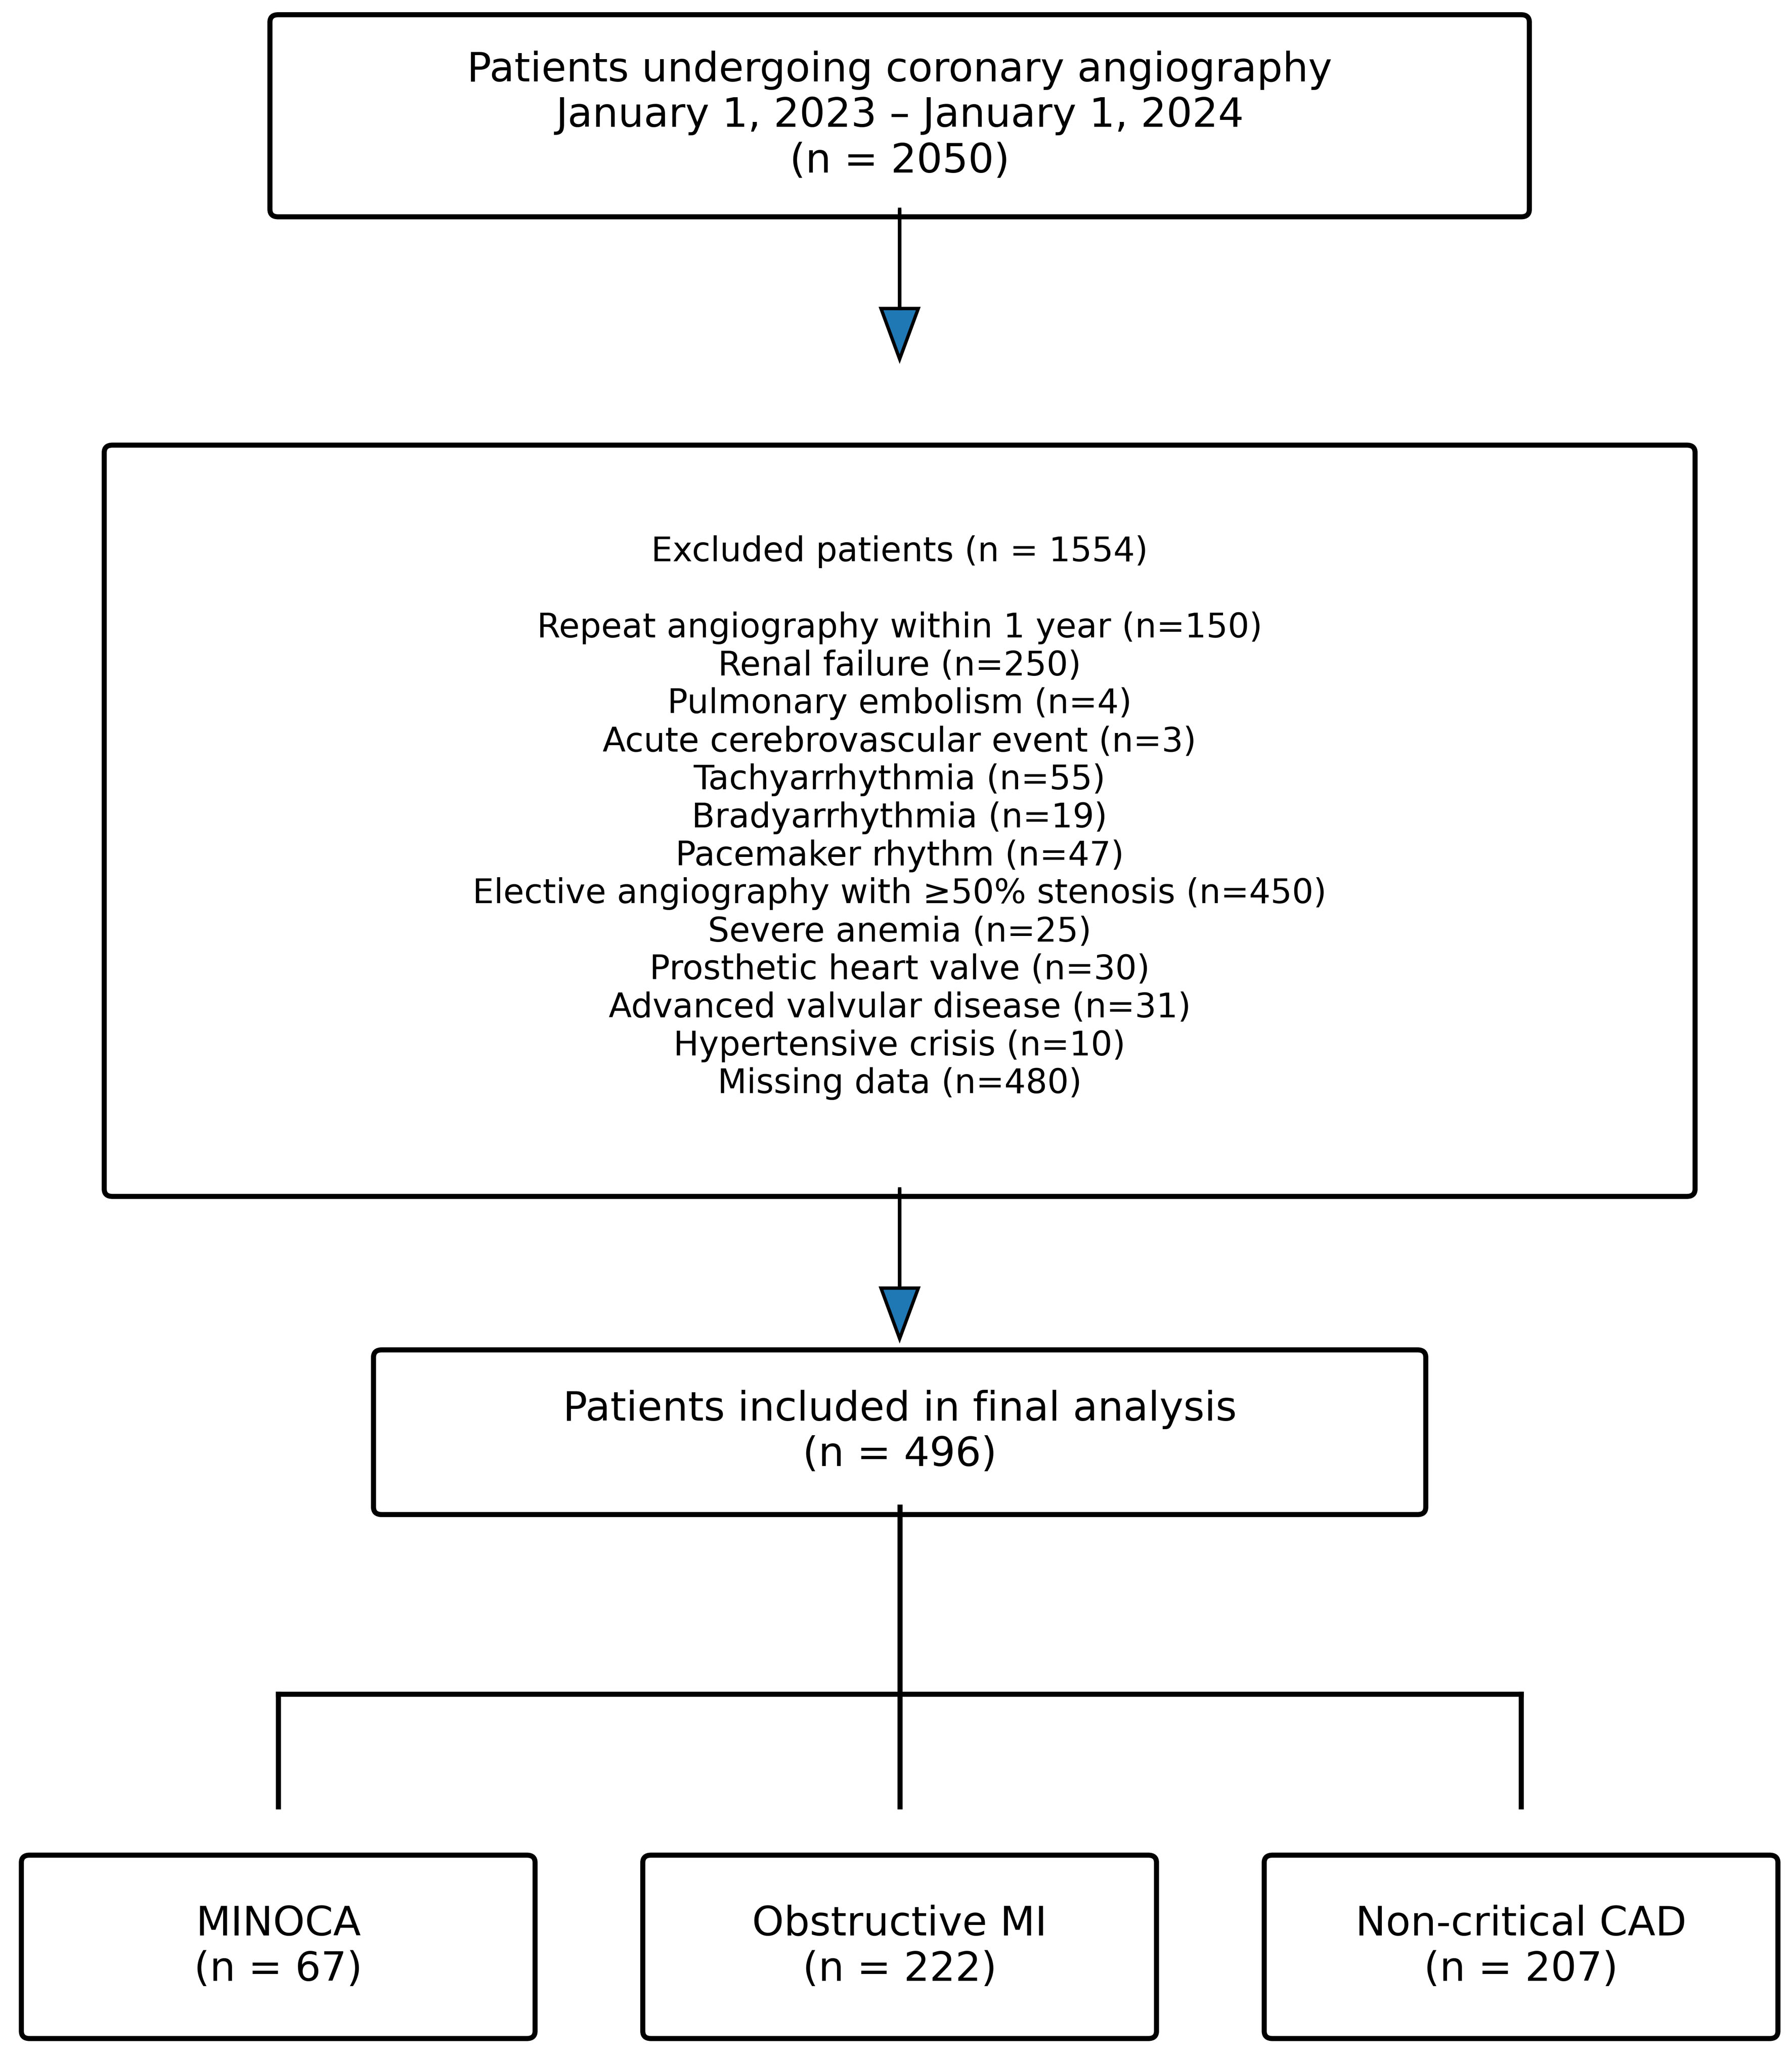
↓ Figure 1. Flow diagram of patient selection and study group allocation. MINOCA: myocardial infarction with non-obstructive coronary arteries; MI: myocardial infarction; CAD: coronary artery disease.
| Cardiology Research, ISSN 1923-2829 print, 1923-2837 online, Open Access |
| Article copyright, the authors; Journal compilation copyright, Cardiol Res and Elmer Press Inc |
| Journal website https://cr.elmerpub.com |
Original Article
Volume 17, Number 5, October 2026, pages 534-544
Diagnostic Value of Systemic Inflammatory Indices in Myocardial İnfarction With Non-Obstructive Coronary Arteries: Comparison With Obstructive Myocardial Infarction and Non-Critical Coronary Artery Disease
Figures
Tables
| Variable | MINOCA (n = 67) | Obstructive MI (n = 222) | Non-critical CAD (n = 207) | P value |
|---|---|---|---|---|
| Values are expressed as mean ± standard deviation or number (percentage). CAD: coronary artery disease; MI: myocardial infarction; MINOCA: myocardial infarction with non-obstructive coronary arteries. | ||||
| Age (years) | 56.75 ± 16.09 | 66.32 ± 10.93 | 58.76 ± 10.39 | < 0.001 |
| Male sex, n (%) | 37 (55.2) | 157 (70.7) | 111 (53.6) | < 0.001 |
| Diabetes mellitus, n (%) | 18 (26.9) | 107 (48.2) | 64 (30.9) | < 0.001 |
| Hypertension, n (%) | 21 (31.3) | 107 (48.2) | 61 (29.5) | < 0.001 |
| Smoking, n (%) | 27 (40.3) | 79 (35.6) | 75 (36.2) | 0.631 |
| Variable | MINOCA (n = 67) | Obstructive MI (n = 222) | Non-critical CAD (n = 207) | P value |
|---|---|---|---|---|
| Values are expressed as mean ± standard deviation. LVEF: left ventricular ejection fraction; SPAP: systolic pulmonary artery pressure; CAD: coronary artery disease; MI: myocardial infarction; MINOCA: myocardial infarction with non-obstructive coronary arteries. | ||||
| LVEF (%) | 53.81 ± 8.71 | 48.69 ± 9.06 | 58.77 ± 5.17 | < 0.001 |
| SPAP (mm Hg) | 31.27 ± 8.81 | 31.89 ± 6.75 | 28.55 ± 6.30 | < 0.001 |
| Variable | MINOCA (n = 67) | Obstructive MI (n = 222) | Non-critical CAD (n = 207) | P value |
|---|---|---|---|---|
| Values are expressed as mean ± standard deviation. WBC: white blood cell count; LDL: low-density lipoprotein; SII: systemic immune-inflammation index; NLR: neutrophil-to-lymphocyte ratio; PLR: platelet-to-lymphocyte ratio; MLR: monocyte-to-lymphocyte ratio; CRP: C-reactive protein; CAR: CRP-to-albumin ratio; CAD: coronary artery disease; MI: myocardial infarction; MINOCA: myocardial infarction with non-obstructive coronary arteries; proBNP: pro–B-type natriuretic peptide. | ||||
| Neutrophil | 5.7 ± 2.14 | 6.65 ± 2.46 | 4.57 ± 1.48 | < 0.001 |
| Lymphocyte | 2.26 ± 0.92 | 2.08 ± 0.91 | 2.33 ± 0.77 | 0.009 |
| Platelet | 242.27 ± 71.13 | 231.92 ± 65.12 | 238.05 ± 60.63 | 0.418 |
| Monocyte | 0.69 ± 0.25 | 0.72 ± 0.27 | 0.64 ± 0.20 | 0.005 |
| Hemoglobin | 13.14 ± 1.72 | 12.99 ± 1.97 | 13.39 ± 1.79 | 0.080 |
| WBC | 8.88 ± 2.45 | 9.61 ± 2.65 | 7.80 ± 1.96 | < 0.001 |
| Creatinine | 0.91 ± 0.23 | 1.07 ± 0.32 | 0.88 ± 0.20 | < 0.001 |
| Glucose | 116.53 ± 42.53 | 156.61 ± 73.10 | 115.86 ± 39.30 | < 0.001 |
| Albumin | 4.01 ± 0.35 | 3.97 ± 0.41 | 4.30 ± 0.37 | < 0.001 |
| LDL | 111.91 ± 35.31 | 123.99 ± 38.08 | 113.46 ± 35.58 | 0.004 |
| SII | 756.12 ± 660.39 | 931.90 ± 739.43 | 505.64 ± 245.85 | < 0.001 |
| NLR | 3.17 ± 2.54 | 4.01 ± 2.87 | 2.17 ± 1.06 | < 0.001 |
| PLR | 125.89 ± 67.75 | 133.00 ± 69.80 | 111.69 ± 41.20 | 0.001 |
| MLR | 0.35 ± 0.24 | 0.39 ± 0.22 | 0.30 ± 0.11 | < 0.001 |
| CRP | 10.11 ± 15.17 | 17.54 ± 26.98 | 5.25 ± 8.24 | < 0.001 |
| CAR | 2.52 ± 3.74 | 4.70 ± 7.66 | 1.26 ± 2.00 | < 0.001 |
| ProBNP | 1,201.55 ± 1,904.01 | 2,940.03 ± 4,953.32 | 164.78 ± 268.23 | < 0.001 |
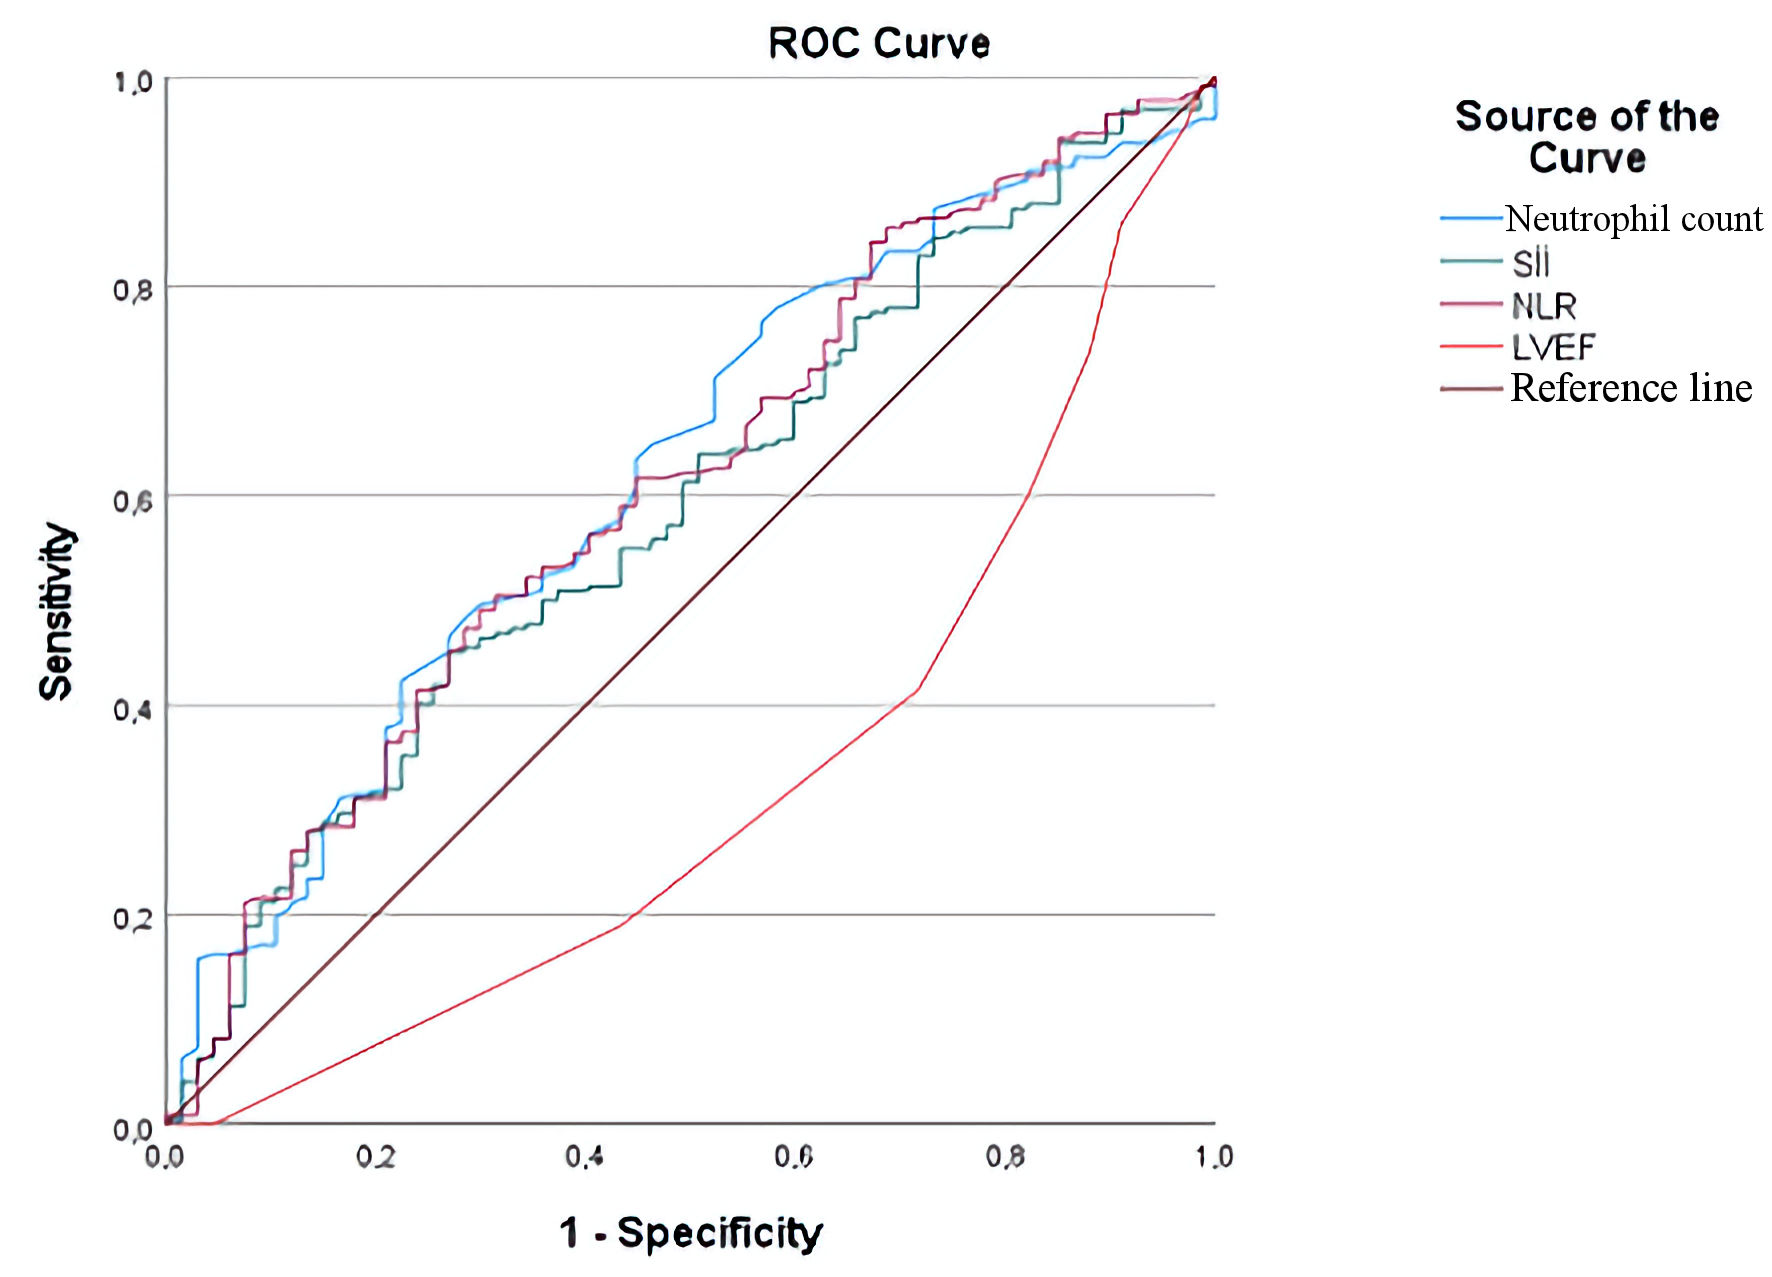
| Variable | Cut-off | AUC | Sensitivity | Specificity | PPV | NPV | P value |
|---|---|---|---|---|---|---|---|
| AUC: area under the curve; PPV: positive predictive value; NPV: negative predictive value; SII: systemic immune-inflammation index; NLR: neutrophil-to-lymphocyte ratio; LVEF: left ventricular ejection fraction; ROC: receiver operating characteristic; MINOCA: myocardial infarction with non-obstructive coronary arteries. | |||||||
| Neutrophil | ≥ 6.7 | 0.622 | 0.423 | 0.776 | 0.862 | 0.289 | 0.002 |
| SII | ≥ 796.44 | 0.589 | 0.451 | 0.731 | 0.848 | 0.287 | 0.022 |
| NLR | ≥ 3.23 | 0.611 | 0.491 | 0.702 | 0.845 | 0.294 | 0.004 |
| LVEF | ≤ 50 | 0.678 | 0.586 | 0.716 | 0.873 | 0.343 | < 0.001 |
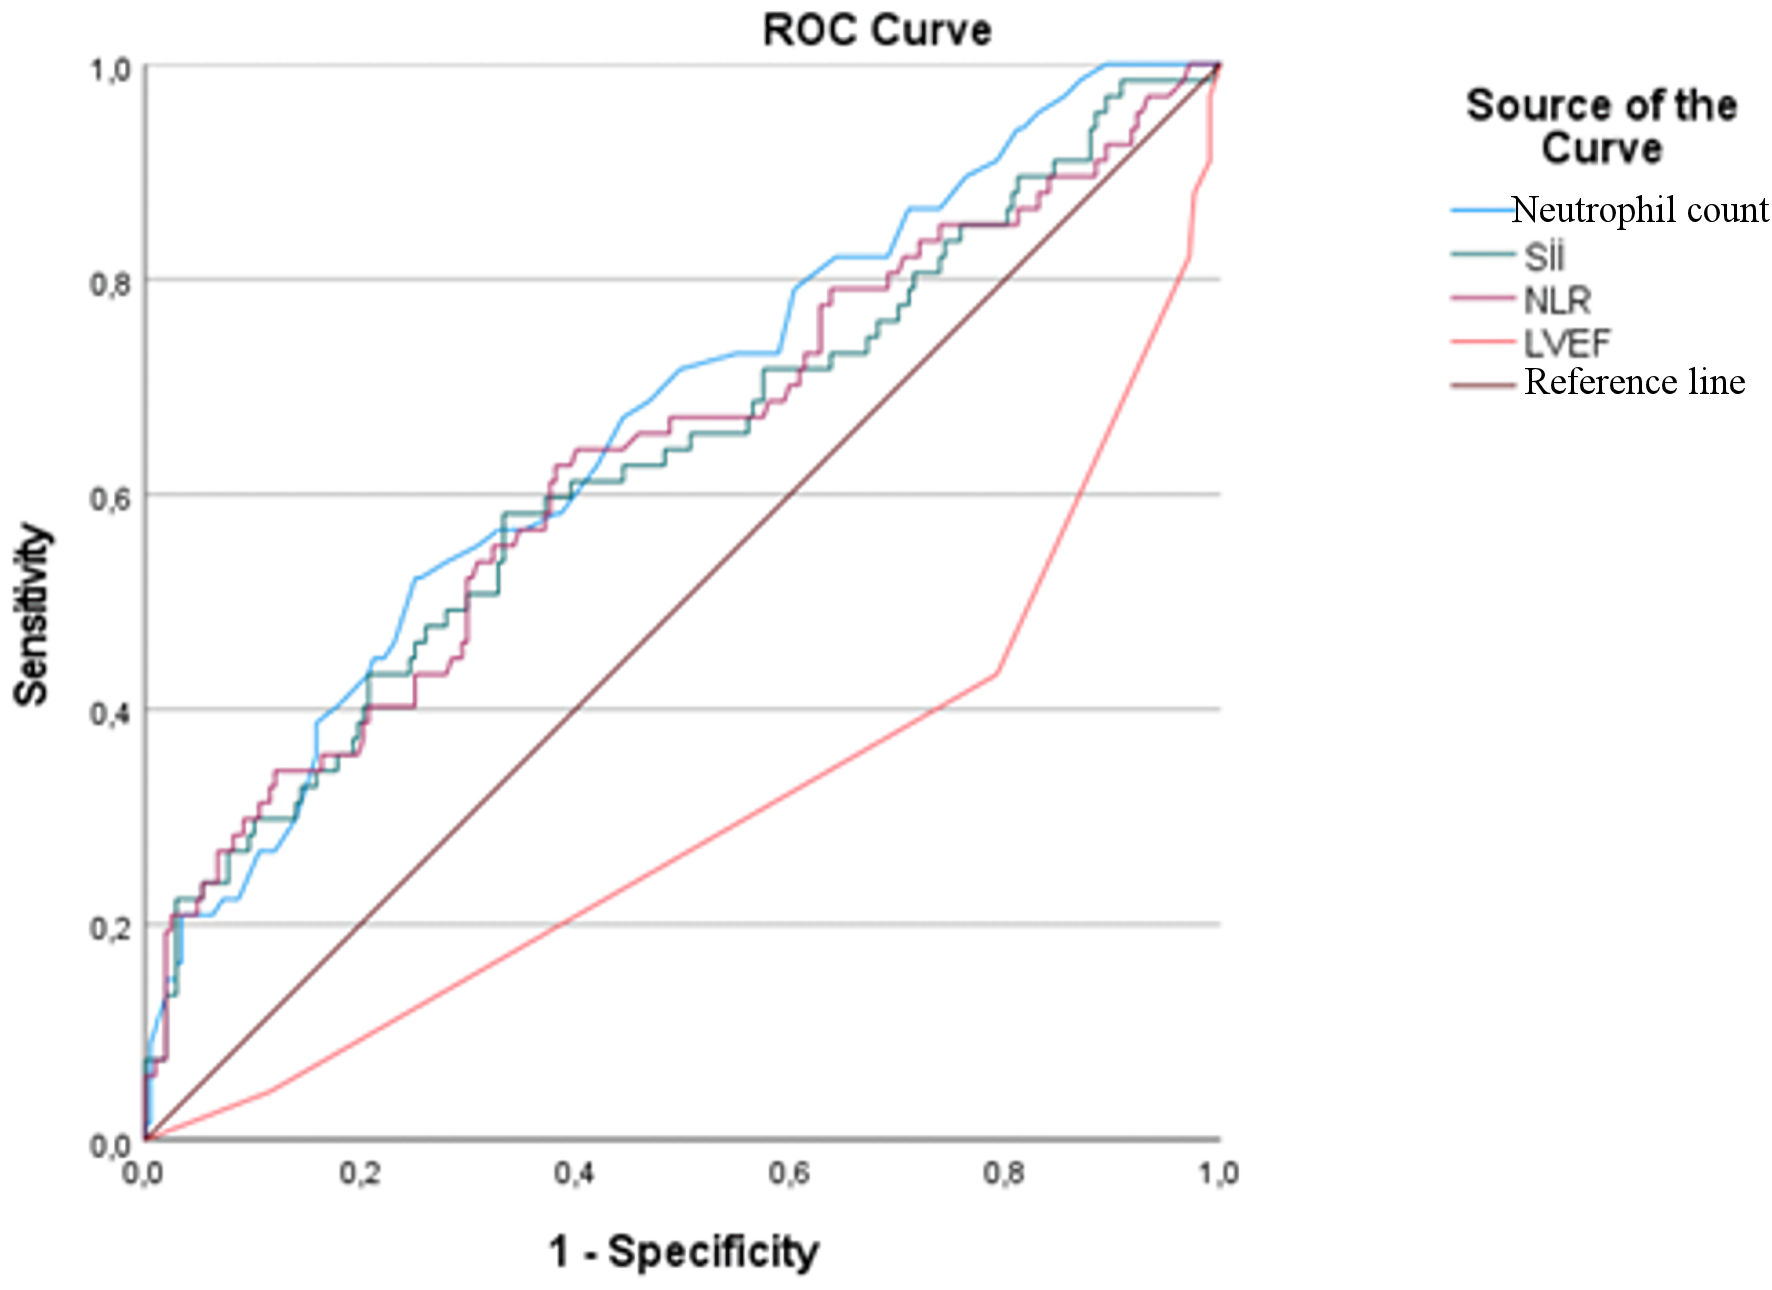
| Variable | Cut-off | AUC | Sensitivity | Specificity | PPV | NPV | P value |
|---|---|---|---|---|---|---|---|
| AUC: area under the curve; PPV: positive predictive value; NPV: negative predictive value; SII: systemic immune-inflammation index; NLR: neutrophil-to-lymphocyte ratio; LVEF: left ventricular ejection fraction; ROC: receiver operating characteristic; MINOCA: myocardial infarction with non-obstructive coronary arteries. | |||||||
| Neutrophil | ≥ 5.4 | 0.665 | 0.522 | 0.749 | 0.402 | 0.829 | < 0.001 |
| SII | ≥ 534.29 | 0.630 | 0.582 | 0.667 | 0.361 | 0.831 | 0.002 |
| NLR | ≥ 2.19 | 0.634 | 0.627 | 0.618 | 0.347 | 0.837 | 0.001 |
| LVEF | ≤ 55 | 0.697 | 0.567 | 0.792 | 0.469 | 0.850 | < 0.001 |