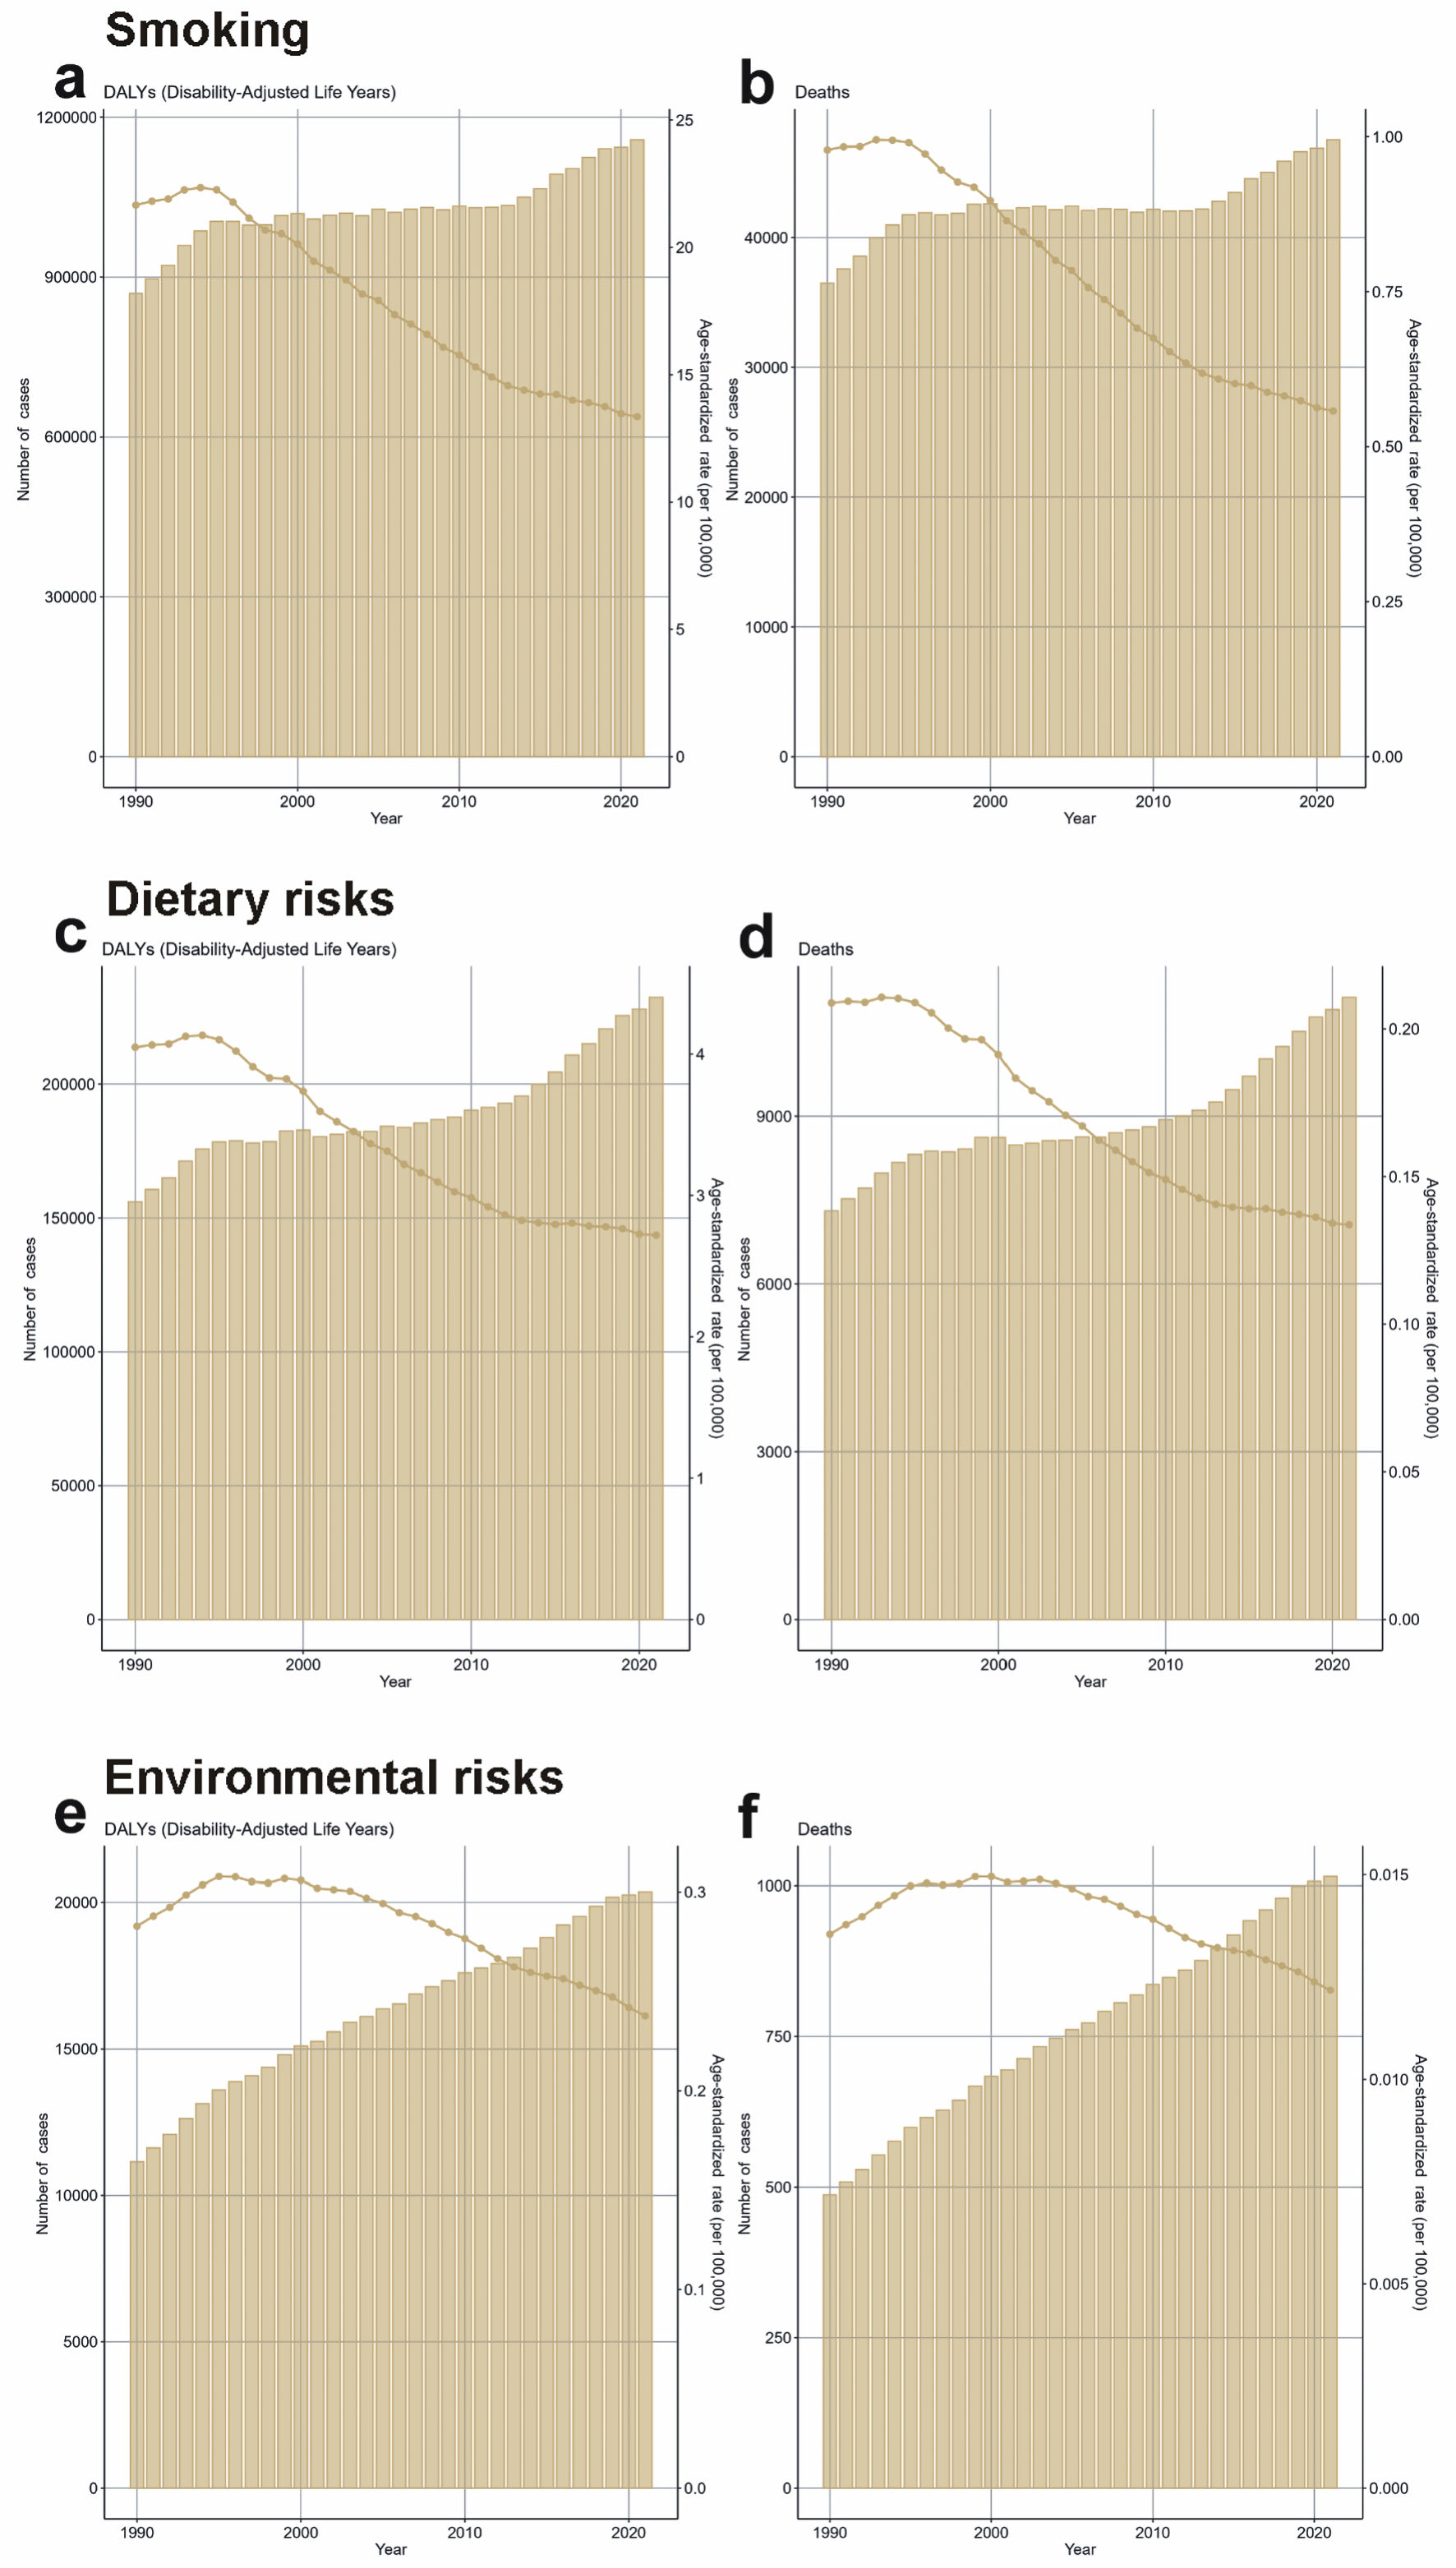
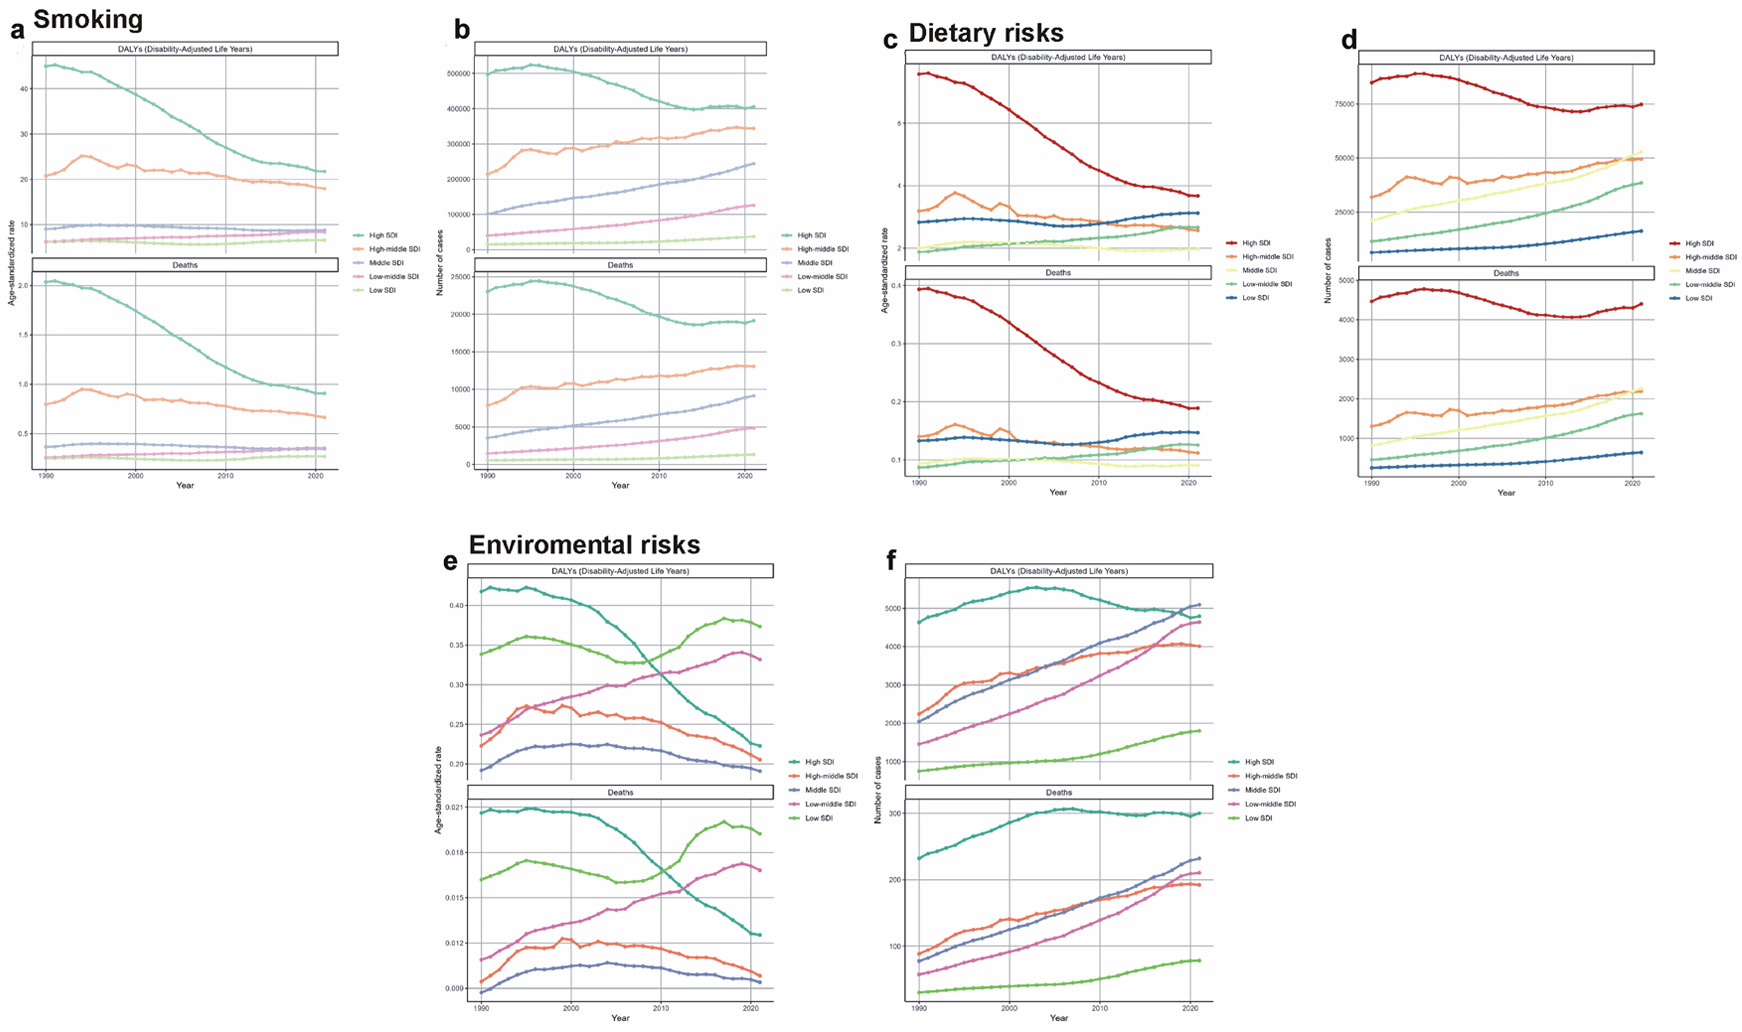
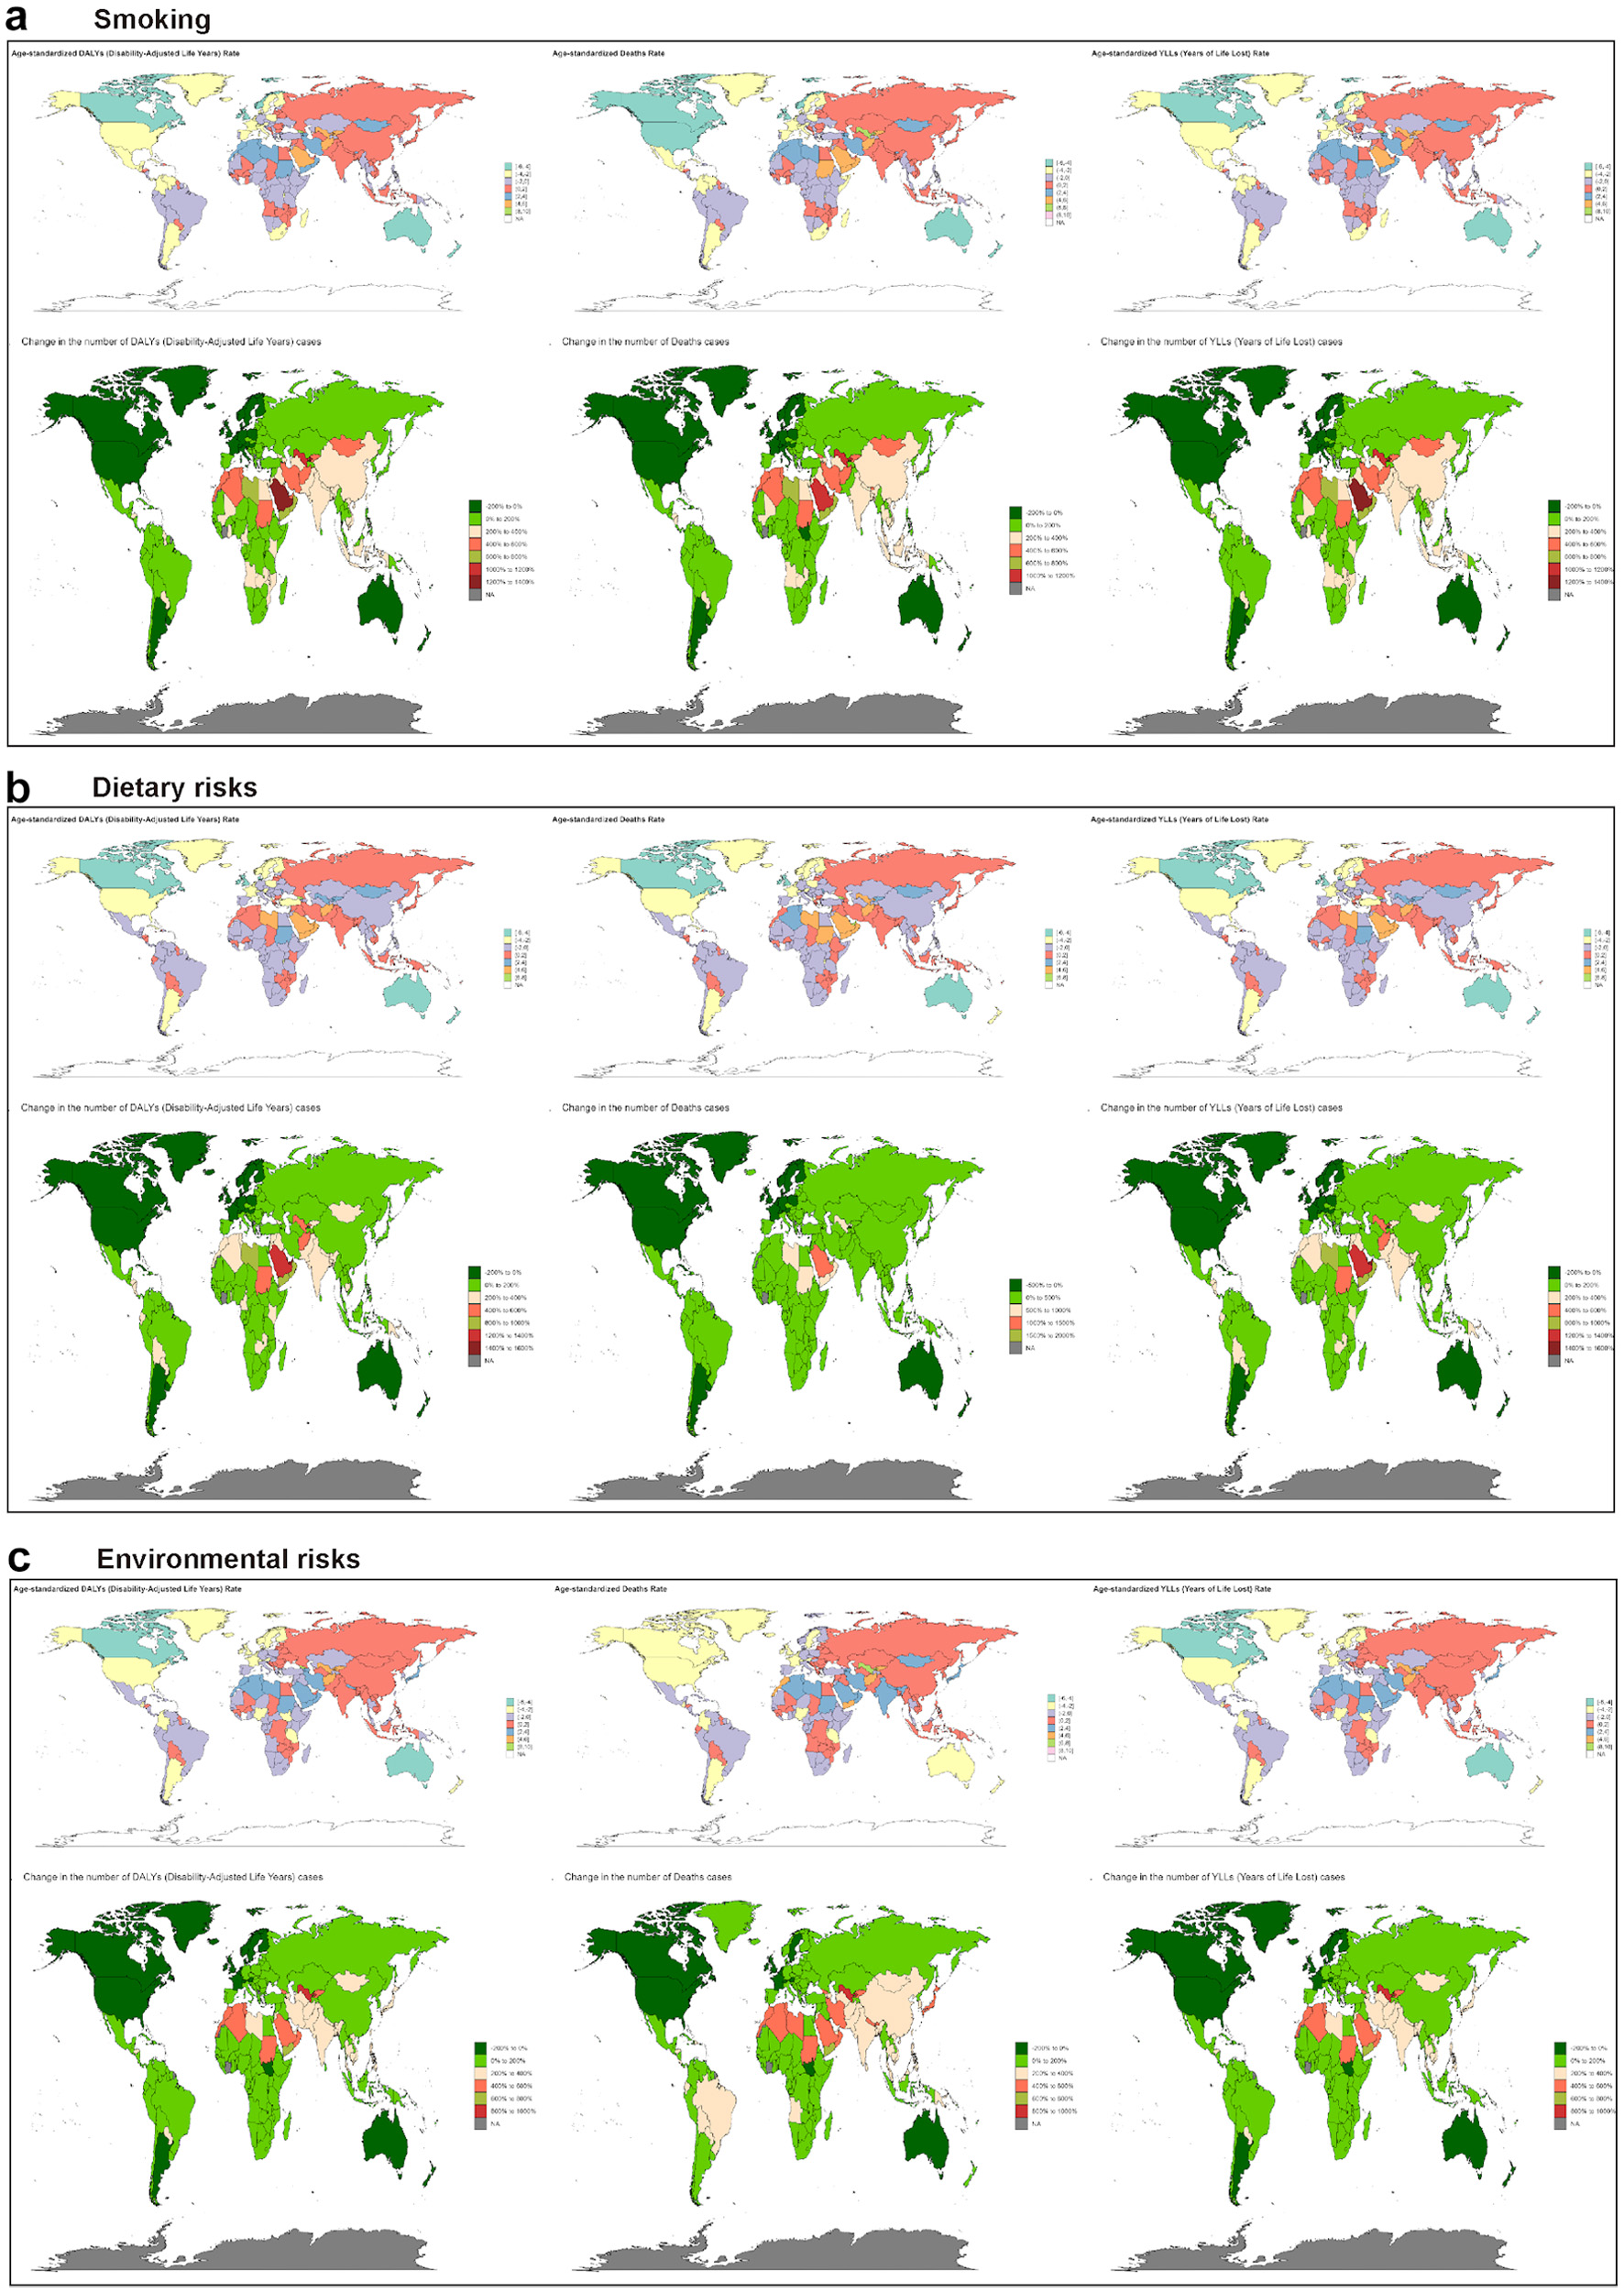
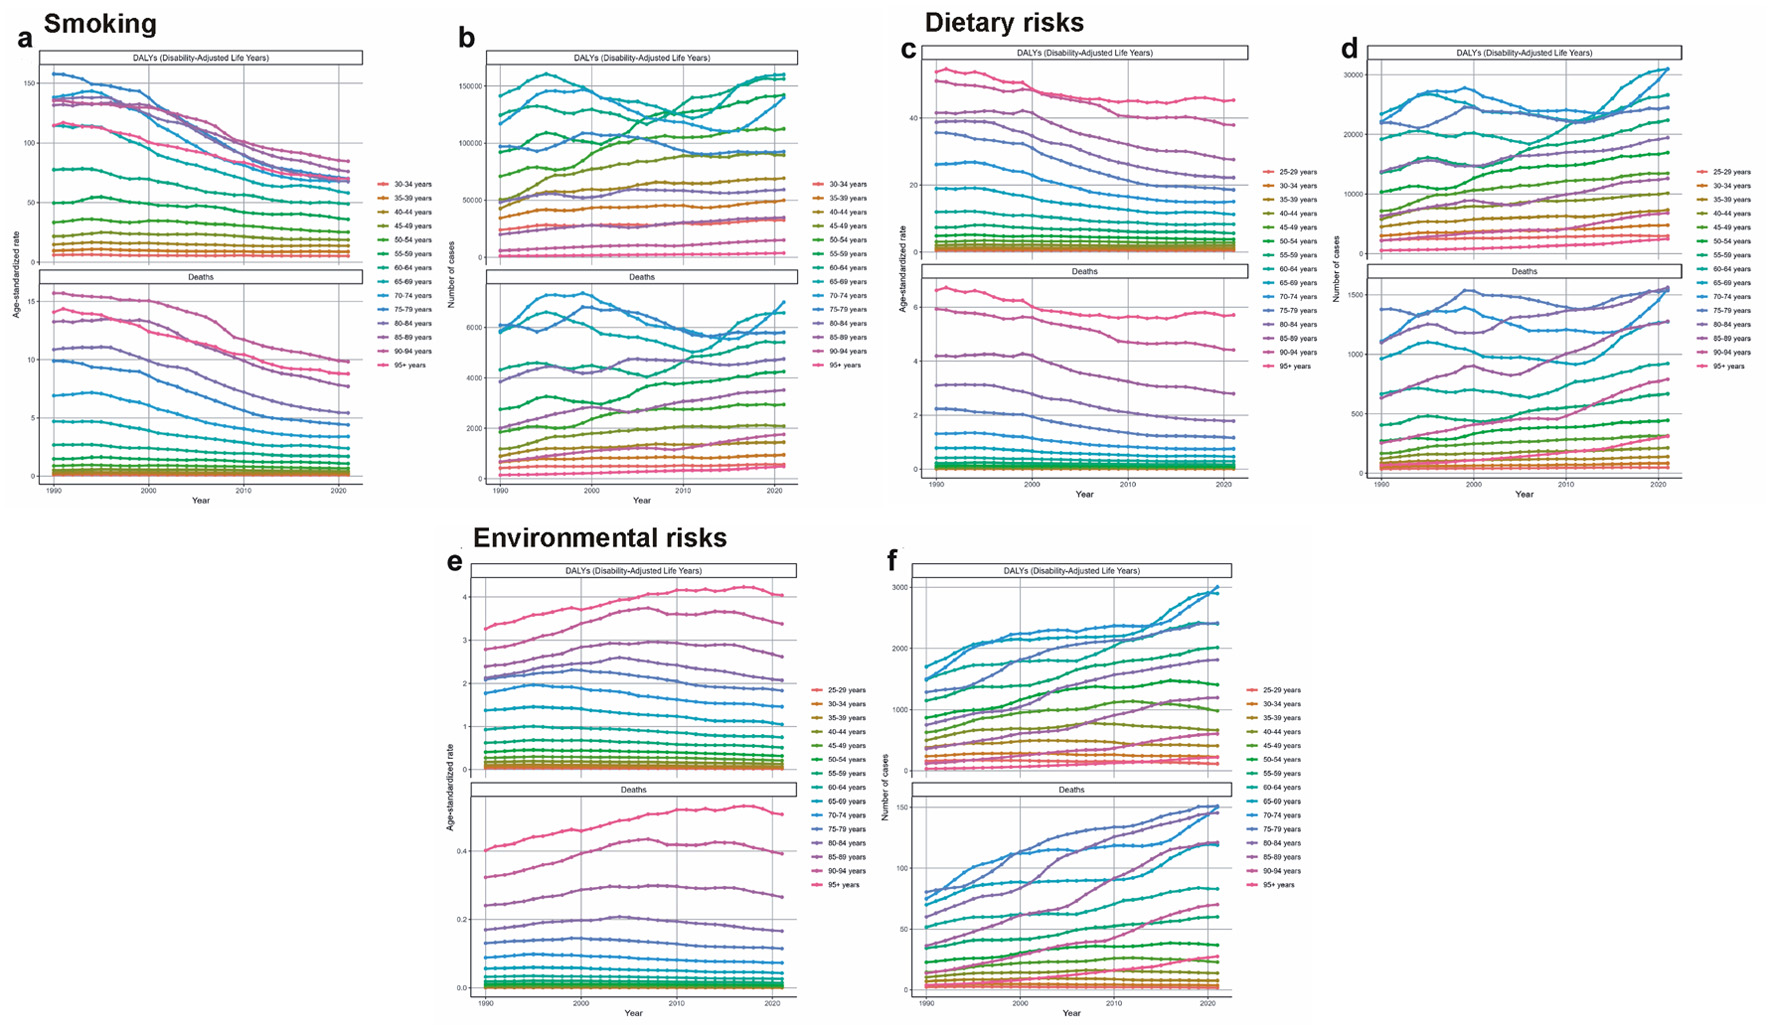
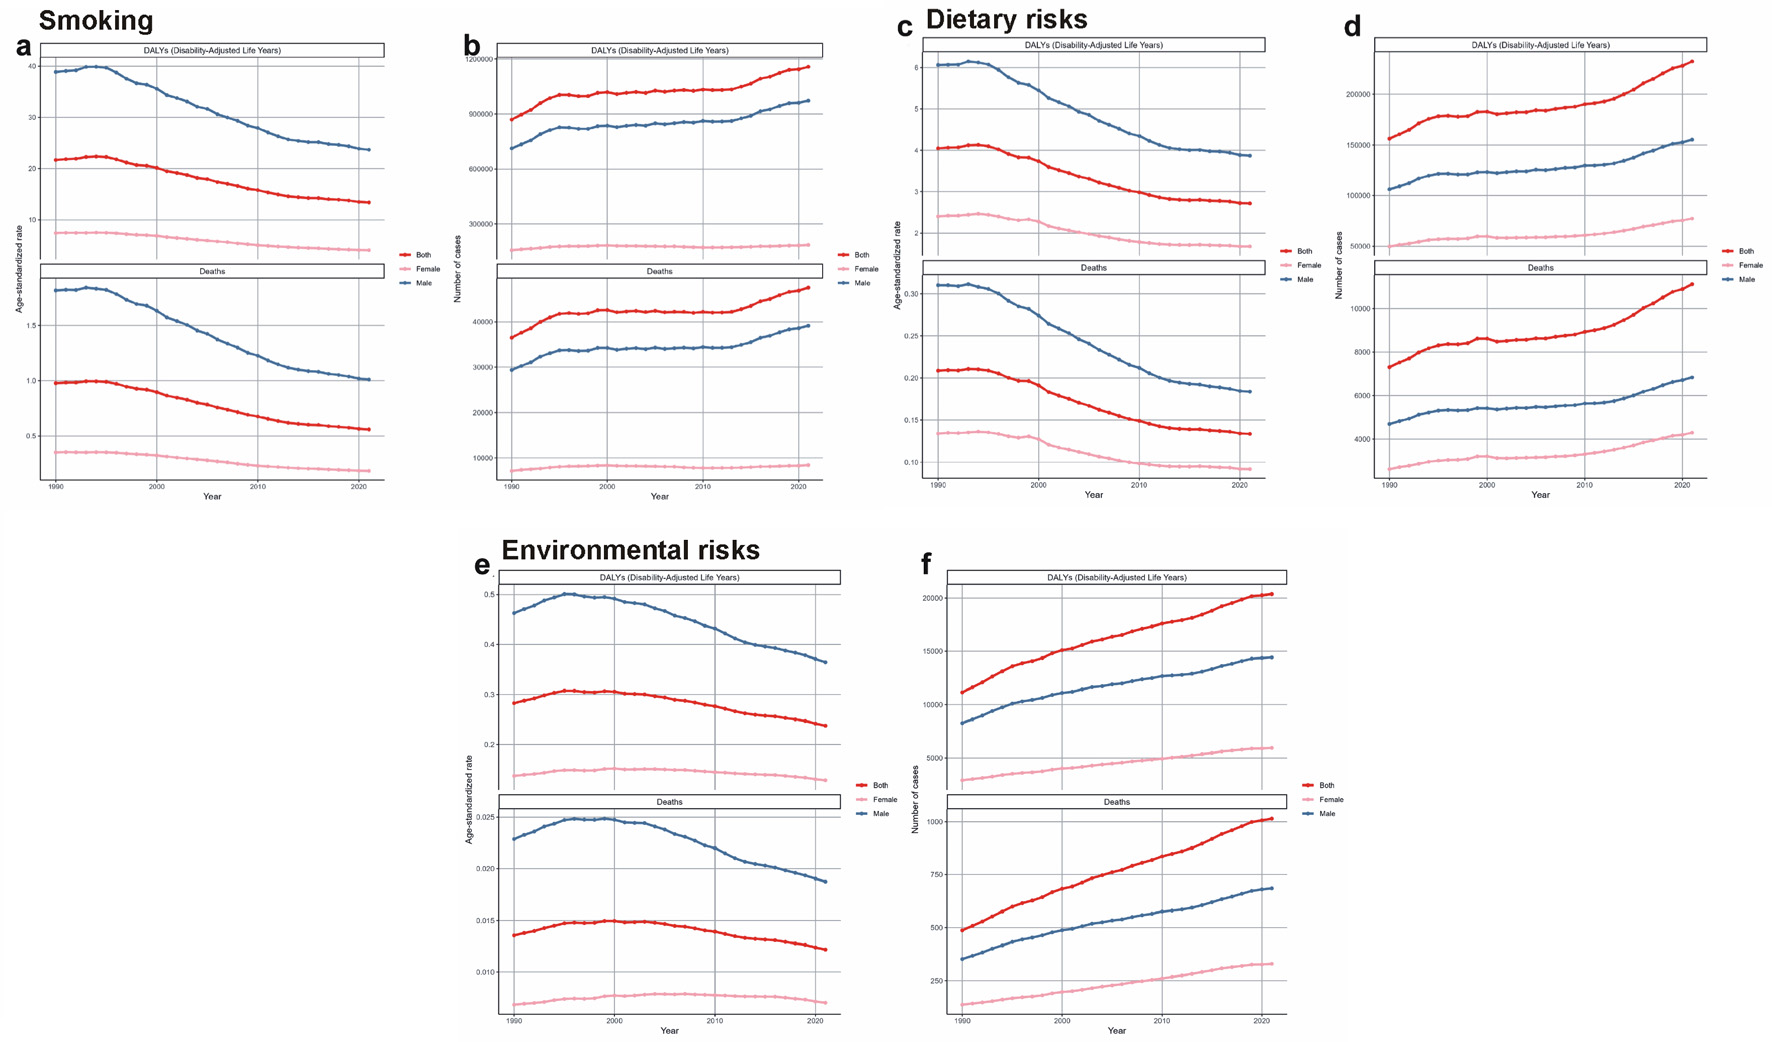
↓ Figure 1. DALY and mortality patterns of aortic aneurysm attributable to smoking (a, b), dietary risks (c, d), and environmental risks (e, f) from 1990 to 2021. DALY: disability-adjusted life year.
| Cardiology Research, ISSN 1923-2829 print, 1923-2837 online, Open Access |
| Article copyright, the authors; Journal compilation copyright, Cardiol Res and Elmer Press Inc |
| Journal website https://cr.elmerpub.com |
Original Article
Volume 000, Number 000, November 2026, pages 000-000
Global Burden, Temporal Trends, Inequalities, and Future Projections of Aortic Aneurysm Attributable to Smoking, Dietary, and Environmental Risks: Findings From the Global Burden of Disease Study 2021
Figures
Table
| Smoking-attributed aortic aneurysm | Dietary risks-attributed aortic aneurysm | Environmental risks-attributed aortic aneurysm | |||||||
|---|---|---|---|---|---|---|---|---|---|
| Death cases (95% UI) in 2021 | ASMR per 100 000 (95% UI) in 2021 | EAPC (95% CI) from 1990 to 2021 | Death cases (95% UI) in 2021 | ASMR per 100 000 (95% UI) in 2021 | EAPC (95% CI) from 1990 to 2021 | Death cases (95% UI) in 2021 | ASMR per 100 000 (95% UI) in 2021 | EAPC (95% CI) from 1990 to 2021 | |
| AA: aortic aneurysm; ASMR: age-standardized mortality rate; CI: confidence interval; EAPC: estimated annual percentage change; SDI: socio-demographic index; UI: uncertainty interval. | |||||||||
| Global | 47,537.63 (39,480.31–56,007.55) | 0.56 (0.46–0.66) | −2.17 (−2.3 to −2.05) | 11,126.88 (8,042.91–14,581.96) | 0.13 (0.1–0.18) | −1.76 (−1.88 to −1.64) | 1,014.76 (−132.77 to 2,696.21) | 0.01 (0–0.03) | −0.48 (−0.64 to −0.32) |
| Sex | |||||||||
| Male | 39,112.92 (33,109.64–45,293.74) | 1.01 (0.84–1.18) | −2.26 (−2.38 to −2.14) | 6,834.13 (4,975.88–9,023.91) | 0.18 (0.13–0.24) | −2.01 (−2.12 to −1.9) | 685.68 (−85.85 to 1,744.21) | 0.02 (0–0.05) | −0.86 (−1.03 to −0.69) |
| Female | 8,424.71 (6,528.55–10,745.98) | 0.18 (0.14–0.23) | −2.49 (−2.64 to −2.33) | 4,292.75 (3,034.95–5,703.6) | 0.09 (0.07–0.12) | −1.55 (−1.68 to −1.41) | 329.07 (−47.3 to 858.96) | 0.01 (0–0.02) | 0.13 (−0.02 to 0.28) |
| SDI level | |||||||||
| High SDI | 19,147.76 (15,516.52–23,321.48) | 0.91 (0.75–1.09) | −3.04 (−3.2 to −2.88) | 4,398.26 (3,106.2–5,805.52) | 0.19 (0.13–0.25) | −2.77 (−2.9 to −2.63) | 300.11 (−38.39 to 787.66) | 0.01 (0–0.03) | −1.76 (−1.99 to −1.52) |
| High-middle SDI | 13,062.28 (11,070.55–14,997.9) | 0.67 (0.56–0.76) | −0.92 (−1.1 to −0.75) | 2,192.2 (1,577.69–2,894.62) | 0.11 (0.08–0.15) | −1.04 (−1.2 to −0.88) | 192.32 (−24.75 to 494.57) | 0.01 (0–0.03) | −0.12 (−0.38 to 0.14) |
| Middle SDI | 9,137.72 (7,604.73–10,699.1) | 0.35 (0.29–0.41) | −0.47 (−0.59 to −0.36) | 2,258.15 (1,627.91–2,970.82) | 0.09 (0.07–0.12) | −0.42 (−0.55 to −0.3) | 232.08 (−31.17 to 596.44) | 0.01 (0–0.02) | 0.03 (−0.16 to 0.22) |
| Low-middle SDI | 4,826.05 (3,682.32–7,248.1) | 0.35 (0.26–0.53) | 0.99 (0.94 to 1.03) | 1,623.75 (1,102.42–2,333.48) | 0.13 (0.09–0.18) | 1.17 (1.11 to 1.23) | 210.51 (−27.75 to 564.37) | 0.02 (0–0.04) | 1.42 (1.34 to 1.5) |
| Low SDI | 1,300.58 (698.46–2,149.9) | 0.27 (0.15–0.45) | 0.14 (−0.07 to 0.35) | 641.26 (359.56–1,077.36) | 0.15 (0.08–0.24) | 0.25 (0.09 to 0.41) | 78.41 (−12.77 to 220.2) | 0.02 (0–0.05) | 0.55 (0.34 to 0.76) |
| Region | |||||||||
| Andean Latin America | 117.29 (89.07–156.32) | 0.20 (0.15–0.27) | −0.61 (−0.72 to −0.49) | 40.39 (27.59–57.88) | 0.07 (0.05–0.1) | 0.21 (0.08 to 0.34) | 5.06 (−0.6 to 13.55) | 0.01 (0–0.02) | −0.1 (−0.29 to 0.1) |
| Australasia | 347.16 (269.94–445.85) | 0.63 (0.50–0.80) | −5.14 (−5.31 to −4.98) | 100.14 (70.47–132.6) | 0.17 (0.12–0.22) | −4.78 (−4.93 to −4.62) | 12.41 (−1.64 to 32.72) | 0.02 (0–0.05) | −3.57 (−3.84 to −3.3) |
| Caribbean | 402.82 (318.22–502.26) | 0.75 (0.59–0.93) | −2.19 (−2.41 to −1.97) | 89.78 (63.13–122.56) | 0.17 (0.12–0.23) | −2.31 (−2.5 to −2.13) | 17.44 (−2.28 to 46.32) | 0.03 (0–0.09) | −1.37 (−1.61 to −1.14) |
| Central Asia | 542.49 (447.91–637.99) | 0.67 (0.56–0.79) | 2.44 (2.22 to 2.66) | 76.29 (53.69–104.09) | 0.1 (0.07–0.14) | 0.45 (0.19 to 0.71) | 6.92 (−0.92 to 17.94) | 0.01 (0–0.03) | 3.14 (2.91 to 3.38) |
| Central Europe | 2,407.48 (2,005.61–2,828.05) | 1.11 (0.93–1.30) | −1.01 (−1.23 to −0.80) | 472.56 (335.52–639.24) | 0.21 (0.15–0.28) | −1.3 (−1.52 to −1.09) | 32.43 (−4.38 to 83.96) | 0.01 (0–0.04) | −0.4 (−0.63 to −0.18) |
| Central Latin America | 732.52 (572.85–905.75) | 0.29 (0.23–0.36) | −2.43 (−2.74 to −2.12) | 277.04 (200.58–370.31) | 0.11 (0.08–0.15) | −1.32 (−1.6 to −1.04) | 29.88 (−4.29 to 77.69) | 0.01 (0–0.03) | −1.95 (−2.27 to −1.63) |
| Central Sub-Saharan Africa | 192.35 (90.59–329.27) | 0.34 (0.16–0.58) | −0.68 (−1.10 to −0.25) | 107.41 (56.13–183.81) | 0.24 (0.13–0.41) | −0.74 (−0.93 to −0.54) | 8.73 (−1.52 to 24.5) | 0.02 (0–0.06) | 0.09 (−0.16 to 0.33) |
| East Asia | 4,623.42 (3,421.34–6,002.72) | 0.22 (0.16–0.28) | 1.58 (1.40 to 1.76) | 589.4 (359.2–936.84) | 0.03 (0.02–0.05) | −0.32 (−0.42 to −0.23) | 100.17 (−12.6 to 258.4) | 0 (0–0.01) | 1.02 (0.82 to 1.23) |
| Eastern Europe | 5,126.26 (4,364.07–5,883.51) | 1.50 (1.28–1.72) | 1.15 (0.88 to 1.42) | 1075.39 (775.79–1,401.49) | 0.31 (0.22–0.4) | 0.72 (0.37 to 1.06) | 43.57 (−5.59 to 111.24) | 0.01 (0–0.03) | 1.36 (1.06 to 1.65) |
| Eastern Sub-Saharan Africa | 550.89 (242.71–940.86) | 0.33 (0.15–0.56) | −0.75 (−0.99 to −0.51) | 261.21 (131.36–443.05) | 0.18 (0.09–0.3) | −0.17 (−0.31 to −0.02) | 24.25 (−4.04 to 72.98) | 0.02 (0–0.05) | −0.97 (−1.11 to −0.83) |
| High-income Asia Pacific | 5,858.21 (4,615.48–7,252.07) | 1.24 (1.02–1.47) | 0.35 (0.21 to 0.48) | 1569.78 (1057.87–2,187.94) | 0.27 (0.19–0.37) | 0.62 (0.53 to 0.71) | 103.61 (−13.06 to 272.57) | 0.02 (0–0.04) | 2.15 (1.78 to 2.51) |
| High-income North America | 4,743.50 (3,818.34–5,782.67) | 0.76 (0.62–0.91) | −4.25 (−4.52 to −3.97) | 891.74 (640.07–1,169.59) | 0.13 (0.1–0.18) | −3.77 (−4 to −3.54) | 61.79 (−7.61 to 164.64) | 0.01 (0–0.02) | −3.77 (−4.04 to −3.5) |
| North Africa and Middle East | 1,498.90 (1,196.61–1,830.33) | 0.33 (0.26–0.40) | 0.29 (0.17 to 0.42) | 88.19 (61.9–122.38) | 0.02 (0.01–0.03) | 0.43 (0.3 to 0.56) | 32.81 (−4.21 to 84.04) | 0.01 (0–0.02) | 1.19 (1.01 to 1.38) |
| Oceania | 38.53 (27.50–52.89) | 0.48 (0.35–0.66) | −0.85 (−0.94 to −0.75) | 11.36 (7.83–15.85) | 0.18 (0.13–0.25) | −0.51 (−0.58 to −0.44) | 0.48 (−0.06 to 1.31) | 0.01 (0–0.03) | −0.51 (−0.59 to −0.43) |
| South Asia | 4,298.52 (2,808.91–7,206.70) | 0.31 (0.20–0.52) | 1.17 (1.08 to 1.26) | 1,649.23 (1,020.22–2,569.82) | 0.12 (0.08–0.19) | 1.74 (1.62 to 1.85) | 223.03 (−29.85 to 606.41) | 0.02 (0–0.05) | 1.9 (1.79 to 2.02) |
| Southeast Asia | 2,374.32 (1,902.92–2,942.29) | 0.41 (0.32–0.51) | 0.27 (0.17 to 0.36) | 682.09 (487.28–906.59) | 0.13 (0.09–0.17) | 0.25 (0.19 to 0.31) | 44.1 (−5.92 to 119.41) | 0.01 (0–0.02) | 0.71 (0.53 to 0.89) |
| Southern Latin America | 716.07 (591.82–853.76) | 0.83 (0.69–0.99) | −2.47 (−2.71 to −2.23) | 163.36 (115.51–216.96) | 0.18 (0.13–0.24) | −2.37 (−2.53 to −2.22) | 12.49 (−1.6 to 32.93) | 0.01 (0–0.04) | −2.07 (−2.35 to −1.79) |
| Southern Sub-Saharan Africa | 317.87 (256.98–381.78) | 0.55 (0.44–0.66) | −2.73 (−3.03 to −2.43) | 138.73 (99.41–183.75) | 0.27 (0.19–0.36) | −1.43 (−1.76 to −1.1) | 8.17 (−1.05 to 21.53) | 0.02 (0–0.04) | −0.96 (−1.31 to −0.61) |
| Tropical Latin America | 3,605.76 (2,995.31–4,328.88) | 1.40 (1.16–1.68) | −0.86 (−1.07 to −0.66) | 755.63 (547.19–984.68) | 0.3 (0.22–0.39) | −0.36 (−0.57 to −0.16) | 79.31 (−10.5 to 198.82) | 0.03 (0–0.08) | 0.02 (−0.3 to 0.33) |
| Western Europe | 8,544.97 (6,904.86–10,424.90) | 0.89 (0.74–1.07) | −3.39 (−3.64 to −3.14) | 1,753.37 (1,264.3–2274.09) | 0.17 (0.12–0.21) | −3.38 (−3.59 to −3.18) | 141.32 (−18.28 to 369.47) | 0.01 (0–0.03) | −1.7 (−2.1 to −1.29) |
| Western Sub-Saharan Africa | 498.30 (193.02–899.76) | 0.25 (0.10–0.45) | −0.48 (−0.63 to −0.33) | 333.77 (151.86–601.85) | 0.21 (0.09–0.37) | −0.26 (−0.39 to −0.14) | 26.8 (−5.05 to 83.23) | 0.02 (0–0.05) | −0.87 (−1.08 to −0.65) |