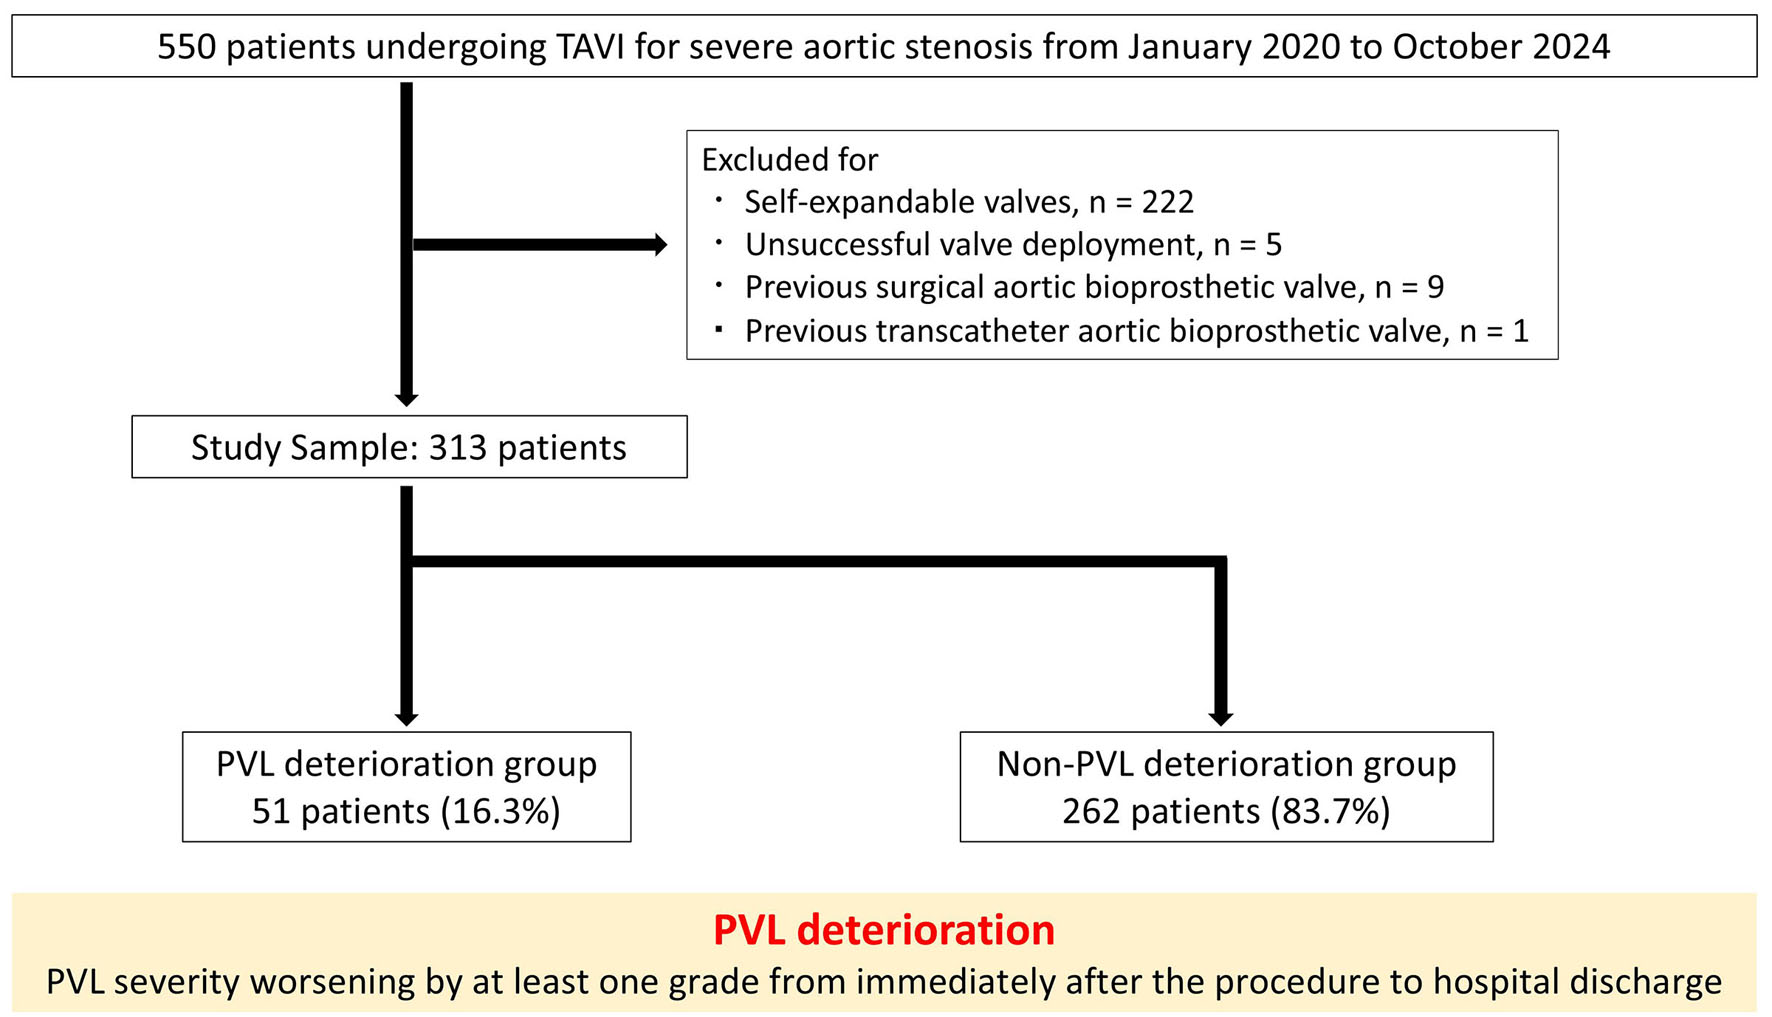
↓ Figure 1. Study flow chart. PVL: paravalvular leakage; TAVI: transcatheter aortic valve implantation.
| Cardiology Research, ISSN 1923-2829 print, 1923-2837 online, Open Access |
| Article copyright, the authors; Journal compilation copyright, Cardiol Res and Elmer Press Inc |
| Journal website https://cr.elmerpub.com |
Original Article
Volume 17, Number 6, December 2026, pages 630-641
Association Between Changes in Paravalvular Leakage After Transcatheter Aortic Valve Implantation and Serum Lactate Dehydrogenase
Figures
Tables
| Overall | PVL deterioration group | Non-PVL deterioration group | P value | |
|---|---|---|---|---|
| Values are mean ± standard deviation or n (%), unless otherwise specified. AR: aortic regurgitation; BSA: body surface area; LVEF: left ventricular ejection fraction; LCC: left-coronary cusp; LVOT: left ventricular outflow tract; MR: mitral valve regurgitation; NCC: non-coronary cusp; NYHA: New York Heart Association classification; PVL: paravalvular leakage; RCC: right-coronary cusp. | ||||
| Number of patients | 313 | 51 | 262 | |
| Age, years | 84.3 ± 5.0 | 84.2 ± 5.3 | 84.4 ± 4.9 | 0.81 |
| Age ≥ 85 years | 151 (48.2) | 23 (45.1) | 128 (48.9) | 0.62 |
| Men | 130 (41.5) | 20 (39.2) | 110 (42.0) | 0.71 |
| BSA, m2 | 1.53 ± 0.18 | 1.55 ± 0.18 | 1.52 ± 0.18 | 0.39 |
| NYHA | - | 0.08 | ||
| I/II | 242 (77.3) | 44 (86.3) | 198 (75.6) | |
| III/IV | 71 (22.7) | 7 (13.7) | 64 (24.3) | |
| Society of Thoracic Surgeons risk score | 7.4 ± 5.5 | 7.0 ± 4.3 | 7.4 ± 5.7 | 0.59 |
| Hypertension | 254 (81.2) | 47 (92.2) | 207 (79.0) | 0.02 |
| Diabetes mellitus | 87 (27.8) | 16 (31.4) | 71 (27.1) | 0.54 |
| Dyslipidemia | 122 (39.0) | 21 (41.2) | 101 (38.6) | 0.73 |
| Heart failure hospitalization | 153 (48.9) | 24 (47.1) | 129 (49.2) | 0.78 |
| Echocardiographic parameters | ||||
| LVEF, % | 58.8 ± 12.5 | 61.0 ± 11.3 | 58.4 ± 12.7 | 0.18 |
| Mean aortic gradient, mm Hg | 45.8 ± 13.0 | 45.9 ± 14.2 | 45.8 ± 12.8 | 0.95 |
| Aortic valve area, cm2 | 0.74 ± 0.22 | 0.77 ± 0.17 | 0.73 ± 0.23 | 0.31 |
| AR ≥ mild | 177 (56.6) | 36 (70.6) | 141 (53.8) | 0.02 |
| AR ≥ moderate | 41 (13.1) | 7 (13.7) | 34 (13.0) | 0.89 |
| MR ≥ moderate | 61 (19.5) | 6 (11.8) | 55 (21.0) | 0.11 |
| Computed tomography parameters | ||||
| Annulus area, mm2 | 452 ± 82 | 453 ± 78 | 451 ± 82 | 0.88 |
| Annulus perimeter, mm | 75.6 ± 6.9 | 74.1 ± 6.4 | 75.9 ± 7.0 | 0.09 |
| LVOT calc ≥ moderate | 17 (5.4) | 6 (11.8) | 11 (4.2) | 0.048 |
| Calcium score | 1,480 ± 308 | 1,769 ± 360 | 1,425 ± 263 | < 0.01 |
| LCC calcium score | 451 ± 107 | 505 ± 127 | 404 ± 95 | < 0.01 |
| NCC calcium score | 605 ± 121 | 707 ± 147 | 585 ± 105 | < 0.01 |
| RCC calcium score | 455 ± 120 | 557 ± 147 | 435 ± 103 | < 0.01 |
| Bicuspid valve | 17 (5.4) | 6 (11.8) | 11 (4.2) | 0.048 |
| Overall | PVL deterioration group | Non-PVL deterioration group | P value | |
|---|---|---|---|---|
| Values are mean ± SD or the median (IQR: 25th–75th percentile), or n (%), unless otherwise specified. EOA: effective orifice area; PPM: prosthesis–patient mismatch; PVL: paravalvular leakage; SD: standard deviation; IQR: interquartile range. | ||||
| Number of patients | 313 | 51 | 262 | |
| Fluoroscopy time, min | 17.9 ± 7.5 | 16.8 ± 6.0 | 18.1 ± 7.7 | 0.25 |
| General anesthesia | 251 (80.2) | 45 (88.2) | 206 (78.6) | 0.1 |
| Anesthesia time, min | 118 ± 50 | 107 ± 31 | 120 ± 53 | 0.09 |
| Contrast volume, mL | 39 ± 20 | 35 ± 20 | 40 ± 20 | 0.12 |
| Blood transfusion | 17 (5.4) | 3 (5.9) | 14 (5.3) | 0.87 |
| Transfemoral | 270 (86.3) | 48 (94.1) | 222 (84.7) | 0.052 |
| Valve | < 0.01 | |||
| SAPIEN 3 | 233 (74.4) | 24 (47.1) | 209 (79.8) | |
| SAPIEN 3 Ultra RESILIA | 80 (25.6) | 27 (52.9) | 53 (20.2) | |
| Valve size | < 0.01 | |||
| 20 mm | 16 (5.1) | 3 (5.9) | 13 (5.0) | |
| 23 mm | 170 (54.3) | 34 (66.7) | 136 (51.9) | |
| 26 mm | 103 (32.9) | 11 (21.6) | 92 (35.1) | |
| 29 mm | 24 (7.7) | 3 (5.9) | 21 (8.0) | |
| Under volume | 204 (65.2) | 36 (70.6) | 168 (64.1) | 0.37 |
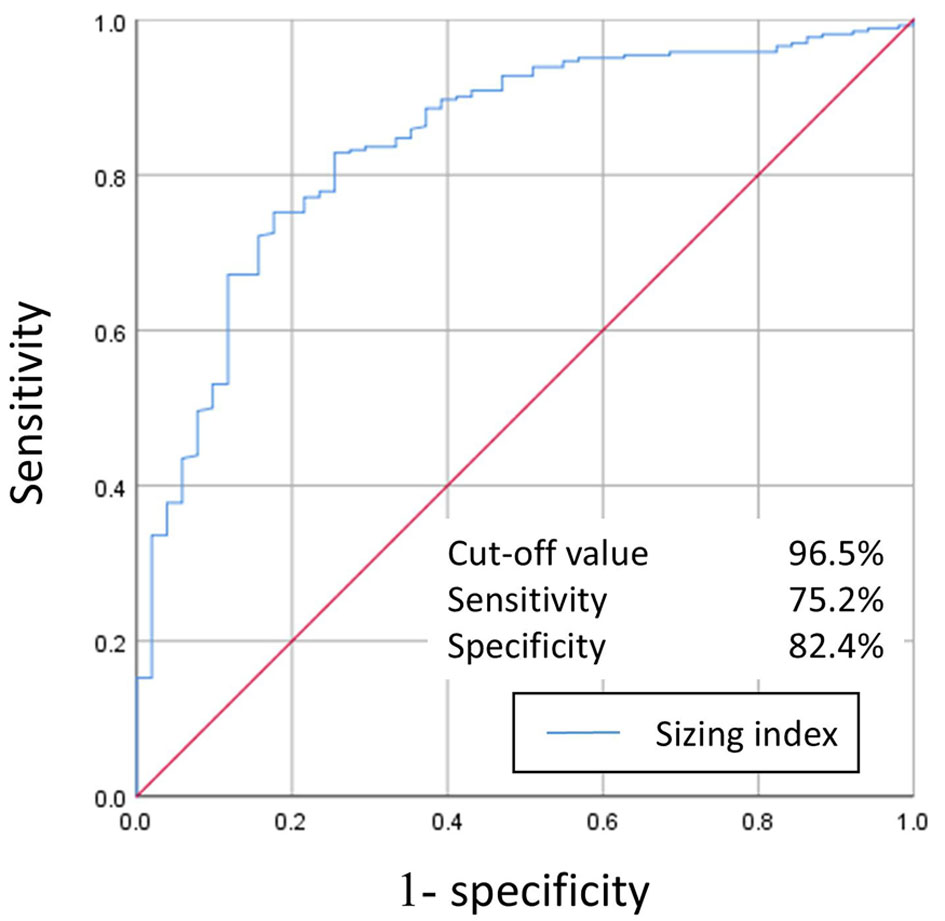
| Sizing index | 97.8 ± 5.5 | 93.2 ± 3.9 | 98.6 ± 5.4 | < 0.01 |
| Balloon pre-dilation | 155 (49.4) | 19 (37.3) | 136 (51.7) | 0.06 |
| Balloon post-dilation | 30 (9.6) | 1 (2.0) | 29 (11.1) | 0.02 |
| Conversion to open heart surgery | 0 (0) | 0 (0) | 0 (0) | |
| Vascular complications | ||||
| Minor | 1 (0.3) | 0 (0) | 1 (0.4) | 0.55 |
| Major | 11 (3.5) | 2 (3.9) | 9 (3.4) | 0.86 |
| Pacemaker implantation | 9 (3.0) | 1 (2.2) | 8 (3.2) | 0.7 |
| Hemodynamic support needed | 0 (0) | 0 (0) | 0 (0) | |
| Paravalvular leakage | ||||
| ≥ mild | 43 (13.7) | 2 (3.9) | 41 (15.7) | 0.01 |
| ≥ moderate | 2 (0.6) | 0 (0) | 2 (0.8) | 0.4 |
| Postprocedural mean aortic gradient, mm Hg | 11.3 ± 3.8 | 10.9 ± 3.9 | 11.4 ± 3.8 | 0.37 |
| Length of hospital stay, days | 7.8 (6.7–8.9) | 7.6 (6.5–8.4) | 7.9 (6.8–9.2) | 0.67 |
| EOA, cm2 | 1.92 ± 0.56 | 1.94 ± 0.61 | 1.92 ± 0.55 | 0.88 |
| Indexed EOA, cm2/m2 | 1.27 ± 0.36 | 1.26 ± 0.39 | 1.27 ± 0.35 | 0.84 |
| PPM | ||||
| ≥ moderate | 20 (6.4) | 4 (7.8) | 16 (6.1) | 0.65 |
| ≥ severe | 1 (0.3) | 1 (2.0) | 0 (0) | 0.55 |
| Clinically relevant hemolysis | 2 (0.6) | 2 (3.9) | 0 (0) | < 0.01 |
| Univariate analysis | Multivariate analysis | |||
|---|---|---|---|---|
| OR (95% CI) | P value | OR (95% CI) | P value | |
| Values are mean ± standard deviation or n (%), unless otherwise specified. AR: aortic valve regurgitation; CI: confidence interval; LVOT: left ventricular outflow tract; OR: odds ratio; PVL: paravalvular leakage. | ||||
| AR ≥ mild | 2.04 (1.09–4.02) | 0.03 | 1.82 (0.81–4.07) | 0.15 |
| LVOT calcium ≥ moderate | 3.05 (1.01–8.46) | 0.048 | 2.48 (0.59–10.4) | 0.21 |
| Aortic valve calcium score ≥ 1,435 (median) | 8.29 (3.82–20.8) | < 0.01 | 6.54 (2.62–16.3) | < 0.01 |
| SAPIEN 3 Ultra RESILIA | 4.44 (2.37–8.36) | < 0.01 | 2.67 (1.19–6.01) | 0.01 |
| Post-dilatation | 0.16 (0.01–0.78) | 0.02 | 0.41 (0.04–3.95) | 0.44 |
| Sizing index < 96.5 | 13.6 (6.55–31.1) | < 0.01 | 10.5 (4.45–24.6) | < 0.01 |
| Bicuspid valve | 3.04 (1.08–8.55) | 0.035 | ||