Figures
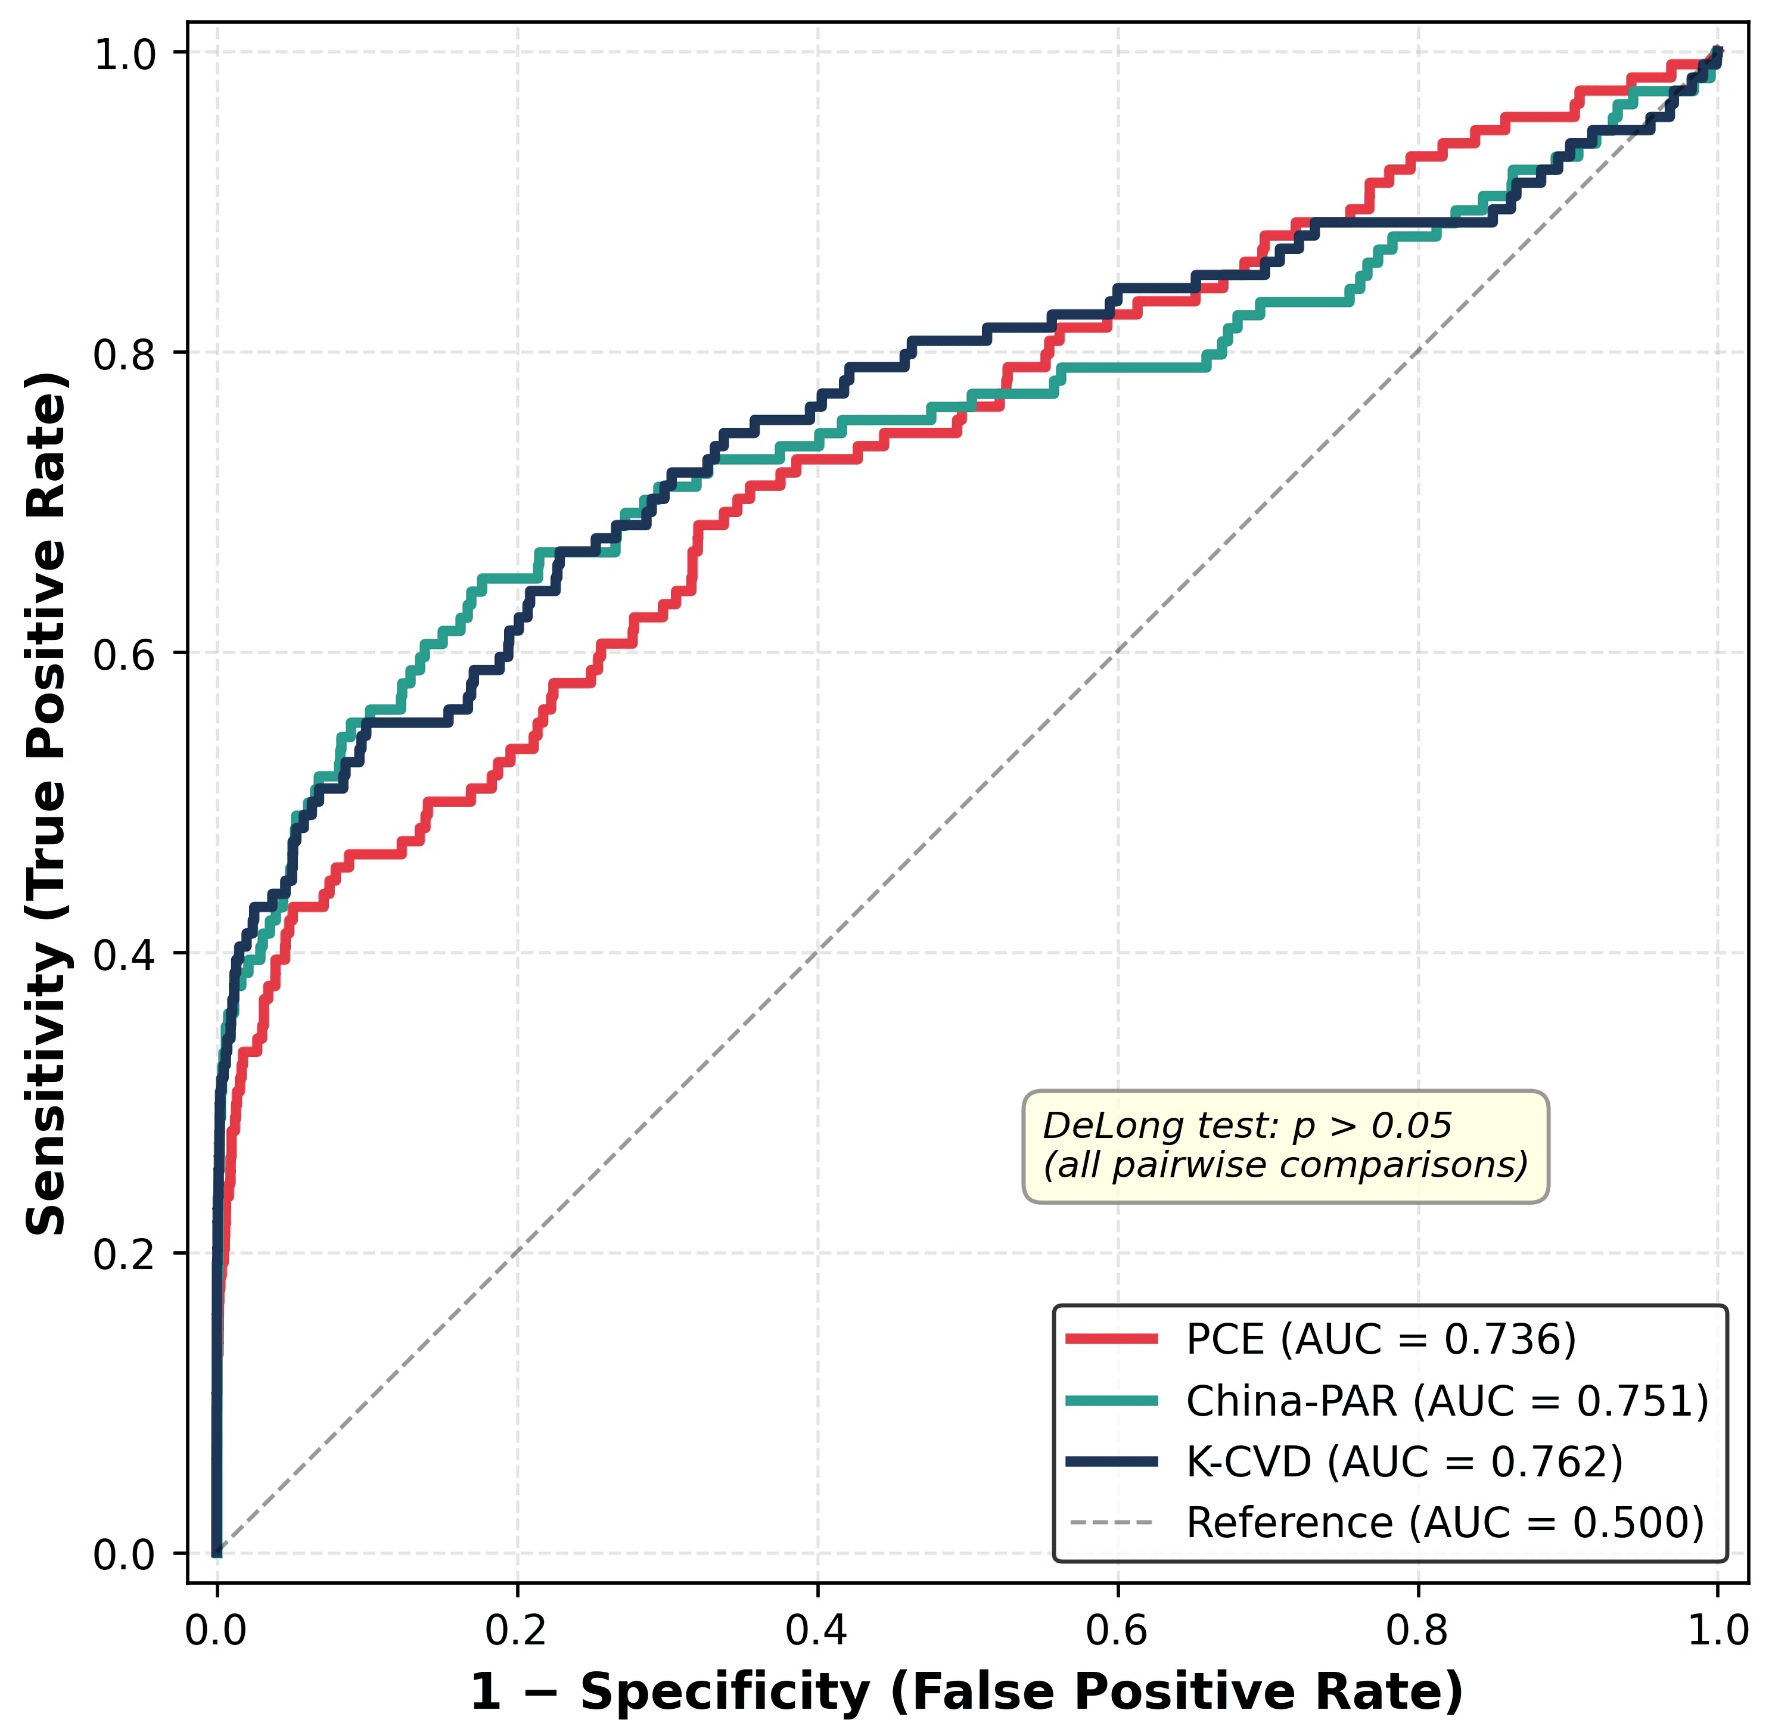
↓ Figure 1. ROC curves of three country-specific ASCVD risk equations (PCE, China-PAR, K-CVD) in 9,532 Chinese adults from CHARLS. All three equations showed similar discrimination (AUC = 0.775, 0.777, and 0.775, respectively; DeLong P > 0.05 for all pairwise comparisons). The diagonal dashed line represents the reference line of no discrimination. ASCVD: atherosclerotic cardiovascular disease; AUC: area under the ROC curve; CHARLS: China Health and Retirement Longitudinal Study; PCE: pooled cohort equation; ROC: receiver operating characteristic.
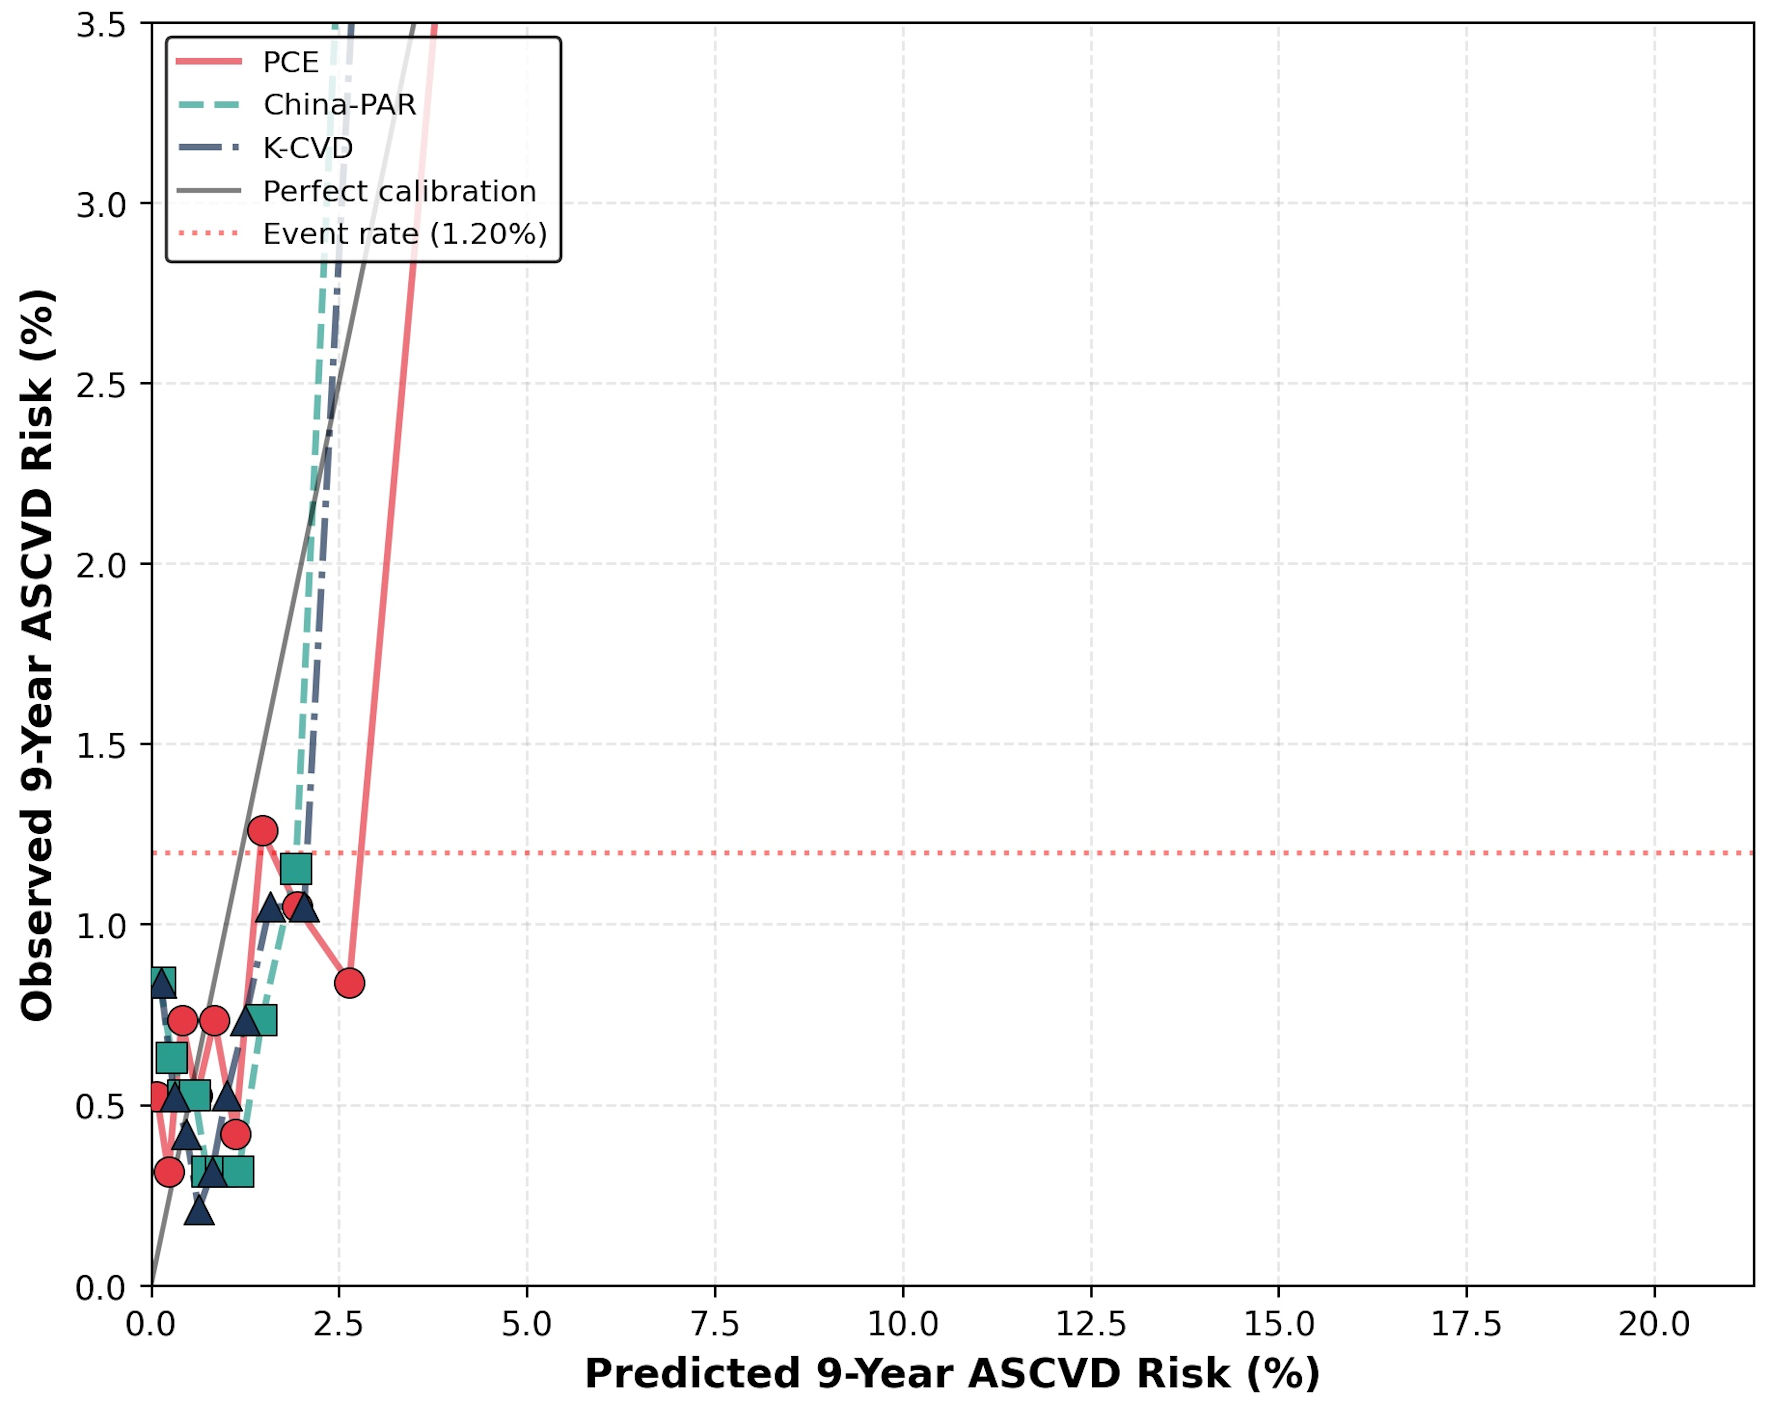
↓ Figure 2. Calibration plot of three equations (10 deciles). K-CVD showed the best fit to the diagonal, while PCE systematically overestimated and China-PAR underestimated risk. The diagonal solid line represents perfect calibration. Symbols represent the mean predicted and observed 9-year ASCVD risk in each decile. ASCVD: atherosclerotic cardiovascular disease; PCE: pooled cohort equation.
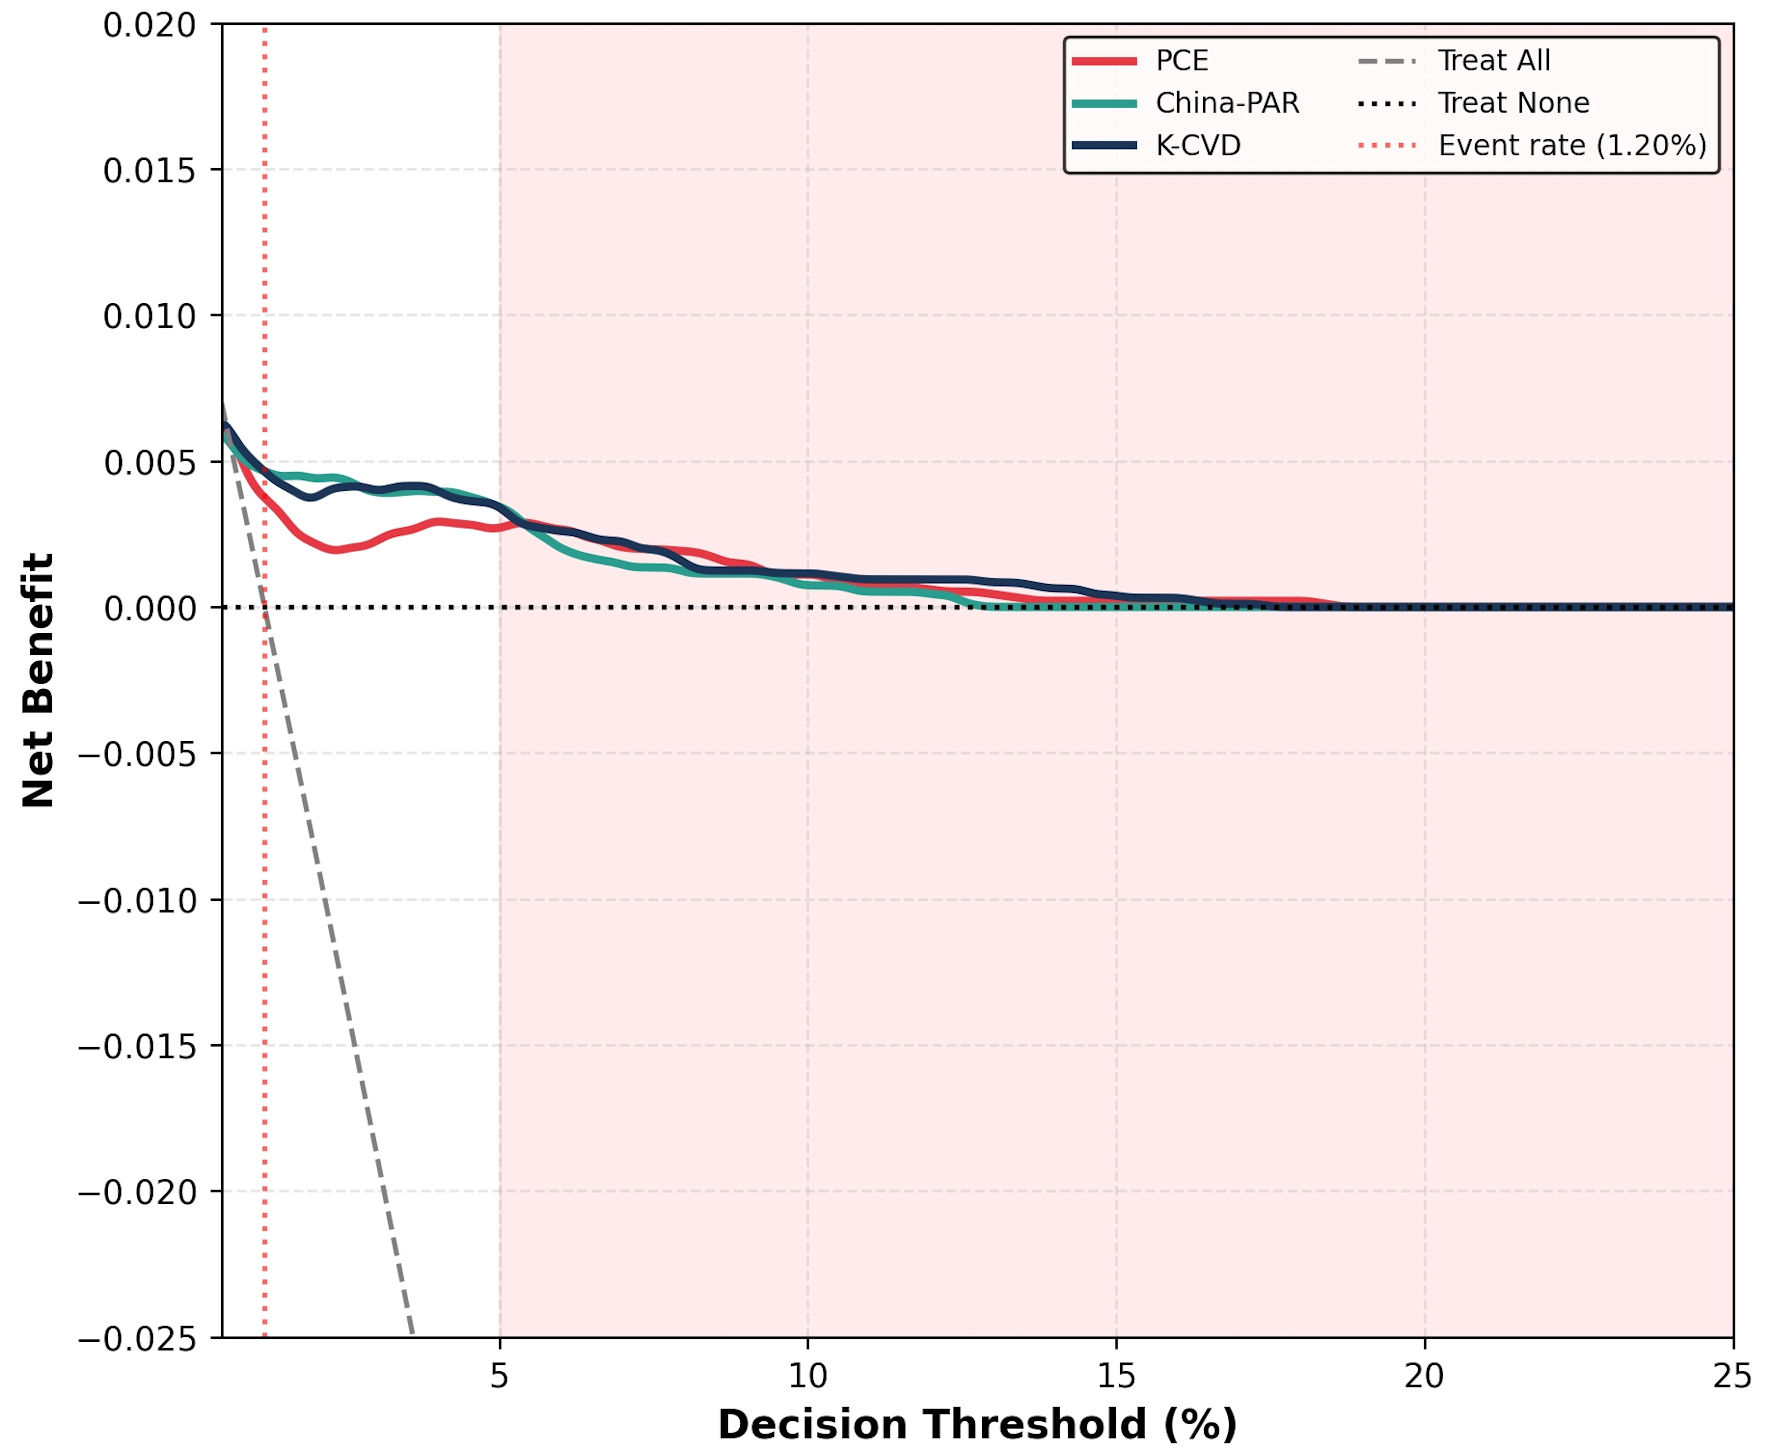
↓ Figure 3. Decision curve analysis of three equations. At thresholds ≥ 5%, all three equations showed negative net benefit (worse than Treat None). At thresholds of 1–2%, PCE and K-CVD showed modestly higher net benefit than China-PAR. The vertical dashed line at 1.2% represents the actual 9-year ASCVD event rate in the cohort. Treat All and Treat None strategies are shown as reference lines. ASCVD: atherosclerotic cardiovascular disease; PCE: pooled cohort equation.
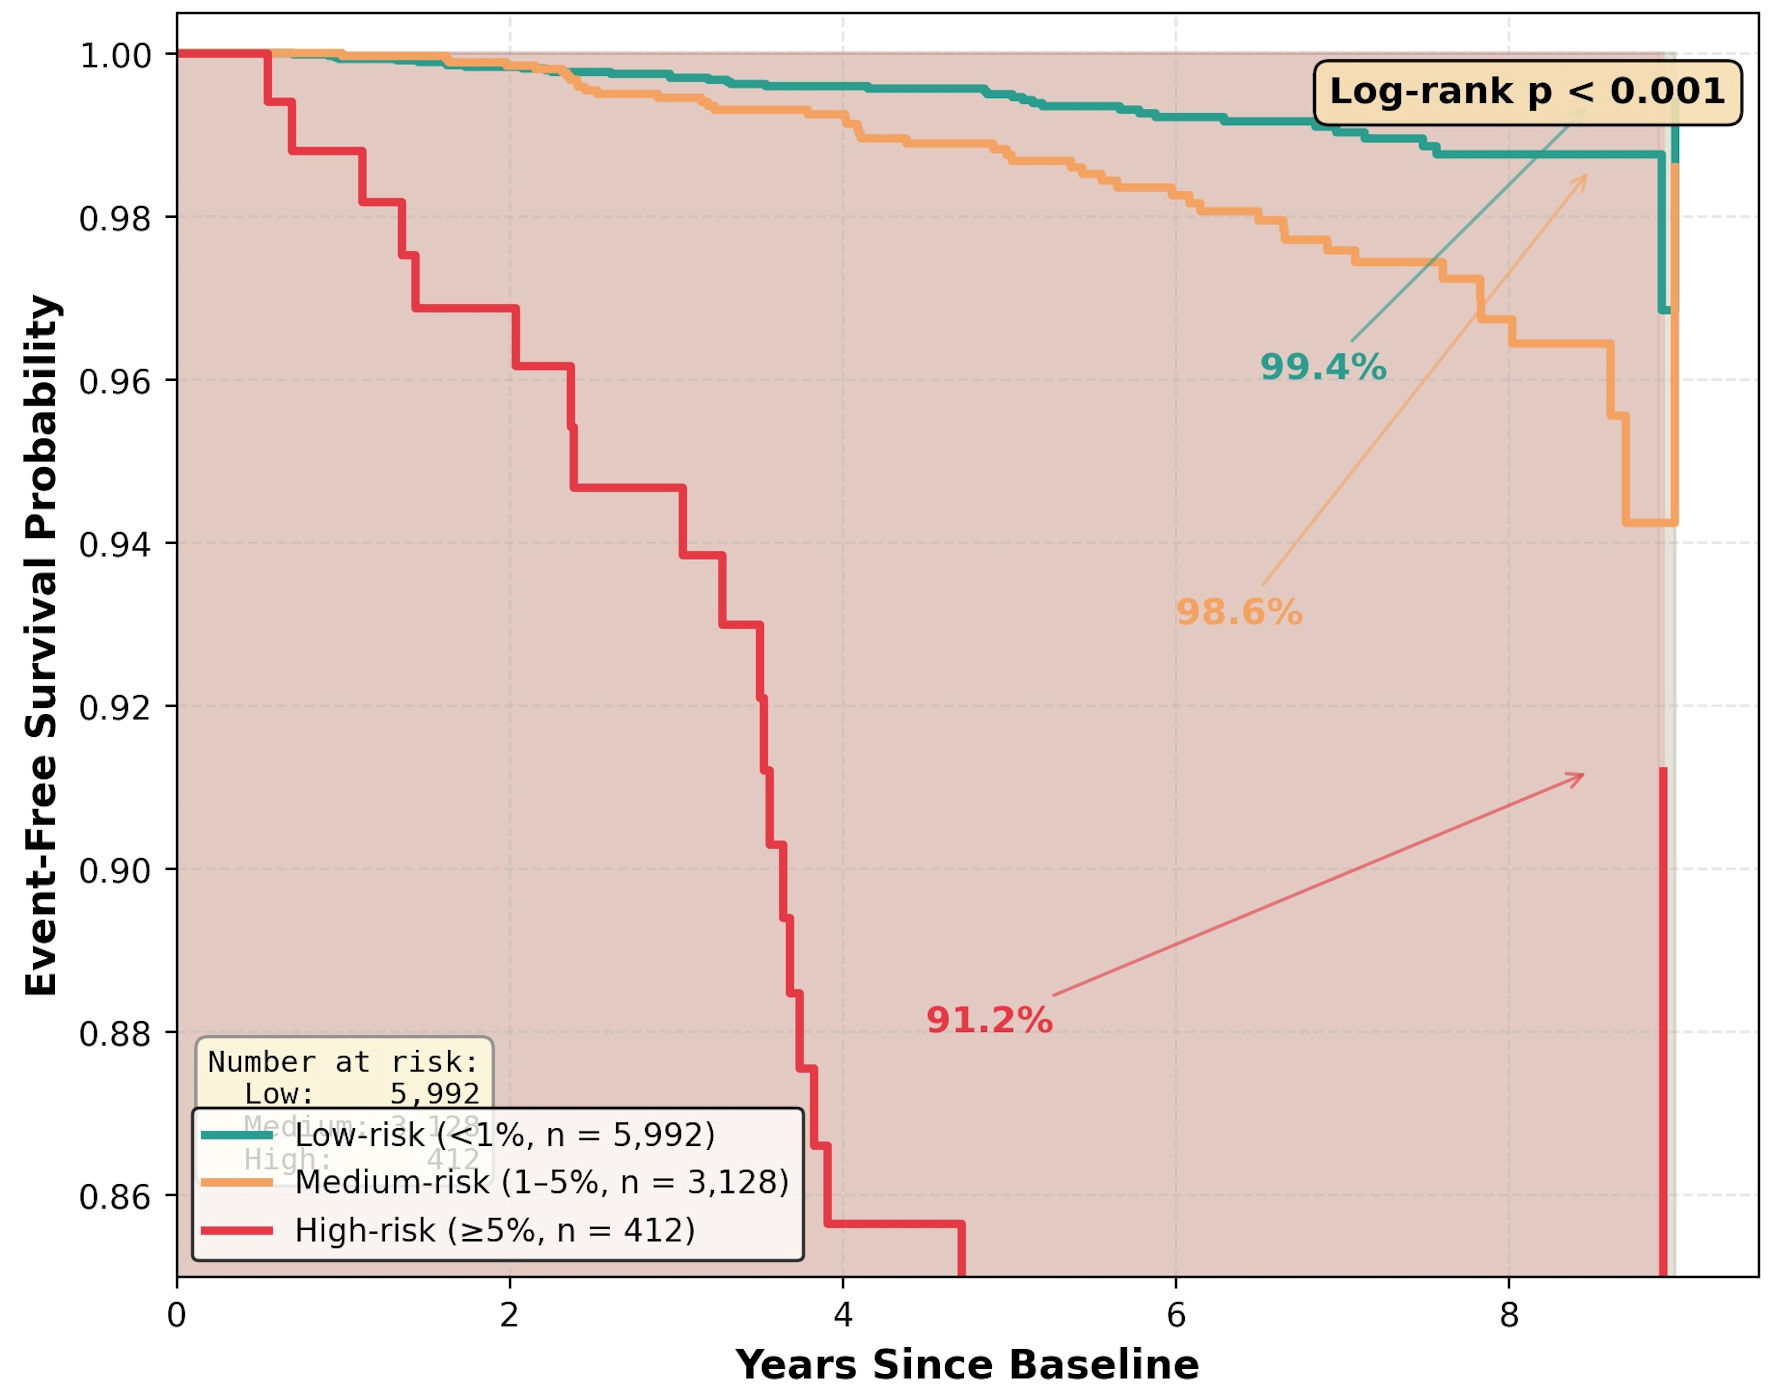
↓ Figure 4. Kaplan–Meier curves by K-CVD risk strata. High-risk participants (≥ 5%, n = 412) had significantly lower event-free survival (91.2%, 95% CI, 88.7–93.7%) than medium-risk (1–5%, n = 3,128, 98.6%) and low-risk (< 1%, n = 5,992, 99.4%) groups (log-rank P < 0.001). The 8.2-percentage-point absolute difference between high-risk and low-risk groups corresponds to a 14-fold difference in NNT. NNT: number needed to treat; CI: confidence interval.
Tables
↓ Table 1. Baseline Characteristics of 9,532 CHARLS Participants by 9-Year ASCVD Outcome
| Variable | ASCVD event (n = 114) | No event (n = 9,418) | P value |
|---|
| ASCVD: atherosclerotic cardiovascular disease; CHARLS: China Health and Retirement Longitudinal Study; HDL: high-density lipoprotein; SBP: systolic blood pressure; BP: blood pressure. |
| Age (years) | 69.1 ± 7.3 | 61.3 ± 8.1 | < 0.001 |
| Male (%) | 54.4 | 47.5 | 0.13 |
| Total cholesterol (mg/dL) | 202.5 ± 41.2 | 195.1 ± 38.0 | 0.04 |
| HDL (mg/dL) | 46.8 ± 14.5 | 51.3 ± 15.1 | 0.002 |
| SBP (mm Hg) | 141.2 ± 23.5 | 132.4 ± 22.2 | < 0.001 |
| Hypertension (%) | 58.8 | 32.0 | < 0.001 |
| Diabetes (%) | 22.8 | 8.5 | < 0.001 |
| Current smoking (%) | 43.0 | 28.1 | 0.001 |
| BP medication (%) | 38.6 | 18.2 | < 0.001 |
| Cystatin C (mg/L) | 1.18 ± 0.32 | 0.97 ± 0.24 | < 0.001 |
↓ Table 2. Discrimination and Calibration of Three ASCVD Risk Equations in CHARLS (N = 9,532)
| Equation | AUC | Predicted 9-year | Observed 9-year | P/O ratio | Brier |
|---|
| ASCVD: atherosclerotic cardiovascular disease; AUC: area under the ROC curve; CHARLS: China Health and Retirement Longitudinal Study; P/O: predicted/observed; PCE: pooled cohort equation; ROC: receiver operating characteristic. |
| PCE | 0.775 | 1.40% | 1.20% | 1.17 | 0.0120 |
| China-PAR | 0.777 | 1.08% | 1.20% | 0.90 | 0.0118 |
| K-CVD | 0.775 | 1.16% | 1.20% | 0.97 | 0.0119 |
| K-CVD (recalibrated) | 0.775 | 1.20% | 1.20% | 1.00 | 0.0116 |