| Cardiology Research, ISSN 1923-2829 print, 1923-2837 online, Open Access |
| Article copyright, the authors; Journal compilation copyright, Cardiol Res and Elmer Press Inc |
| Journal website https://cr.elmerpub.com |
Original Article
Volume 16, Number 1, February 2025, pages 22-32

Characterization of Intracardiac Flow in the Right Ventricle With Pressure and Volume Overload in Children
Yasunobu Hayabuchia, b ![]() , Yukako Hommaa
, Yukako Hommaa
aDepartment of Pediatrics, Tokushima University, Tokushima, Japan
bCorresponding Author: Yasunobu Hayabuchi, Department of Pediatrics, Tokushima University, Tokushima 770-8503, Japan
Manuscript submitted November 14, 2024, accepted December 23, 2024, published online January 6, 2025
Short title: VFM in RV With Pressure and Volume Overload
doi: https://doi.org/10.14740/cr2009
| Abstract | ▴Top |
Background: Blood flow visualization using vector flow mapping (VFM) holds potential as a novel indicator of right ventricular (RV) function.
Methods: This study included 12 patients with atrial septal defect (ASD group, mean (± standard deviation) age: 6.2 ± 1.5 years), six patients with pulmonary hypertension (PH group, mean age: 6.8 ± 2.3 years), and 35 healthy, age-matched children (control group, mean age: 7.3 ± 1.6 years). VFM data were obtained from the parasternal RV short-axis view.
Results: VFM images in the majority of the control group showed a counterclockwise rotating vortex below the tricuspid anterior leaflet and clockwise vortex below the septal leaflet in early diastole. In late diastole, a clockwise vortex flow appeared at the RV apex to the outflow tract. In the ASD and PH groups, the formation of vortical flow below the tricuspid valve was decreased. Late-diastolic vortices also differed from the control group, with counterclockwise or no vortex flow seen in this phase in these groups. Flow energy loss (EL), kinetic energy (KE) and energetic performance index (EPI) were related to RV systolic and diastolic functions. Mean EL over one cardiac cycle (ELcycle) was significantly higher in the PH group than in the control group (P = 0.0471). KE of the RV inflow tract (KE-RVin) and outflow tract (KE-RVout) were significantly lower in the PH group than in the control and ASD groups (P < 0.05 each).
Conclusions: These results suggest that RV vortex formation may be a factor in efficient ejection. EL, KE, and EPI may be applicable to evaluate RV contractility and diastolic function.
Keywords: Vector flow mapping; Right ventricle; Energy loss; Kinetic energy
| Introduction | ▴Top |
Blood flow visualization using vector flow mapping (VFM) has been applied for clinical issues in various cardiovascular diseases [1, 2]. Intracardiac flow studies provide clues to the pathophysiological mechanisms by which abnormal turbulent flow increases cardiac workload and deteriorates ventricular functions. The intraventricular vortex and its energetic efficiency affect patient outcomes [1, 2].
Previous VFM studies have focused on left ventricular (LV) abnormal physiological vortices, potentially allowing for predictive diagnosis of cardiac function. However, few studies have conducted VFM analysis of right ventricular (RV) function [3-5]. RV dysfunction can be a major feature of right-sided heart diseases, such as pulmonary hypertension, congenital heart disease, and cardiomyopathy, but can also be seen in conditions secondary to LV dysfunction [6, 7]. Accurate measurement of RV volume and function is the focus of many investigations using various modalities [8-11]. The most widely employed clinical technique for RV morphological and functional assessments is two-dimensional echocardiography [8, 10], but its accuracy is limited by the complex crescent-shaped geometry of the RV [8, 9]. Cardiac magnetic resonance imaging (MRI) offers many advantages. First, the lack of exposure to ionizing radiation permits safe use in children and pregnant women. Second, high-resolution and three-dimensional images of the cardiac chambers and vessels can be produced [12-14]. However, MRI requires more patient cooperation, including breath hold, than other tests. Installation and operation of MRI equipment is costly, representing an important consideration both for hospitals and patients. Further, repeated MRI scans can be difficult to obtain. If VFM evaluation can accurately evaluate RV dysfunction, this modality could be of significant utility because of the ease of frequent clinical use.
We anticipated that flow in the normal RV, with its unique configuration and contraction pattern, would differ from intraventricular flow in the LV. We thought that analysis of RV blood flow patterns might be useful in determining the severity of cardiac disease, predicting prognosis, and determining the effectiveness of treatment. This study evaluated the change of RV flow visualization under conditions of pressure and volume overload, comparing not only vortex flow direction, but also energetic flow efficiency based on the quantitative evaluation of flow energy loss (EL) and kinetic energy (KE) inside the RV.
The aim of this study was to use VFM technology to establish reference values for RV flow dissipative EL in healthy subjects, and under conditions of pressure and volume overload to assess cardiac condition using transthoracic echocardiography at the bedside in routine medical care. Further aims were to establish reference values for KE and a relatively new index, energetic performance index (EPI), of the RV in children.
| Materials and Methods | ▴Top |
Patient characteristics
This was a single-center, prospective, observational study that enrolled 15 patients with atrial septal defect (ASD group, mean age ± standard deviation (SD): 6.6 ± 1.7 years (range: 3.5 - 10.0 years)) and seven patients with pulmonary hypertension (PH group, mean age: 6.9 ± 2.1 years (range: 3.8 - 10.0 years)). The PH group comprised four patients with idiopathic pulmonary artery hypertension, one patient with postoperative patent ductus arteriosus, one patient with mitral stenosis and one patient with developmental hypoplastic lung disease. We selected patients with these conditions because they showed RV volume and pressure overload. In these patients, cardiac catheterization was performed within 3 days of echocardiographic examination. We also enrolled 40 consecutive healthy, age-matched subjects without any abnormalities evident on chest X-ray and electrocardiography or echocardiography (control group, mean age: 7.4 ± 1.7 years (range: 3.0 - 10.0 years)). Data were collected between November 2023 and July 2024. All protocols were approved by the Institutional Review Board of Tokushima University Hospital and conformed to the ethical guidelines of the Declaration of Helsinki (1975). This study was conducted in compliance with all the applicable institutional ethical guidelines for care and welfare. The parents of all subjects provided written, informed consent for their children to participate in the study.
Echocardiography
Standard transthoracic echocardiography was performed using a Vivid E95 echocardiography system with a 3S-RS and 6S-RS probe (GE Healthcare, Chicago, IL, USA). All data were obtained with the patient in the left lateral decubitus position during end-expiratory apnea. Echocardiographic parameters of RV function - tricuspid annular plane systolic excursion (TAPSE), pulsed Doppler flow, tissue Doppler imaging, and RV factional area change (RVFAC) - were assessed in accordance with published guidelines [15].
VFM data were obtained by color Doppler imaging in the parasternal short-axis view of the right ventricle. This view shows the RV anterior wall and apex, RV outflow tract, pulmonary valve, tricuspid valve and right atrium (RA). In this view, RV inflow via the RA, intraventricular flow and RV outflow can be observed simultaneously in one cross-section [15]. The maximum velocity range of the color Doppler (Nyquist limit) was set at 60 - 80 cm/s, and the color baseline was kept at 0 cm/s. The frame rate of color Doppler flow images was maintained at 20 - 30 frames/s [16-18].
Data acquisition
Stored cine-loop images were transferred to EchoPAC® (GE Healthcare) and converted into HDF-5 files. These HDF-5 files were imported into iTECHO® VFM software (Cardio Flow Design, Tokyo, Japan) for analysis. The RV cavity-endocardial border and pulmonary artery wall were manually traced on the initial frame, and two-dimensional wall tracking was applied to detect wall motion. If the aliasing phenomenon was observed in the cine-loop images, aliased pixels were manually corrected.
Figure 1 shows representative images of VFM in a subject from the control group. Velocity vector fields were indicated with yellow arrows, and streamlines were drawn to clarify the vortex shape. In the present study, a vortex was defined as a collection of streamlines that made a curved flow and returned to a starting point after having moved some distance from the starting point. The presence and direction of the vortex flow was determined as the consensus decision of two echocardiography-savvy pediatric cardiologists. VMF software iTECHO® provided the EL inside the RV and averaged over three cardiac cycles.
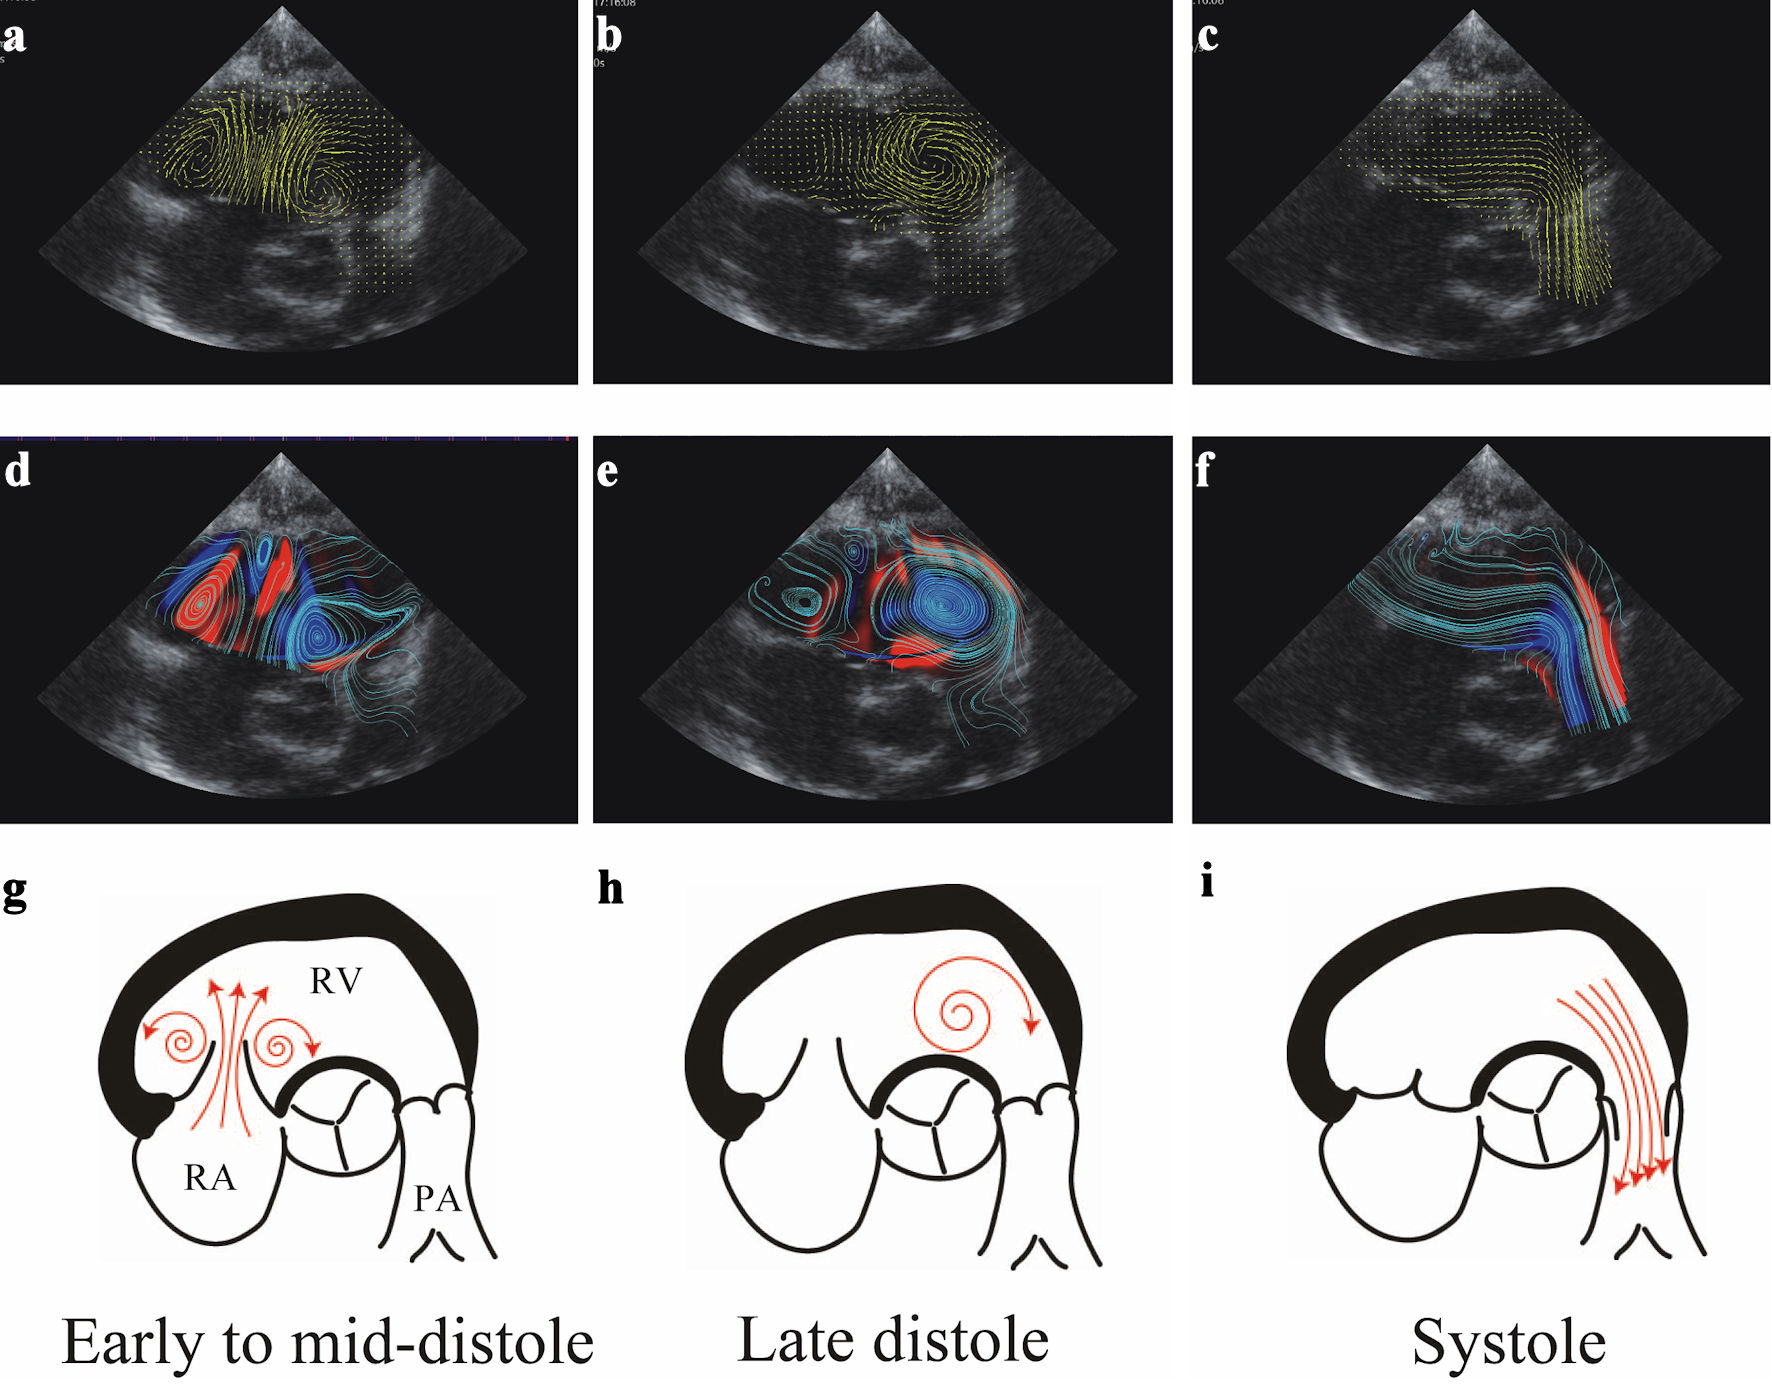 Click for large image | Figure 1. Representative RV flow sequence during phases of cardiac cycle in a control group subject. (a-c) Visualization of VFM images in early diastole, late diastole, and systole. Yellow lines and arrows indicate the direction of flow, and line length is proportional to the velocity of flow. (d-f) Streamline and vorticity during the cardiac cycle. Clockwise (CW) vortices are shown in blue, counterclockwise (CCW) vortices in red. Note the presence of CW (blue) and CCW (red) vortices during early-diastolic filling below the septal and anterior leaflets, respectively. The CW vortex below the septal leaflet moves apically to the outflow tract region during late diastole, persisting further during isovolumic contraction. CW vortex is shown in this location. Ejection is characterized by accelerating this vortex flow towards the RV outflow tract. (g-i) Schematic diagrams of the vector flow mapping display during each phase of the cardiac cycle. RV: right ventricular; VFM: vector flow mapping. |
Flow EL was defined with the following equation:
Intraventricular flow EL was caused by turbulent flow. The dissipated energy itself was generated by ventricular wall motion. The ratio of EL to the energy generated by ventricular muscle work is therefore essential to assess ventricular performance [2]. However, ventricular muscle work itself is difficult to assess noninvasively. EPI was thus defined as KE/EL inside the ventricle, to estimate flow energy efficiency [19-21]:
Statistical analysis
Continuous variables are expressed as mean and SD or as median with the fifth - 95th or 25th - 75th percentiles, as appropriate. Discrete variables are presented as frequency (percentage). Statistical significance was determined using Student’s t-test, the Mann-Whitney U test or two-factor mixed-design analysis of variance, and the Kruskal-Wallis test, as appropriate. The Tukey-Kramer test was performed for further analysis if a significant difference was confirmed. Fisher’s exact test was used to determine whether differences between expected and observed frequencies were significant. Correlations between VFM parameters and echocardiographic measurements were evaluated using Pearson’s correlation coefficients.
All statistical data were calculated using Prism version 10.0 (GraphPad Software, San Diego, CA, USA) and JMP version 16 (SAS Institute, Cary, NC, USA) software installed on a desktop computer. Values of P < 0.05 (two-sided) were considered statistically significant.
Intra-observer variability was assessed by one investigator (YH) who conducted measurements on the same patients with an interval of 8 weeks, and inter-observer variability was assessed by a second investigator (YH) who was blinded to previous results and performed the same measurements on 10 randomly selected participants. Intra- and inter-observer agreements were assessed using intraclass correlation coefficients. In addition, agreement between investigators was tested using Bland-Altman analysis by calculating bias (mean difference) and 1.96 SDs around the mean difference.
| Results | ▴Top |
Patient characteristics
Among all participants, five, three, and one subjects with inadequate echocardiographic images were excluded from all subsequent analyses in the control, ASD, and PH groups, respectively. Suboptimal images were judged because of echocardiographic images in which the entire RV free wall was not depicted, inadequate frame rate or Nyquist limit for appropriate color flow. Accordingly, the study group included 35 healthy children (mean age: 7.3 ± 1.6 years (range: 3.0 - 9.9 years)), 12 patients with ASD (mean age: 6.2 ± 1.5 years (range: 3.5 - 10.0 years)) and six patients with PH (mean age: 6.8 ± 2.3 years (range: 3.8 - 9.5 years)) (Table 1). No significant differences were seen in sex, age, weight, height, body surface area, heart rate, blood pressure or QRS duration among the three groups. As expected, RVFAC and TAPSE were significantly lower in the PH group than in the control and ASD groups (P < 0.0001 each). Left ventricular end-diastolic dimension (LVEDD) and left ventricle ejection fraction (LVEF) were significantly lower in the PH group than in the control and ASD group (LVEDD: P < 0.05 each; LVEF: P < 0.0001, each). Table 1 summarizes the clinical, echocardiographic, and hemodynamic data of subjects.
 Click to view | Table 1. Clinical Characteristics in Each Group |
Vortex formation
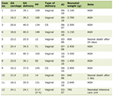
VFM vortex analysis was separated into systole (ejection period), early diastole (early to mid-diastole) and late diastole (late diastole to isovolumic contraction). Figures 1 and 2 show representative examples of VFM images of the RV from the control and PH groups, respectively.
 Click for large image | Figure 2. Representative RV flow sequence during phases of the cardiac cycle in a PH group patient. (a-c) Visualization of VFM images in early diastole, late diastole, and systole. Yellow lines and arrows indicate direction of flow, and line length is proportional to the velocity of flow. (d-f) Streamline and vorticity during the cardiac cycle. Clockwise (CW) vortices are shown in blue color, counterclockwise (CCW) vortices in red. Note that no vortices are present during early-diastolic filling below the septal and anterior leaflets. A CCW vortex is shown apical to the outflow tract region during late diastole. (g-i) Schematic diagrams of vector flow mapping during each phase of the cardiac cycle. RV: right ventricular; VFM: vector flow mapping. |
For the control group, the majority (33 of 35 subjects, 94%) demonstrated two early-diastole vortices at the anterior and septal tricuspid valve leaflets (Table 2). Two subjects (6%) in the control group demonstrated a single vortex at the septal leaflet and no vortex at the anterior leaflet. All these vortices at the septal leaflet were clockwise, and vortices at the anterior leaflet showed counterclockwise rotation. Nine of 12 patients (75%) had vortices at the septal leaflet, and 11 of 12 (92%) had vortices at the anterior leaflet in early diastole in the ASD group. Three of six patients (50%) had vortices at the septal leaflet and two of six (33%) had vortices at the anterior leaflet in the PH group. The PH group showed a lower frequency of vortices under the tricuspid valve than the control and ASD groups (P = 0.0262 and P < 0.001, respectively).
Click to view | Table 2. Vortex Flow Appearance Rate |
In late diastole, 31 of 35 subjects (91%) in the control group had clockwise vortices in the RV apex to RV outflow tract. Patients in the ASD and PH groups showed a lower frequency of vortices (P < 0.0001). In the PH group, three patients (50%) demonstrated counterclockwise vortices, and three patients (50%) did not show vortices in end-diastole. In the ASD group, two patients had counterclockwise vortices, six patients had clockwise vortices, and four patients had no vortices. Notably, these results in the ASD and PH groups contrasted with those of the control group, which showed a completely different rate and direction of vortex flow. Representative VFM images from the PH group are shown in Figure 2. No coordinated or consistent vortices were observed in systolic and ejection phases in any groups.
EL
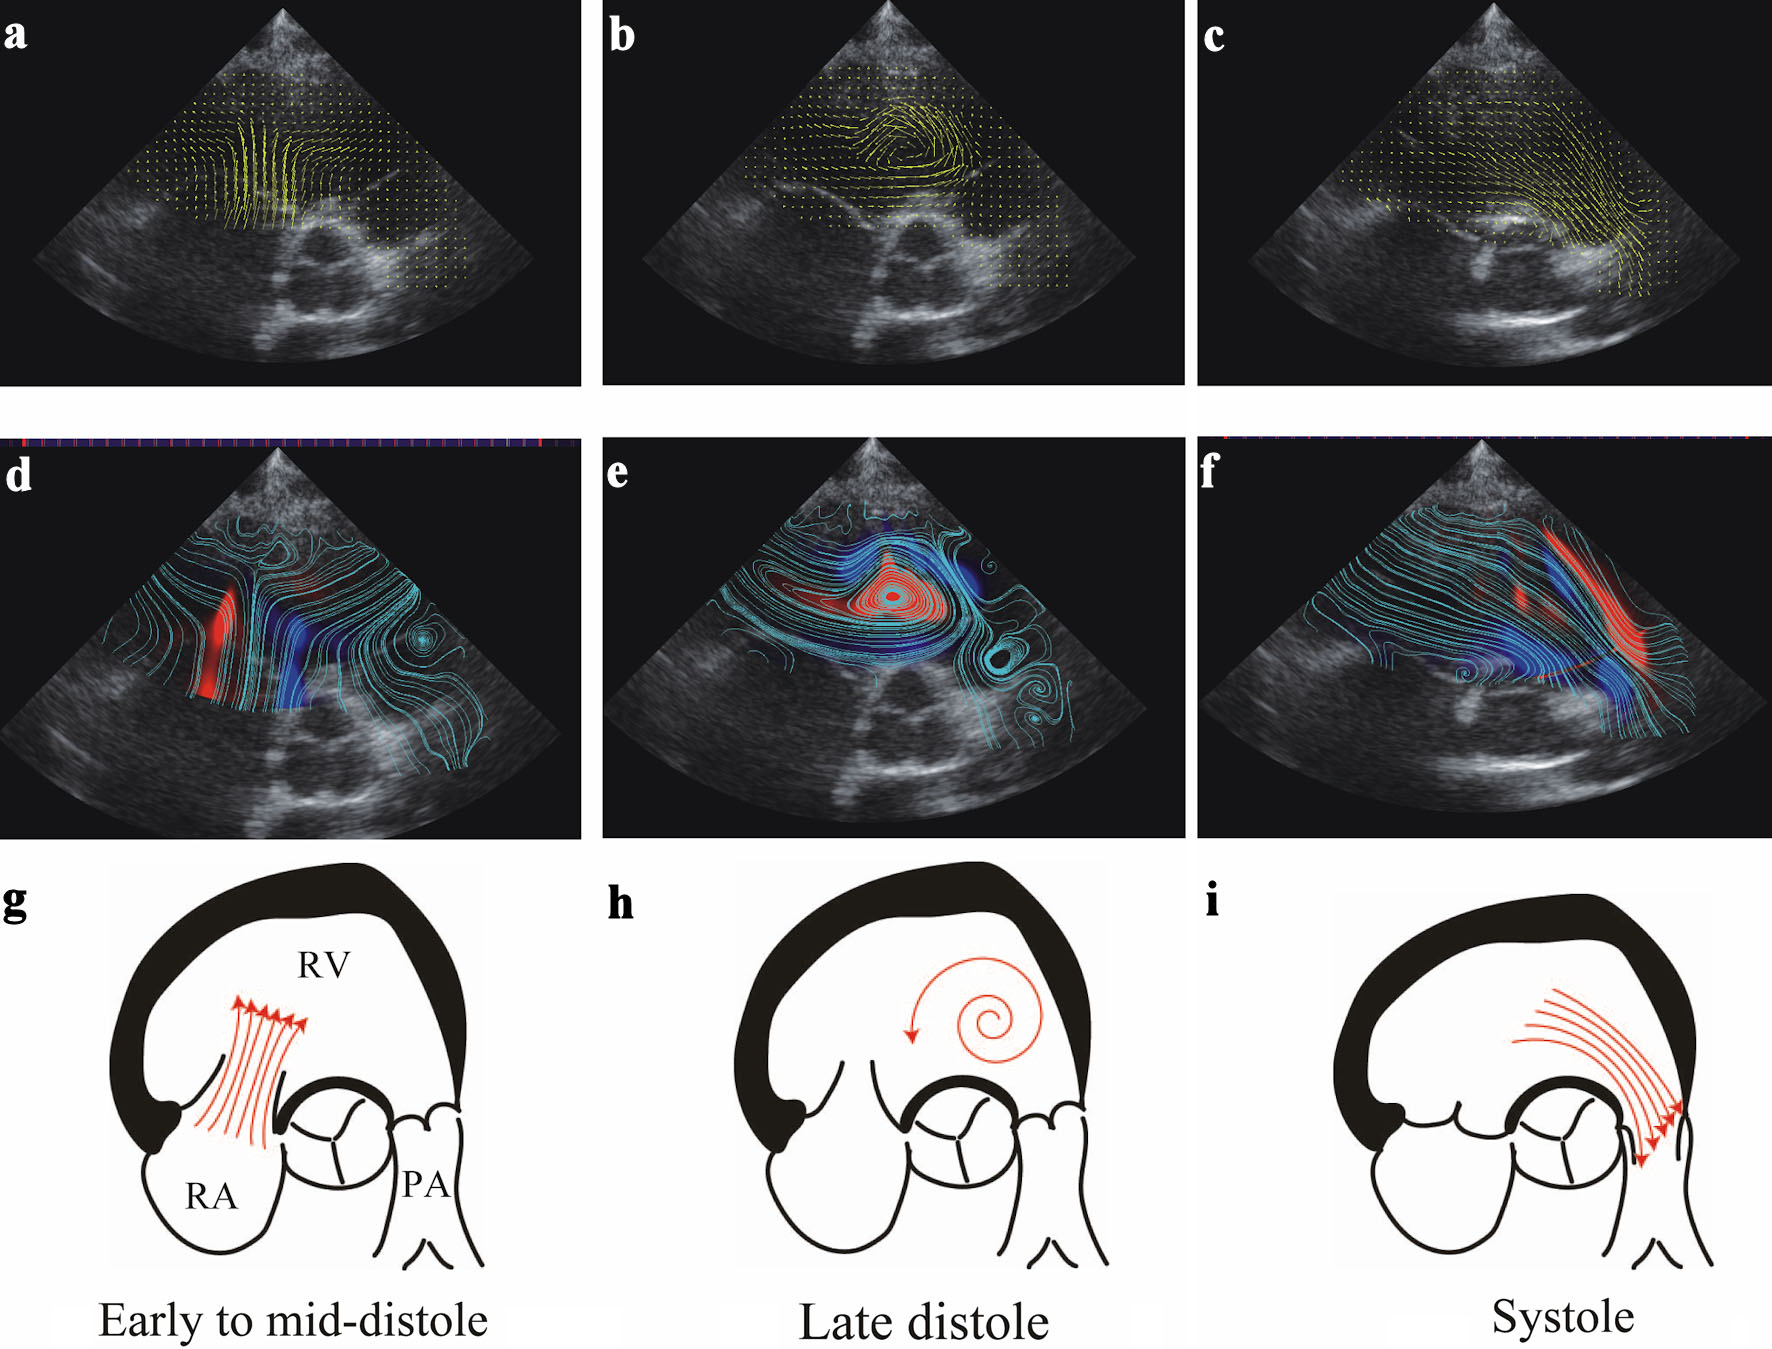
Mean systolic EL (ELsys), mean diastolic EL (ELdia) and mean EL over one cardiac cycle (ELcycle) in each group are presented in Figure 3. No significant difference in ELsys was seen between the control, ASD and PH groups. As for ELdia measurements, the PH group showed significantly higher values than the control group (P = 0.0046). No significant difference was seen between control and ASD groups. ELcycle was significantly higher in the PH group than in the control group (P = 0.0471).
 Click for large image | Figure 3. Comparison of energy loss between groups. Mean systolic energy loss (ELsys) (a), mean diastolic energy loss (ELdia) (b) and mean energy loss over one cardiac cycle (ELcycle) (c) obtained from VFM in each group are shown. Boxes show distribution (25th and 75th percentiles; central line, median). Vertical lines represent the range between the fifth and 95th percentiles. *P = 0.0046 vs. control; †P = 0.0471 vs. control. VFM: vector flow mapping; ASD: atrial septal defect; PH: pulmonary hypertension. |
KE
KE-RVin was significantly lower in the PH group than in the ASD group (P = 0.0036) (Fig. 4a). Further, KE-RVout was significantly lower in the PH group than in the ASD group (P = 0.0069) (Fig. 4b). No significant differences were evident between control and ASD groups or between control and PH groups in the evaluation of KE-RVin and KE-RVout, respectively.
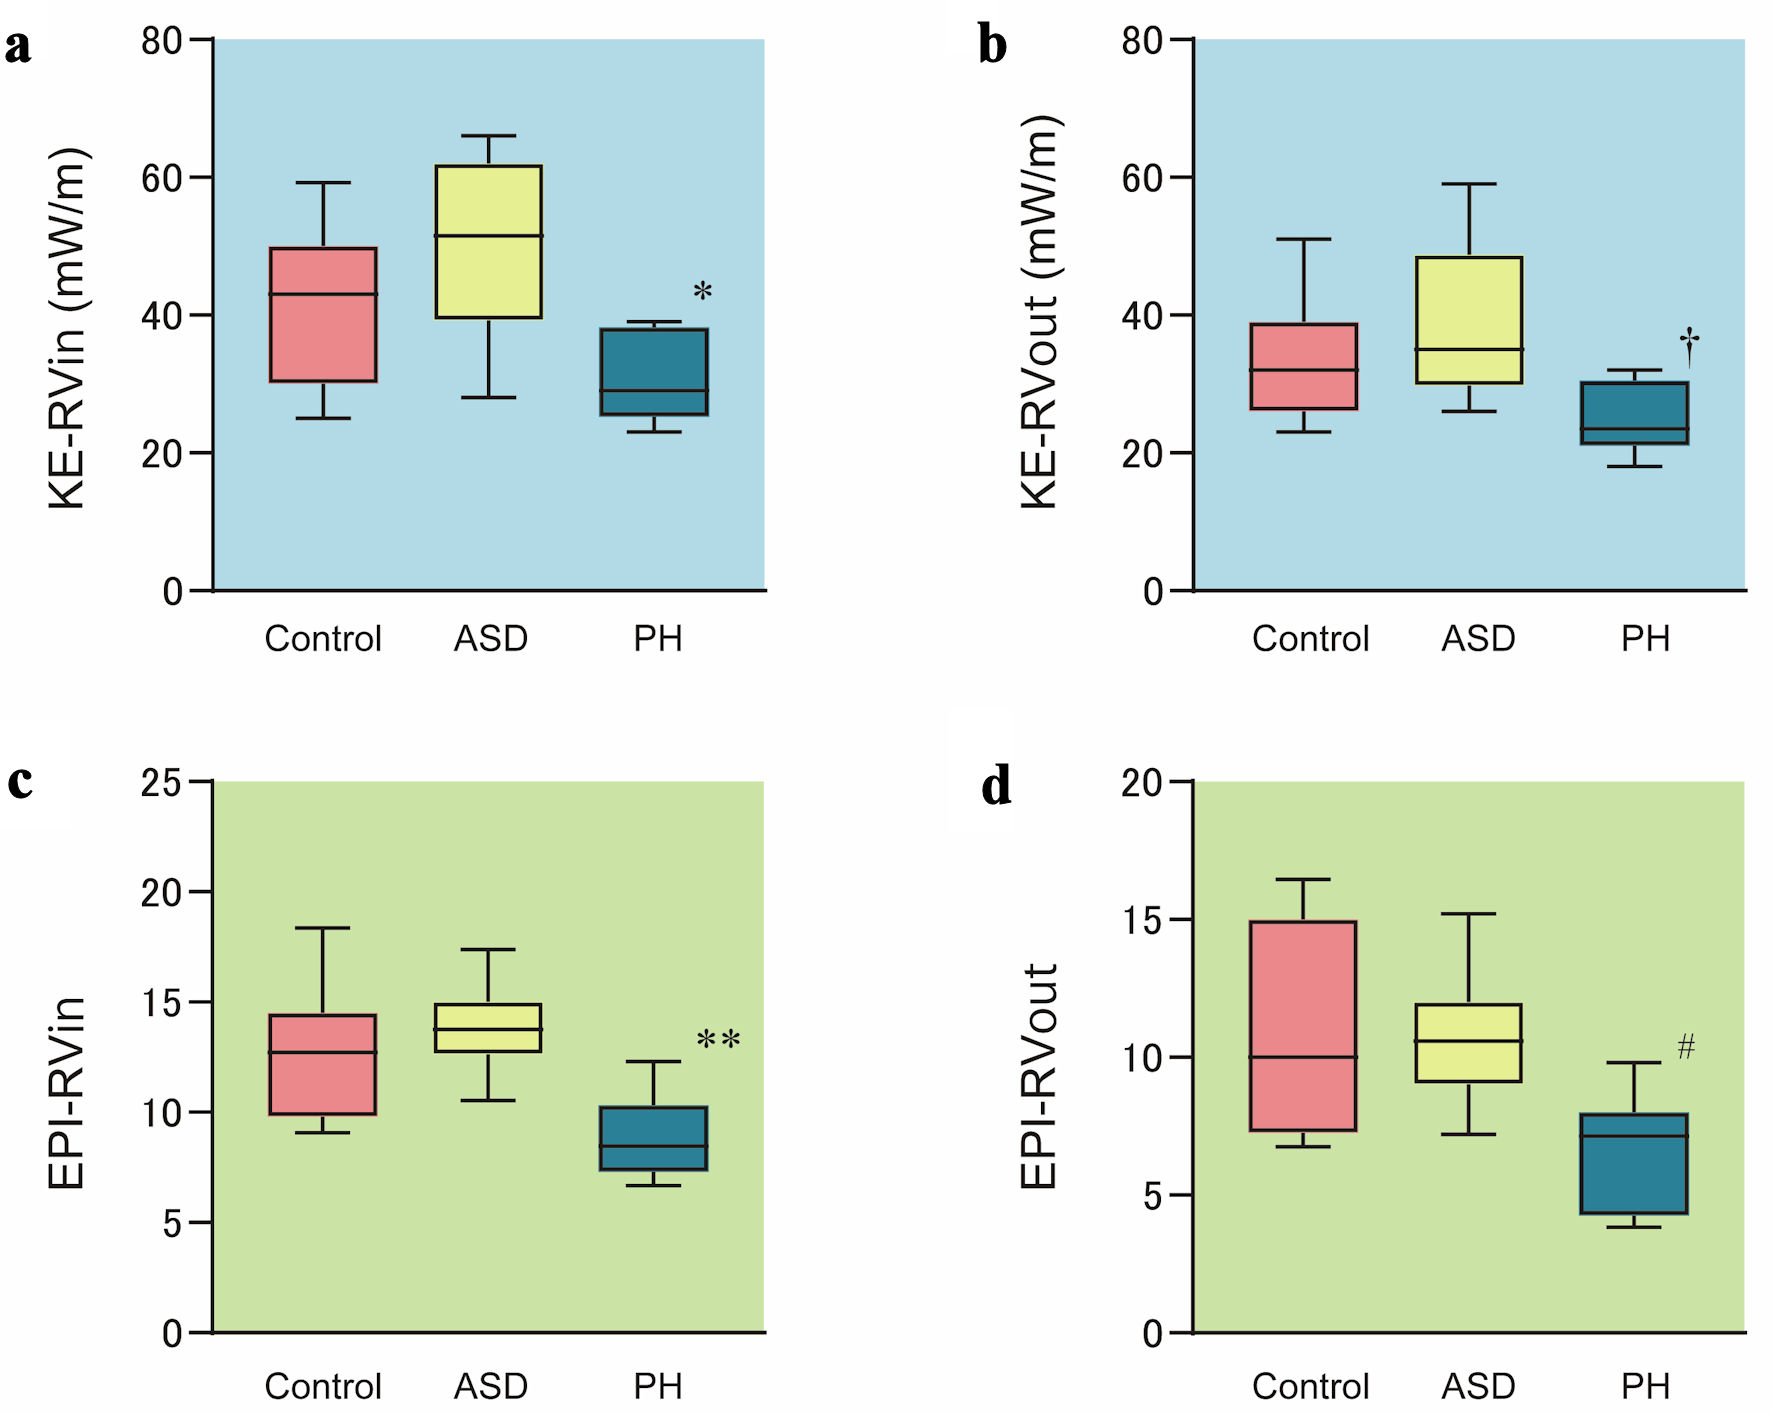 Click for large image | Figure 4. Comparison of kinetic energy and energetic performance index between groups. Kinetic energy of the RV inflow tract (KE-RVin) (a), kinetic energy of the RV outflow tract (KE-RVout) (b), energetic performance index of the RV inflow tract (EPI-RVin) (c) and energetic performance index of the RV outflow tract (EPI-RVout) (d) obtained from VFM in each group are shown. Boxes show distribution (25th and 75th percentiles; central line, median). Vertical lines represent the range between the fifth and 95th percentiles. *P = 0.0331 vs. control and P = 0.0036 vs. ASD; †P = 0.0233 vs. control and P = 0.0069 vs. ASD; **P = 0.0088 vs. control and P = 0.0024 vs. ASD; #P = 0.0196 vs. control and P = 0.0487 vs. ASD. VFM: vector flow mapping; ASD: atrial septal defect; PH: pulmonary hypertension. |
EPI
EPI-RVin was significantly lower in the PH group than in the control group (P = 0.0088) or ASD group (P = 0.0024) (Fig. 4c). No significant difference was evident between ASD and control groups. EPI-RVout was also significantly lower in the PH group than in the control group (P = 0.0196) or ASD group (P = 0.0487) (Fig. 4d).
Relationship between energetic parameters and hemodynamic variables
We evaluated the relationship between energetic parameters obtained from VFM and other echocardiographic parameters (Table 3). ELdia and ELcycle showed significant correlations with tricuspid E/A. KE-RVin correlated significantly with the tricuspid E wave. KE-RVout correlated significantly with RVFAC and TAPSE. EPI-RVin correlated significantly with RVFAC, TAPSE, and tricuspid E wave. EPI-RVout correlated with RVFAC and TAPSE.
Click to view | Table 3. Correlation Between Energetic Parameters and Other Hemodynamic Variables |
Reproducibility
VFM for a total of 10 patients (control group = 4, ASD group = 3, PH group = 3) were analyzed by two independent examiners to evaluate intra- and inter-observer variability (Table 4). The intraclass correlation coefficients (ICCs) for intra- and inter-observer variability were relatively lower for the ELsys than for ELdia and ELcycle. ICCs for intra- and inter-observer variability were relatively higher for KE-RVin and KE-RVout than EL and EPI parameters. Bland-Altman analysis revealed minimal physiological and clinical bias, as well as substantial agreement for reproducibility.
Click to view | Table 4. Intra- and Inter-Observer Reproducibility |
| Discussion | ▴Top |
The present study showed detailed dynamics of blood and vortical flow in the RV during one cardiac cycle using VFM. Further, this study offers the first demonstration of the feasibility of assessing changes in vortex and energetic kinetics in RV pressure and volume overload in children. The majority of the control group demonstrated the sustained presence of two vortices at the septal and anterior leaflets in early diastole, and one vortex at the RV apex to the outflow tract in late diastole. VFM images in normal subjects showed counterclockwise rotating vortex flow below the tricuspid anterior leaflet and clockwise vortex below the septal leaflet in early diastole. In late diastole to isovolumic systole, clockwise rotating vortex flow appeared at the RV apex to the outflow tract location. During the systolic phase, clockwise vortex flow was used to eject from the RV outflow tract to the pulmonary artery. The formation of such vortex flow was observed to efficiently induce smooth ejection from the RV to the pulmonary artery.
Conversely, in almost half of PH cases, no formation of vortical flow below the tricuspid valve was found. This may be related to the lower velocity of RV inflow in the PH group. In the ASD group, the incidence of vortex flow at the septal leaflet of the tricuspid valve was lower than that of the control group. In addition, fewer cases showed vortical flow below the septal leaflet than below the anterior leaflet in the ASD group. The enlarged RV chamber in the ASD group might not be effective for vortex formation. Further, additional ASD shunt flow toward the tricuspid annulus flow might interfere with vortex formation.
In late diastole, a clockwise-rotating vortex was shown in 91% of the control group. In the ASD group, both clockwise and counterclockwise vortices were observed. In the PH group, half of cases had a counterclockwise vortex, and half of cases had no vortex flow at all in this phase. We speculated that clockwise vortex flow is advantageous for smooth ejection toward the pulmonary artery. In cases with RV pressure and volume overload, we thought that vortex flow in the RV might not be effectively utilized. In many cases, formation of a late-diastole clockwise vortex at the apex seems to be established by a change in position of the early-diastole clockwise vortex below the septal leaflet. In the ASD and PH groups, the incidence of a clockwise vortex at the septal leaflet was lower than that in the control group. This might be why the clockwise vortex in late diastole was less frequently seen in the ASD and PH groups. A counterclockwise vortex at the anterior leaflet was dominant in these groups. We considered that, for this reason, vortex flow at the RV apex during late diastole to isovolumic systole was counterclockwise. Cases were also noted in which uniform vortex flow was not observed at this time phase. In contrast to the left ventricle, in which vortex formation contributes to the redirection of blood flow and the efficiency of ejection [22, 23], intraventricular RV flow has been reported to be relatively streamlined, following a smooth curved septal path from the inlet to outlet channels [4, 24, 25]. Previous reports have demonstrated that RV geometry theoretically allows for easy intraventricular transit of blood that does not require sustained vortex formation [4, 24, 25]. RV flow during systole and diastole therefore appears largely streamlined. Only transient vortex rings reportedly develop below the tricuspid orifice and dissipate quickly. However, our investigation first confirmed that efficient vortex flow is observed in the RV cavity. Further, in cases with RV pressure and volume overload, the direction and rate of formation of vortical flow in the right ventricle were altered, affecting effective ejection. We have no data to show that as the vortex decreases, the ejection of blood decreases. Whether there is a proportional relationship between vortex flow and blood ejection, and whether this can be quantified, has not been clearly demonstrated in this study. Further study would be necessary in future.
Diastolic and single cardiac cycle EL (ELdia and ELcycle, respectively) were significantly elevated in the PH group. However, no significant difference in systolic EL was evident between the three groups. Diastolic blood flow turbulence might be prone to arise and dominate compared to the systolic phase in RV dynamics. KE-RVin and KE-RVout were significantly lower in the PH group. Further, EPI-RVin and EPI-RVout were also significantly lower in the PH group. On the other hand, these parameters in the ASD group were higher compared with the control group, although no significant differences were shown. These results indicate that RV pressure overload would have more influence on RV blood flow KE than volume overload. However, these results might derive from the selection and differences in severity between the ASD and PH groups.
In several articles regarding RV functional assessment using VFM, four-chamber view images were used for the observation of flow dynamics and vortices in the right ventricle [3, 5]. The present study evaluated VFM with sectional images in which the RV inflow tract, apex, and RV outflow tract can be observed in a single cross-section. Since echocardiographic VFM evaluation is performed in a two-dimensional image, we considered that the cross-sectional image, in which the main dominant blood flow from the inflow to the outflow tract can be observed, should be selected for the observation of vortical flow, calculation of EL, and evaluation of mechanical considerations. Although we considered this as the most appropriate cross-sectional view to discern the dominant intraventricular RV flow, the most suitable echocardiographic view and appropriate methods need to be confirmed for RV VFM analysis. Comparison with results from four-dimensional flow cardiovascular magnetic resonance is therefore needed [26, 27].
The present study demonstrated that diastolic and cycle EL correlated negatively with tricuspid E/A. KE-RVin correlated positively with the tricuspid E wave. These results indicate that diastolic function might be related to these parameters. Further, KE-RVout, EPI-RVin and EPI-RVout correlated with values of RVFAC and TAPSE. These results might show parameters indicating RV systolic function. Detailed relationships between these energetic parameters and hemodynamic indices need to be elucidated in a study of a large group of patients.
Study limitations
The sample cohort was relatively small, but we compared VFM images and parameters between patient groups and healthy, age-matched individuals, revealing distinctive differences in each group. Obtaining appropriate echocardiographic images was difficult, and since RV VFM analysis requires the entirety of the RV free wall, this may be challenging for patients with significant RV dilation. Additional limitations included inadequate frame rate and the Nyquist limit for appropriate color flow estimation. Lower acquisition frame rates in data would have been less sensitive to rapid changes in blood flow characteristics. In cases of RV pressure and volume overload, the direction and rate of formation of the vortex flow in the RV were altered, with the result that the effective ejection volume was affected. However, there are no data showing that a decrease in vortex decreases blood ejection volume. Whether or not there is a significant correlation between vortex flow and blood ejection was not clearly demonstrated in this study. Further, as VFM is limited by the two-dimensional imaging plane, the measurement of EL and KE do not account for three-dimensional flow turbulence in the RV cavity. This limitation may have diminished some of the correlations between VFM parameters and hemodynamic indices in this study. Lastly, the clinical significance of our findings requires further investigation. Future studies need to focus on the longitudinal evaluation of patients to characterize changes in intracardiac flow dynamics following treatment.
Conclusions
VFM images in normal subjects showed counterclockwise rotating vortex flow below the tricuspid anterior leaflet and clockwise vortex below the septal leaflet in early diastole. In late diastole to isovolumic systole, clockwise rotating vortex flow appeared at the RV apex to the outflow tract location. During the systolic phase, clockwise vortex flow was used to eject from the RV outflow tract to the pulmonary artery. The formation of such vortex flow was observed to efficiently induce smooth ejection from the RV to the pulmonary artery. In the ASD and PH groups, the formation of vortical flow below the tricuspid valve was decreased. Late-diastolic vortices also differed from the control group, with counterclockwise or no vortex flow seen in this phase in these groups. Vortex flow formation changes in the right ventricle have pathological implications. RV vortex formation may be necessary for efficient ejection. EL, KE, and EPI appear potentially applicable to evaluate RV contractility and diastolic function.
Acknowledgments
None to declare.
Financial Disclosure
This research received no specific grant from any funding agency in the public, commercial, or not-for-profit sectors.
Conflict of Interest
No authors have any financial or non-financial interests that are directly or indirectly related to the work submitted for publication.
Informed Consent
Written informed consent for publication was obtained.
Author Contributions
Yasunobu Hayabuchi: supervision, conceptualization, writing the original draft, creating figures and tables. Yukako Hommma: data collection for this project.
Data Availability
The data supporting the findings of this study are available from the corresponding author upon reasonable request.
Abbreviations
ASD: atrial septal defect; EL: energy loss; EPI: energetic performance index; KE: kinetic energy; LV: left ventricle; LVEDD: left ventricular end-diastolic dimension; LVEF: left ventricle ejection fraction; PH: pulmonary hypertension; RA: right atrium; RV: right ventricle, RVFAC, RV factional area change; VFM: vector flow mapping
| References | ▴Top |
- Hong GR, Kim M, Pedrizzetti G, Vannan MA. Current clinical application of intracardiac flow analysis using echocardiography. J Cardiovasc Ultrasound. 2013;21(4):155-162.
doi pubmed - Itatani K. When the blood flow becomes bright. Eur Heart J. 2014;35(12):747-752a.
pubmed - Meyers B, Nyce J, Zhang J, Frank LH, Balaras E, Vlachos PP, Loke YH. Intracardiac Flow Analysis of the Right Ventricle in Pediatric Patients With Repaired Tetralogy of Fallot Using a Novel Color Doppler Velocity Reconstruction. J Am Soc Echocardiogr. 2023;36(6):644-653.
doi pubmed - Fredriksson AG, Zajac J, Eriksson J, Dyverfeldt P, Bolger AF, Ebbers T, Carlhall CJ. 4-D blood flow in the human right ventricle. Am J Physiol Heart Circ Physiol. 2011;301(6):H2344-2350.
doi pubmed - Chen Z, Li Y, Li C, Tang H, Wang H, Zhong Y, Cai Y, et al. Right ventricular dissipative energy loss detected by vector flow mapping in children: characteristics of normal values. J Ultrasound Med. 2019;38(1):131-140.
doi pubmed - Davlouros PA, Niwa K, Webb G, Gatzoulis MA. The right ventricle in congenital heart disease. Heart. 2006;92(Suppl 1):i27-38.
doi pubmed - Voelkel NF, Quaife RA, Leinwand LA, Barst RJ, McGoon MD, Meldrum DR, Dupuis J, et al. Right ventricular function and failure: report of a National Heart, Lung, and Blood Institute working group on cellular and molecular mechanisms of right heart failure. Circulation. 2006;114(17):1883-1891.
doi pubmed - Jurcut R, Giusca S, La Gerche A, Vasile S, Ginghina C, Voigt JU. The echocardiographic assessment of the right ventricle: what to do in 2010? Eur J Echocardiogr. 2010;11(2):81-96.
doi pubmed - Lang RM, Bierig M, Devereux RB, Flachskampf FA, Foster E, Pellikka PA, Picard MH, et al. Recommendations for chamber quantification. Eur J Echocardiogr. 2006;7(2):79-108.
doi pubmed - Selton-Suty C, Juilliere Y. Non-invasive investigations of the right heart: how and why? Arch Cardiovasc Dis. 2009;102(3):219-232.
doi pubmed - Sheehan F, Redington A. The right ventricle: anatomy, physiology and clinical imaging. Heart. 2008;94(11):1510-1515.
doi pubmed - Hsiao A, Lustig M, Alley MT, Murphy M, Chan FP, Herfkens RJ, Vasanawala SS. Rapid pediatric cardiac assessment of flow and ventricular volume with compressed sensing parallel imaging volumetric cine phase-contrast MRI. AJR Am J Roentgenol. 2012;198(3):W250-259.
doi pubmed - Hsiao A, Alley MT, Massaband P, Herfkens RJ, Chan FP, Vasanawala SS. Improved cardiovascular flow quantification with time-resolved volumetric phase-contrast MRI. Pediatr Radiol. 2011;41(6):711-720.
doi pubmed - Nordmeyer S, Riesenkampff E, Crelier G, Khasheei A, Schnackenburg B, Berger F, Kuehne T. Flow-sensitive four-dimensional cine magnetic resonance imaging for offline blood flow quantification in multiple vessels: a validation study. J Magn Reson Imaging. 2010;32(3):677-683.
doi pubmed - Rudski LG, Lai WW, Afilalo J, Hua L, Handschumacher MD, Chandrasekaran K, Solomon SD, et al. Guidelines for the echocardiographic assessment of the right heart in adults: a report from the American Society of Echocardiography endorsed by the European Association of Echocardiography, a registered branch of the European Society of Cardiology, and the Canadian Society of Echocardiography. J Am Soc Echocardiogr. 2010;23(7):685-713.
doi pubmed - Itatani K, Okada T, Uejima T, Tanaka T, Ono M, Miyaji K, Takenaka K. Intraventricular flow velocity vector visualization based on the continuity equation and measurements of vorticity and wall shear stress. Jpn J Appl Phys. 2013;52:07HF16.
- Honda T, Itatani K, Takanashi M, Kitagawa A, Ando H, Kimura S, Oka N, et al. Exploring energy loss by vector flow mapping in children with ventricular septal defect: Pathophysiologic significance. Int J Cardiol. 2017;244:143-150.
doi pubmed - Honda T, Itatani K, Miyaji K, Ishii M. Assessment of the vortex flow in the post-stenotic dilatation above the pulmonary valve stenosis in an infant using echocardiography vector flow mapping. Eur Heart J. 2014;35(5):306.
doi pubmed - Kainuma A, Akiyama K, Naito Y, Hayase K, Hongu H, Itatani K, Yamagishi M, et al. Energetic performance index improvement after Glenn and Damus-Kaye-Stansel procedure using vector flow mapping analysis: a case report. JA Clin Rep. 2020;6(1):5.
doi pubmed - Akiyama K, Maeda S, Matsuyama T, Kainuma A, Ishii M, Naito Y, Kinoshita M, et al. Vector flow mapping analysis of left ventricular energetic performance in healthy adult volunteers. BMC Cardiovasc Disord. 2017;17(1):21.
doi pubmed - Nakashima K, Itatani K, Kitamura T, Oka N, Horai T, Miyazaki S, Nie M, et al. Energy dynamics of the intraventricular vortex after mitral valve surgery. Heart Vessels. 2017;32(9):1123-1129.
doi pubmed - Abe H, Caracciolo G, Kheradvar A, Pedrizzetti G, Khandheria BK, Narula J, Sengupta PP. Contrast echocardiography for assessing left ventricular vortex strength in heart failure: a prospective cohort study. Eur Heart J Cardiovasc Imaging. 2013;14(11):1049-1060.
doi pubmed - Sherrid MV, Kushner J, Yang G, Ro R. Mitral valve coaptation and its relationship to late diastolic flow: A color Doppler and vector flow map echocardiographic study in normal subjects. Echocardiography. 2017;34(4):537-548.
doi pubmed - Sengupta PP, Narula J. RV form and function: a piston pump, vortex impeller, or hydraulic ram? JACC Cardiovasc Imaging. 2013;6(5):636-639.
doi pubmed - Eriksson J, Carlhall CJ, Dyverfeldt P, Engvall J, Bolger AF, Ebbers T. Semi-automatic quantification of 4D left ventricular blood flow. J Cardiovasc Magn Reson. 2010;12(1):9.
doi pubmed - Elsayed A, Gilbert K, Scadeng M, Cowan BR, Pushparajah K, Young AA. Four-dimensional flow cardiovascular magnetic resonance in tetralogy of Fallot: a systematic review. J Cardiovasc Magn Reson. 2021;23(1):59.
doi pubmed - Hirtler D, Garcia J, Barker AJ, Geiger J. Assessment of intracardiac flow and vorticity in the right heart of patients after repair of tetralogy of Fallot by flow-sensitive 4D MRI. Eur Radiol. 2016;26(10):3598-3607.
doi pubmed
This article is distributed under the terms of the Creative Commons Attribution Non-Commercial 4.0 International License, which permits unrestricted non-commercial use, distribution, and reproduction in any medium, provided the original work is properly cited.
Cardiology Research is published by Elmer Press Inc.