| Cardiology Research, ISSN 1923-2829 print, 1923-2837 online, Open Access |
| Article copyright, the authors; Journal compilation copyright, Cardiol Res and Elmer Press Inc |
| Journal website https://cr.elmerpub.com |
Original Article
Volume 16, Number 2, April 2025, pages 120-129

Computer-Assisted Electrocardiogram Analysis Improves Risk Assessment of Underlying Atrial Fibrillation in Cryptogenic Stroke
Dafne Viliania, Alberto Cecconib, j, Miguel Angel Spinola Tenac, Alberto Verab, Alvaro Ximenez-Carrillod, Carmen Ramosd, Pablo Martinez-Vivesb, e, Beatriz Lopez-Melgarb, Alvaro Montes Munizb, Clara Aguirred, Jose Vivancosd, Guillermo Ortegac, f, g, j, Fernando Alfonsob, h, i, Luis Jesus Jimenez-Borreguerob, h, i
aCardiology Department, Ospedale Santa Chiara, Trento, Italy
bCardiology Department, Hospital Universitario de La Princesa, Universidad Autonoma de Madrid, Madrid, Spain
cData Analysis Unit, Instituto de Investigacion Sanitaria, Hospital Universitario de la Princesa, Madrid, Spain
dStroke Center, Neurology Department, Hospital Universitario de La Princesa, Universidad Autonoma de Madrid, IIS-IP, Madrid, Spain
eCardiology Department, Hospital Universitario Ramon y Cajal, Madrid, Spain
fConsejo Nacional de Investigaciones Cientificas y Tecnicas, CONICET, Buenos Aires, Argentina
gScience and Technology Department, National University of Quilmes, Quilmes, Argentina
hIIS-IP, CIBER-CV, Madrid, Spain
iThese two authors contributed to the present work equally.
jCorresponding Author: Guillermo Ortega, Data Analysis Unit, Instituto de Investigacion Sanitaria, Hospital Universitario de la Princesa, Madrid, Spain; Alberto Cecconi, Cardiology Department, Hospital Universitario de La Princesa, Madrid, Spain
Manuscript submitted November 26, 2024, accepted January 16, 2025, published online February 6, 2025
Short title: Computer-Assisted ECG Analysis in CS
doi: https://doi.org/10.14740/cr2016
| Abstract | ▴Top |
Background: The detection of underlying paroxysmal atrial fibrillation (AF) in patients with cryptogenic stroke (CS) can be challenging, and there is great interest in finding predictors of its hidden presence. The recent development of sophisticated software has enhanced the diagnostic and prognostic performance of the 12-lead electrocardiogram (ECG). Our aim was to assess the additional role of a computer-assisted ECG analysis in identifying predictors of AF in patients with CS.
Methods: Sixty-seven patients with ischemic stroke or high-risk transient ischemic attack of unknown etiology were prospectively studied. Their 12-lead digitized ECG was analyzed with dedicated software, quantifying 468 morphological variables. The main clinical, biochemical, and echocardiographic variables were also collected. At discharge, patients were monitored with a wearable Holter for 15 days, and the primary outcome was the detection of AF.
Results: The median age was 80 (interquartile range (IQR): 73 - 84) and AF was detected in 21 patients (31.3%). After preselecting significant ECG variables from the univariate analysis, a multivariate regression including other significant clinical, biochemical and echocardiographic predictors of AF was performed. Among the automatically analyzed ECG parameters, the amplitude of the R wave in V1 (V1_ramp) was significantly associated with the outcome. The best model to predict AF was composed of age, N-terminal B-type natriuretic peptide (NT-proBNP), left atrial reservoir strain (LASr) and V1_ramp. This model showed good discrimination capacity (corrected Somer’s Dxy: 0.907, Brier’s B: 0.079, area under the curve (AUC): 0.941) and performed better than the same model without the ECG variable (Somer’s Dxy: 0.827, Brier’s B: 0.119, AUC: 0.896).
Conclusions: The addition of computer-assisted ECG analysis can help stratify the risk of AF in the challenging clinical setting of CS.
Keywords: Computer-assisted ECG analysis; Paroxysmal atrial fibrillation; Cryptogenic stroke
| Introduction | ▴Top |
Stroke is a major public health problem worldwide and a leading cause of death and disability [1]. Cryptogenic stroke (CS), or stroke of undetermined etiology, can represent up to 30% of ischemic strokes (IS), and is defined, following the TOAST and SSS-TOAST criteria, as an IS that is not attributable to one definite cause despite a thorough diagnostic assessment [2, 3]. Through prolonged ambulatory monitoring techniques, atrial fibrillation (AF) can be detected in up to 30% of these patients [4, 5]. Therefore, identifying the markers of an underlying paroxysmal AF in this population is of primary importance to implement an optimal monitoring strategy and an adequate therapy in secondary prevention [6]. In this setting, different clinical and instrumental predictors of AF have been investigated. Recently, our group proposed a comprehensive score (the Decryptoring Score), which uses clinical, echocardiographic and biochemical markers of atrial dysfunction to predict the incidence of AF in patients with CS [5]. In that study, no electrocardiogram (ECG) parameters obtained with a conventional analysis proved to be significantly associated with the presence of a hidden AF. Nevertheless, in the last years, sophisticated software analyses have been developed, which allow the quantification of hundreds of variables, with the potential to expand the information obtained by the conventional manual approach, and to increment the diagnostic and prognostic performance of the ECG [7-10]. With these premises, the main aim of our study was, therefore, to assess the potential adjunctive role of a computer-assisted ECG analysis, in the context of a comprehensive diagnostic approach, to identify biomarkers of atrial disfunction and to stratify the risk of AF in patients with CS.
| Materials and Methods | ▴Top |
Study population
This study prospectively included all consecutive patients aged over 60, who were admitted to the Stroke Unit of our university hospital between April 2019 and April 2022, with an established diagnosis of IS or transient ischemic attack (TIA) with an ABCD2 scale ≥ 4 [11]. After the required systematic and exhaustive complementary studies, conducted according to our center’s protocol (center accredited by the European Stroke Organization as “Stroke Center”), these patients were initially classified as CS.
Exclusion criteria were as follows: patients aged less than 60; the presence of an exclusive etiology defined according to the SSS-TOAST criteria [3], such as lacunar infarct, atherothrombotic stroke, or rare causes of stroke (dissection, vasculitis, vasospasm); previous AF or AF detected within the first 48 h after admission; moderate and severe mitral stenosis; apical aneurism and patent foramen ovale with deep venous thrombosis and pulmonary embolism documentation.
AF detection
During admission, all patients underwent continuous ECG monitoring for at least 48 h, which was evaluated by the stroke neurologist at the workstation of the Stroke Unit, which is equipped with a dedicated AF detection software (PhilipsTM). In addition, at discharge, following our prospective protocol, all patients were monitored with a wearable Holter device (NuuboTM) for 15 days. The evaluation of the Holter registry was performed by an external CoreLab blinded to the study investigators. AF was defined according to the current European Society of Cardiology (ESC) guidelines as the presence of more than 30 s of a heart rhythm with no P waves and irregular RR intervals [12]. AF occurrence was the primary outcome measure of this study.
Clinical assessment, ECG and echocardiography
The baseline demographics and vascular risk factors of every patient, as well as the characteristics of the stroke, the clinical severity measured by the National Institute of Health Stroke Scale (NIHSS), and the treatment in the acute phase, were prospectively assessed. Blood samples, including highly sensitive T troponin (TNT) and N-terminal B-type natriuretic peptide (NT-proBNP) in the first 72 h of admission, were also collected.
Computer-assisted ECG analysis
For each patient, a 12-lead ECG, digitally stored in XML format, performed in a time-lapse of 10 days before or after the admission to hospital, was selected. Every ECG was automatically analyzed by the Philips DXL algorithm, yielding a total of 468 distinct morphological variables (39 in each lead), which quantify, among other aspects, the amplitudes, durations, areas and shapes of each wave and segment in every lead. The definition of the main variables according to Philips nomenclature is described here (Supplementary Material 1, cr.elmerpub.com). A graphical example of some of the ECG variables quantified by the Philips algorithm is depicted in Figure 1. A manual ECG analysis was also previously performed by an expert cardiologist, who collected conventional ECG variables, such as the amplitude of the P wave, the presence of interatrial block, the duration and morphology of the QRS complex, and the duration of the PR and QT intervals.
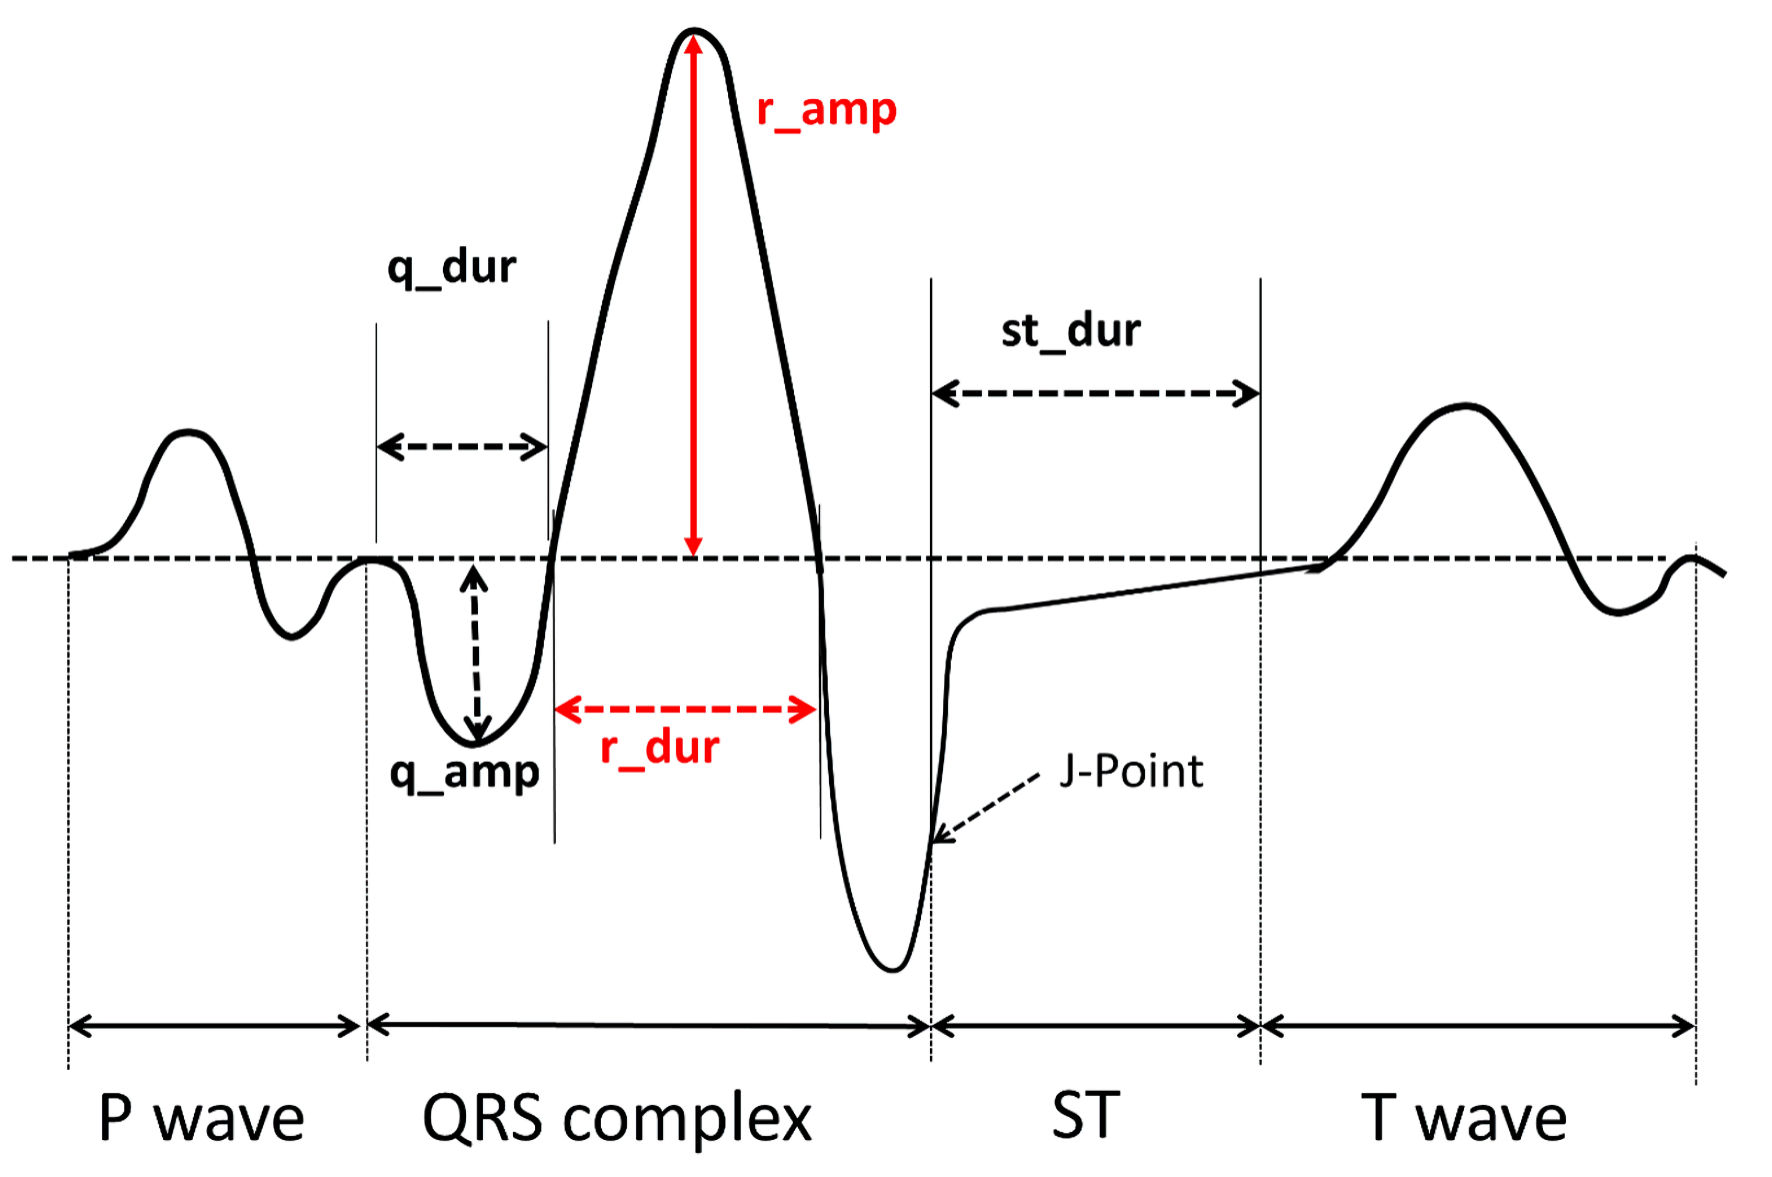 Click for large image | Figure 1. Graphic example of some of the relevant ECG variables quantified by the Philips algorithm. ECG: electrocardiogram. |
Transthoracic echocardiography (TTE)
All patients underwent TTE at the same time as the ECG was performed. All studies were accomplished with the same ultrasound system (Philips EPIQ 7), and measurements were executed according to current guidelines [13, 14] by the same certified expert in echocardiography.
Left atrium diastolic volume (LADV) was obtained by Simpson biplane disk summation method. For each patient, the LADV was indexed to the body surface area (BSA) to obtain the indexed LADV (iLADV). Left atrium strain (LAS) analysis was performed with the dedicated atrial software (Philips) from the four-chamber view with a temporal resolution higher than 50 Hz. The left atrial (LA) wall was automatically traced and manually corrected when necessary. Subsequently, the software calculated left atrial reservoir strain (LASr), conduct (LAScd) and contraction (LASct) by speckle tracking analysis using end-diastole as initial reference.
Ethics
The study was approved by the Ethical Committee of Hospital Universitario de La Princesa (7-02-19, acta CEIm 03/19). This study was conducted in compliance with the ethical standards of the responsible institution on human subjects as well as with the Helsinki Declaration. All patients or their relatives provided written informed consent.
Statistical analysis
For each patient, all clinical, biochemical, ECG, and echocardiographic variables were analyzed. In the case of missing values, they were imputed if they represented less than 15% of the total for each predictive variable. On the contrary, predictive variables which had more than 15% of missing values were discarded. Quantitative variables are expressed as median and interquartile range (IQR). Comparison of quantitative variables was performed with non-parametric tests, while qualitative variables were compared by Chi square or Fisher tests, as appropriate. With the aim of studying the association between these variables and the outcome (categorized as the presence or not of AF), a univariate logistic regression was conducted, and predictors with a P < 0.05 were selected. All continuous variables were categorized as binary by calculating the optimal cut points in each case. This categorization procedure was performed considering the relationship between each of the continuous variables and the outcome variable (AF), while maximizing both specificity and sensitivity.
To assess the predictive capacity of automatically analyzed ECG biomarkers, two sets of variables were independently analyzed. One set comprised clinical, biochemical, and echocardiographic variables, while the other set composed the ECG variables obtained by computer-assisted analysis. After performing a univariate analysis on each set, multivariate regressions with the preselected significant variables were independently conducted on each of the two datasets. A final predictive model was thereafter obtained including in the multivariate analysis of clinical, biochemical and echocardiographic variables, the significant ECG predictors. A variance inflation factor (VIF) analysis was performed in each one to exclude collinearities. Only variables with a VIF < 5 were maintained in the model. For the variable selection of the final models, a backward stepwise procedure was carried out to achieve the best combination of predictors, guided by the Akaike Information Criterion (AIC). Size effects were reported as odds ratios (ORs), along with their corresponding confidence intervals (CIs: 2.5% - 97.5%) and associated P values. To assess the goodness of fit of the two nested models (one composing clinical, biochemical, and echocardiographic variables and the other one also including the ECG parameter), a likelihood ratio test was conducted.
Model assessment and predictive capacity
To test the predictive capacity of the two obtained models and considering the reduced number of patients in the sample, a bootstrap model validation was implemented. In doing that, we resampled with replacement 500 times the original data, every one of these could therefore be used as “new” test data, in which the model performance could be evaluated [15]. This validation was performed on both the clinical-biochemical-echocardiographic dataset and on the clinical-biochemical-echocardiographic-ECG one. Several metrics to assess each model’s accuracy and capacity of separating patient’s outcomes were calculated. These included the classical Nagelkerke R2 index (which compares the obtained model to the null one); the Somers’ Dxy (a rank correlation between the response and the predicted probabilities), from which the area under the curve (AUC) of the receiver operating characteristic curve (ROC) can be obtained using the formula (Dxy = 2 × (AUC - 1/2)), and the Brier score (the mean square error of predictions), which estimates the accuracy of probabilistic predictions. The method employed to obtain the best predictive model is resumed in the diagram of Figure 2.
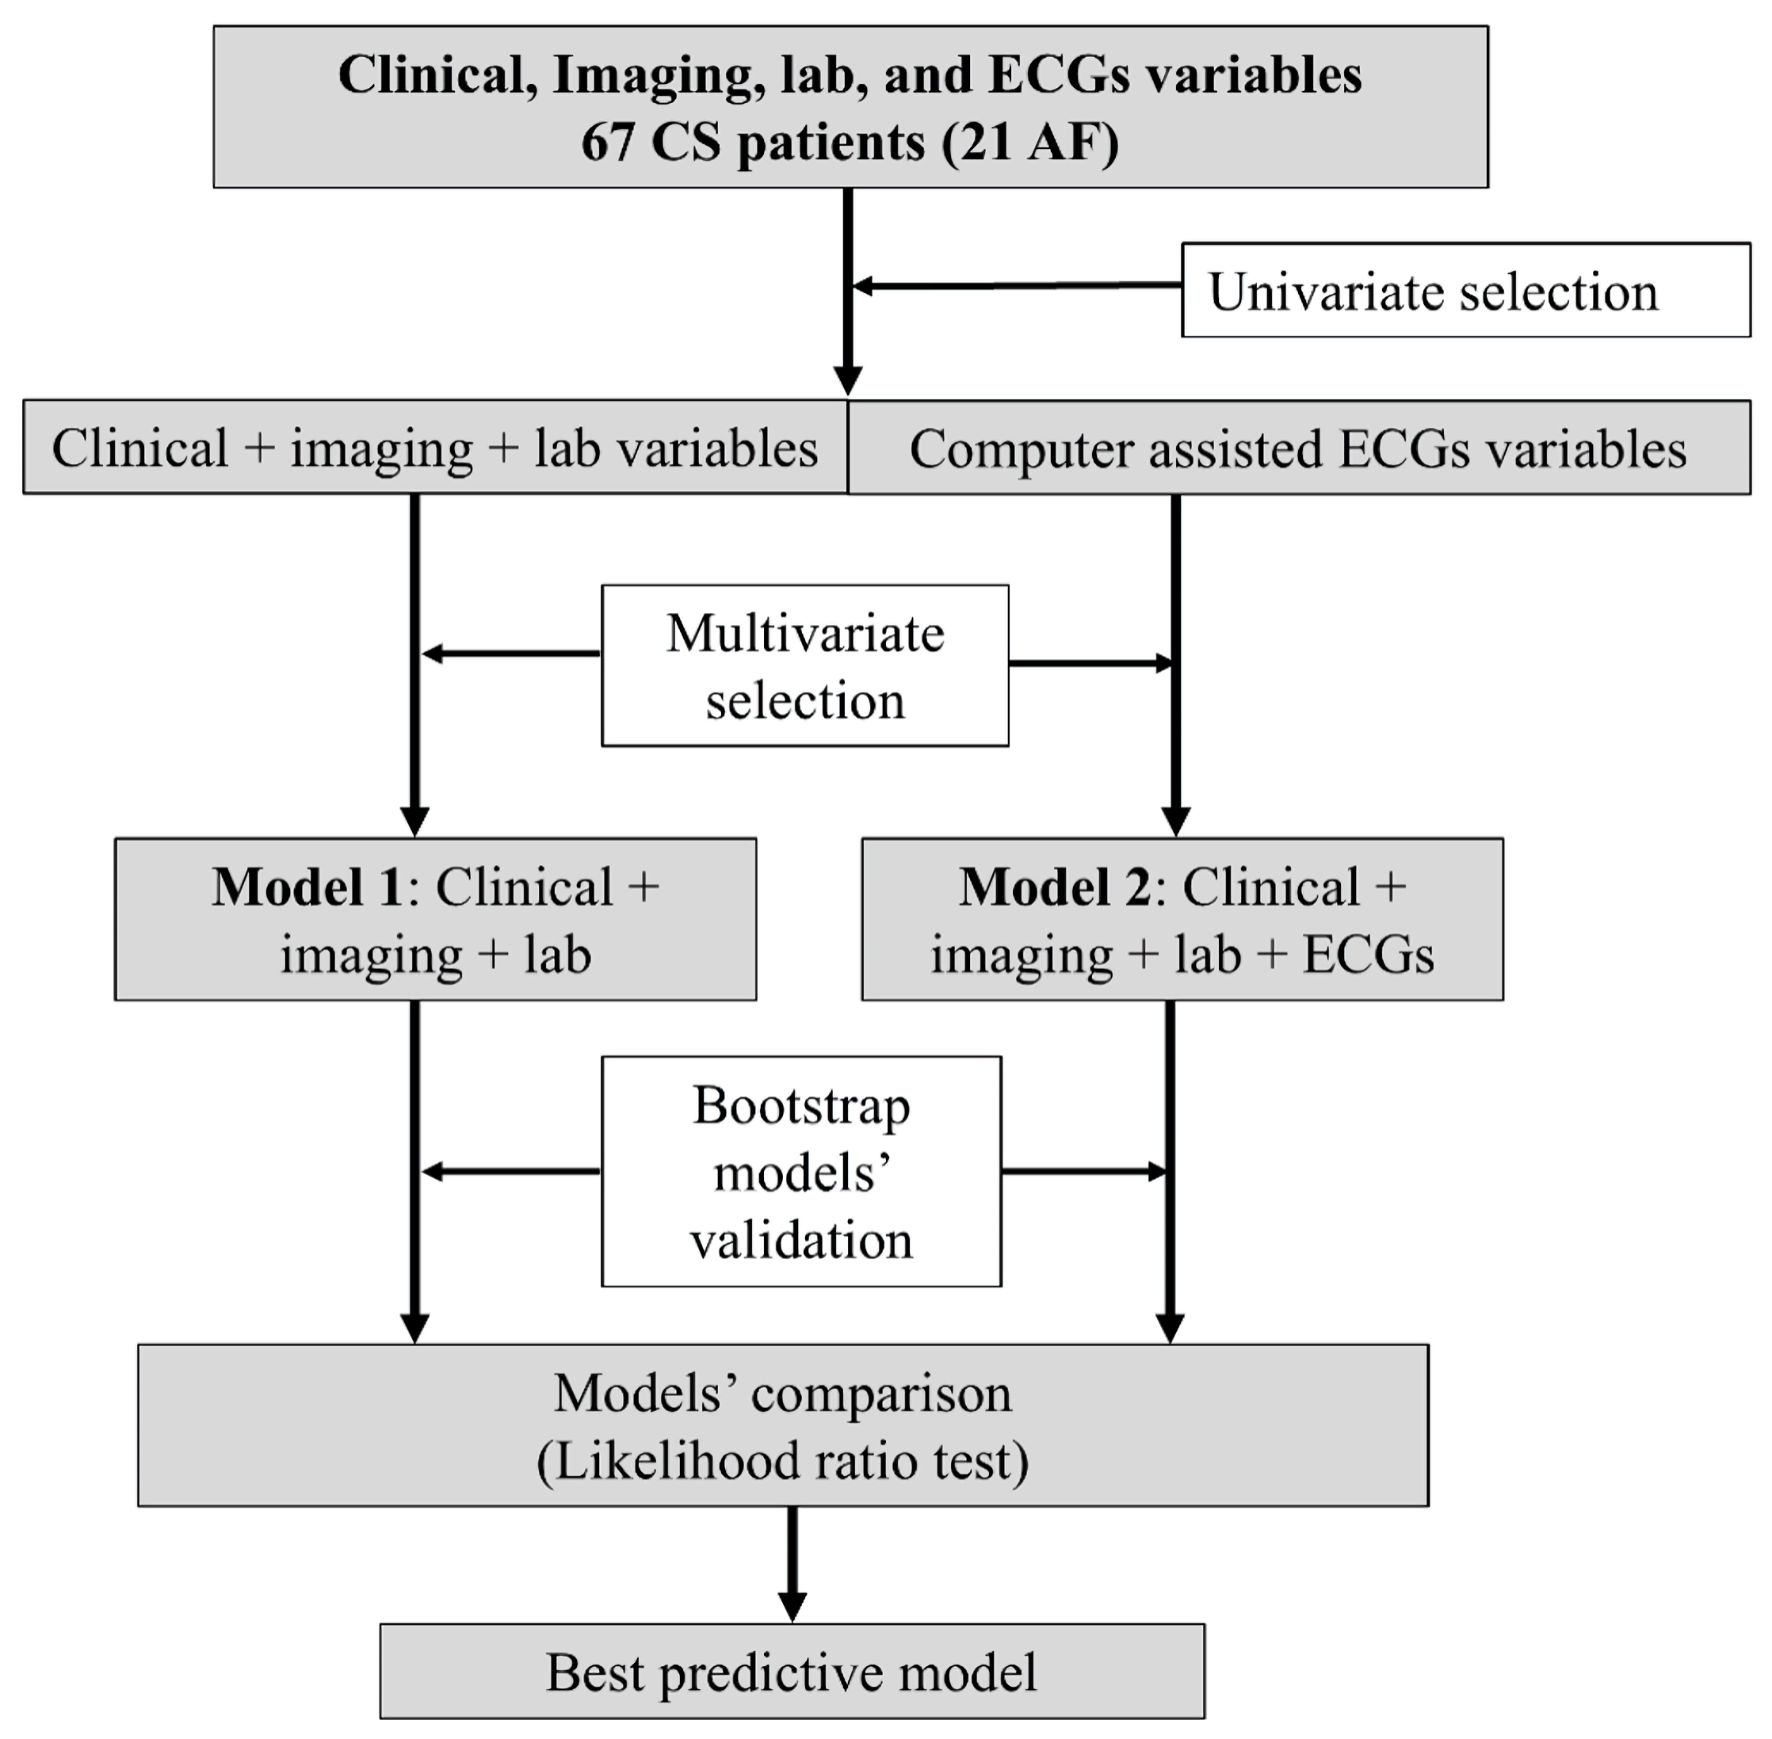 Click for large image | Figure 2. Flow diagram of the methods employed to obtain the final predictive model. CS: cryptogenic stroke; AF: atrial fibrillation; ECG: electrocardiogram. |
Data management, statistical calculations, and graphical visualizations were conducted using the R statistical software through the RStudio Integrated Development Environment (IDE) for R. The particular packages applied were car, caret, compareGroups, cutpointr, DataExplorer, ggplot2, ggpubr, glmnet, Hmisc, MASS, mice, pROC, questionr, rms, and VIM.
| Results | ▴Top |
A total of 105 patients were initially analyzed. From this cohort, 13 patients were excluded for the following reasons: two patients were diagnosed with lung cancer, one patient had a brain tumor, one patient had MELAS syndrome, one patient was diagnosed with a thoracic aneurysm that compressed the left atrium, one patient had essential thrombocythemia, one patient had an atrial septal defect, two patients died before undergoing the scheduled Holter ECG monitoring, and four patients could not be monitored by Holter ECG due to coronavirus disease 2019 (COVID-19)-related lockdown logistic limitations. Of the remaining 92 patients, for the specific aim of this study, 13 were excluded because of problems in the transmission or storage of the ECG in XML format, two were excluded due to the poor quality of the ECG registration, and 10 patients were excluded due to suboptimal echocardiographic window, resulting in a final population of 67 patients. Of these, 21 (31.3%) had at least one episode of AF.
Clinical, biochemical and echocardiographic characteristics
The main clinical, biochemical and echocardiographic characteristics in patients with and without AF are detailed in Table 1. The median age of the population was 80 years (IQR: 73 - 84 years), and the group of patients with AF was significatively older (median age: 83 years (IQR: 78 - 86) vs. 78.5 years (IQR: 71 - 82.8), P = 0.010). Regarding vascular risk factors, patients who developed AF more often had hypertension (81% vs. 50%, P = 0.033), without significant differences in diabetes, dyslipidemia or tobacco consumption. Higher values of TNT (median value: 17.1 ng/L (IQR: 12.0 - 29.0) vs. 12.9 ng/L (IQR: 9.87 - 21.7), P = 0.036) and of NT-proBNP (median value 420 pg/mL (IQR: 305 - 1704) vs. 152 pg/mL (IQR: 66.0 - 372), P < 0.001) were observed in the AF group. On the echocardiogram, patients who developed AF had a greater LADV (median values: 65 mL (IQR: 47 - 77) vs. 47 mL (IQR: 37 - 55.8), P = 0.012) and iLADV (median value 37.8 mL (IQR: 27.7 - 42) vs. 27.5 mL (IQR 21.2 - 33), P = 0.008). LASr was significantly lower in patients with AF (16.9% (IQR: 13.9 - 21.8) vs. 31.1% (IQR: 26.9 - 37.6), P < 0.001). There were no significant differences in left atrial ejection fraction (LAEF), left ventricle (LV) volumes and left ventricular ejection fraction (LVEF) measured by biplane Simpson method. The 10 s 12-lead ECG of each patient was visually analyzed by an expert cardiologist, and no significant differences were observed among the two groups for conventional ECG parameters such as P wave voltage, presence of interatrial block, PR and QT interval, and QRS duration.
 Click to view | Table 1. Clinical, Biochemical, Echocardiographic and Manually Assessed ECG Baseline Characteristics |
Stroke characteristics according to AF detection
Regarding stroke characteristics, there were no differences in the percentage of TIA between groups or in the NIHSS score on admission and at discharge.
ECG predictors of AF obtained by computer-assisted ECG analysis
The values of the main variables obtained after performing a computerized analysis of the 12-lead ECG in the group of patients with and without AF, are described in full details here (Supplementary Material 2, cr.elmerpub.com). After performing a univariate analysis (P < 0.05), patients with AF presented a greater amplitude of the R wave in V1 (V1_ramp) and in V4 (V4_ramp), a shorter duration of the q wave in lead aVR (aVR_qdur), a longer duration of the q wave in lead I (I_qdur), a greater duration of the R wave in lead aVR (aVR_rdur), a greater amplitude of the q wave in lead aVL (aVL_qamp) and a greater duration of the ST segment in lead I (I_stdur). VIF values were calculated for each variable, and a minimum of 1.1, a maximum of 1.79 and a mean VIF value of 1.32 were obtained. After performing a multivariate analysis to achieve the best combination of predictors, guided by the AIC, only V1_ramp (OR: 2.95, CI 2.5-97.5%: 0.96 - 9.49, P value: 0.062) and aVR_rdur (OR: 5.41, CI 2.5-97.5%: 1.51 - 25.90, P value: 0.016) persisted in the predictive model. The cutoffs for these variables were 137 µV for V1_ramp and 18 ms for aVR_rdur.
These variables are depicted in Figure 1, and those finally selected by the AIC are highlighted in red.
Clinical, biochemical and echocardiographic model to predict AF
After performing a univariate analysis with the clinical, echocardiographic and biochemical variables, a multivariate regression with the preselected significant predictors was performed. A final predictive model was obtained, in which NT-proBNP (cutoff: 203.5 ng/dL), LASr (cutoff 23.3%) and age (cutoff 76 years) were included. The OR and P values for each variable of the model are shown in Table 2.
Click to view | Table 2. Predictive Model Including Clinical, Echocardiographic and Biochemical Variables |
Clinical, biochemical, echocardiographic, and ECG model to predict AF
After including the significant ECG predictors (V1_ramp and aVR_rdur) previously obtained, in the multivariate analysis of clinical, biochemical and echocardiographic variables, the final predictive model resulted to be: (AF predicted by: age + NT-proBNP + LASr + V1_ramp). The OR and P values for each variable of this model are shown in Table 3.
Click to view | Table 3. Final Predictive Model Including Clinical, Echocardiographic Biochemical and ECG Variables |
Validation and comparison of the two models
The main metrics obtained for the final model (AF predicted by: age + NT-proBNP + LASr + V1_ramp) after performing a bootstrapping validation confirmed a very good discrimination capacity (corrected Somer’s Dxy: 0.907, Brier’s B: 0.079, AUC: 0.941). The same validation procedure was applied to the model, after excluding the ECG variable (AF predicted by: age + NT-proBNP + LASr), to evaluate whether its presence provided relevant additional information, and slightly worse results were obtained in this case (Somer’s Dxy: 0.827, Brier’s B: 0.119, AUC: 0.896). Finally, the two models were compared with a likelihood ratio test (P = 0.011), demonstrating a better capacity of explaining the data by including the ECG variable in the model.
| Discussion | ▴Top |
We sought to perform an extensive computer-assisted ECG analysis in a population of patients with CS, in order to identify potential ECG predictors of AF in the long-term monitorization through machine learning techniques.
In fact, in recent years, thanks to the development of sophisticated software, we have witnessed a notable expansion of the diagnostic and prognostic power of ECG, which allows the immediate extraction and quantification of hundreds of ECG variables, to predict cardiac outcomes [16], including AF development [7, 17]. In the context of CS, nevertheless, the evidence regarding ECG predictors of AF derives from a limited number of studies which addressed the capability of specific ECG parameters obtained by conventional analysis, to predict the presence of hidden AF. These parameters include the duration, morphology, voltage and axis of the P wave, and the presence of inter-atrial block [18-20]. Artificial intelligence was applied in this setting by Rabinstein et al, allowing to predict the presence of AF on prolonged ECG monitoring by the analysis of the basal ECG in patients with embolic stroke of unknown etiology (ESUS) [21]. Nevertheless, in that study a convolutional neural network (CNN) model was implemented, so it is not possible to obtain information on the discriminatory value of specific ECG variables.
Predictive value of ECG biomarkers
Using the data extracted by our automatic ECG analysis software, which measured over 400 ECG variables, seven biomarkers proved to be associated with AF in the univariate analysis. Nevertheless, after a multivariate analysis including also clinical, biochemical and echocardiographic parameters, only the presence of an R wave in V1 > 137 µV (0.137 mV) resulted significantly related to the outcome.
A tall R wave in V1 can be due to many diverse causes, which have been in different ways associated with AF, as right bundle branch block (RBBB), right ventricle hypertrophy, posterior wall myocardial infarction, Wolff-Parkinson-White pattern and hypertrophic cardiomyopathy [22].
More in detail, regarding the relationship between bundle branch block (BBB) and AF, contrasting results have been observed. Khan et al analyzed a large database of patients and observed that the prevalence of AF was greater in the group with BBB, and that AF was comparatively more associated to RBBB than to left BBB (LBBB) [23]. Moreover, a significant association between RBBB and the presence of AF has been described in a cohort of hospitalized patients [24], and RBBB has been found to be a predictor of late AF recurrence after pulmonary vein ablation [25]. On the other hand, no significant association between the presence of RBBB and AF was observed in a large prospective cardiovascular study including more than 18,000 residents in Copenhagen [26]. In our population, when manually analyzing the ECGs, no statistically significant differences were observed among the two groups.
Interestingly, Nielsen et al [27] found a significant relationship between lone AF and incomplete RBBB, defined as the presence of an RSr’ or RSR’ configuration in leads V1 or V2 and a QRS interval < 120 ms in leads I, II, III, aVL, and aVF. Similar results were obtained by Frontera et al, who observed that the presence of an incomplete RBBB was significantly associated with the presence of AF in a loop recorder monitorization [28].
On the other hand, Chatterjee et al [29] found that an increased right ventricle (RV) mass measured on cardiac magnetic resonance (CMR) was associated with the presence of AF in a multiethnic cohort free of cardiovascular disease at baseline (MESA study). The authors considered that these data raise the possibility of RV morphology as a structural biomarker of AF risk. In fact, in MESA participants, abnormal RV morphology has been linked to subclinical left ventricle dysfunction, conditions associated with abnormal pulmonary vascular function (obesity and emphysema), and biomarkers of inflammation and neurohormonal activation. In turn, the authors highlighted that each of these features was implicated in the pathogenesis of AF.
In the specific setting of CS, previous studies have described a significant association between AF and a prolonged PR interval [30], an increased duration of the P wave, and the presence of interatrial block [18, 20]. Interestingly, in our study, no parameters related to the duration of the P wave and the PR interval were significantly associated with the outcome. We cannot exclude that this finding could be partly due to the limited number of patients of our sample, or to a minor variability of the software in analyzing the variables related to the QRS complex in comparison to the P wave.
Clinical, biochemical and echocardiographic predictors of AF
With the perspective of maintaining a comprehensive approach to predict AF in patients with CS, on top of the ECG variables, we also analyzed clinical, echocardiographic and biochemical potential markers of this arrhythmia. After a multivariate analysis of all these parameters, an older age, a higher NT-proBNP and a lower LASr were included in the final model. These results are in keeping with the available literature and with our previous experiences [5, 31, 32]. The fact that among them LASr showed the greatest predictive value, reinforces the idea that markers of atrial structural and functional remodeling are important surrogate predictors of hidden AF in patients with stroke of unknown etiology [33].
Final models and adjunctive value of a computer-assisted ECG analysis
The final predictive model obtained after analyzing the clinical, biochemical, echocardiographic and automatically obtained ECG variables of our population (AF predicted by: age + NT-proBNP + LASr + V1_ramp), showed a very good discrimination capacity. Interestingly the metrics for this model (among which the Brier’s B, which is considered especially useful for model comparison [34]) and the AUC of the ROC were slightly better than the metrics for the same model after excluding the amplitude of the R wave in V1 lead (AF predicted by: age + NT-proBNP + LASr), and the difference were statistically significant. These results support the potential incremental value of an automatized ECG analysis in this context, even though they will need to be validated in larger cohorts of patients.
Limitations
Our study has some limitations, the main ones being related to the small sample of our population and the significant number of patients excluded from the analysis. Nevertheless, these were consecutive patients studied under the strict prospective and systematic diagnostic protocol of our center (which is accredited by the European Stroke Organization as “Stroke Center”), and therefore were fully characterized from a clinical standpoint. Further evidence will be useful to confirm our preliminary results, which should be considered exploratory and hypothesis-generating.
Conclusions
Taken altogether, our findings confirm the importance of a comprehensive approach to predict the risk of AF in patients with CS and suggest that adding a computer-assisted ECG analysis in this population can be useful.
| Supplementary Material | ▴Top |
Suppl 1. Definition of the main ECG variables according to Philips nomenclature.
Suppl 2. Values of the main variables obtained after performing a computerized analysis in the group of patients with and without AF.
Acknowledgments
None to declare.
Financial Disclosure
The authors received a research grant from the Carlos III Institute of Health under the health strategy action 2020 - 2022 with reference PI20/00792.
Conflict of Interest
None to declare.
Informed Consent
All patients or their relatives provided written informed consent.
Author Contributions
DV, AC, AV, AX, GO, LJ: conceptualization and protocol design. DV, AC, AV, AX, CR, CA: data collection. DV, AC, MS, AV, AX, CR, PM, BL, AM, CA, JV, GO, FA, LJ: critical review of the manuscript drafts. MS, GO: data analysis. DV, AC, MS, GO, FA, LJ: assistance with data interpretation. DV, AC, GO, JL: writing the original draft.
Data Availability
Any inquiries regarding supporting data availability of this study should be directed to the corresponding author.
| References | ▴Top |
- Doehner W, Mazighi M, Hofmann BM, Lautsch D, Hindricks G, Bohula EA, Byrne RA, et al. Cardiovascular care of patients with stroke and high risk of stroke: The need for interdisciplinary action: A consensus report from the European Society of Cardiology Cardiovascular Round Table. Eur J Prev Cardiol. 2020;27(7):682-692.
doi pubmed - Adams HP, Jr., Bendixen BH, Kappelle LJ, Biller J, Love BB, Gordon DL, Marsh EE, 3rd. Classification of subtype of acute ischemic stroke. Definitions for use in a multicenter clinical trial. TOAST. Trial of Org 10172 in Acute Stroke Treatment. Stroke. 1993;24(1):35-41.
doi pubmed - Ay H, Furie KL, Singhal A, Smith WS, Sorensen AG, Koroshetz WJ. An evidence-based causative classification system for acute ischemic stroke. Ann Neurol. 2005;58(5):688-697.
doi pubmed - Sanna T, Diener HC, Passman RS, Di Lazzaro V, Bernstein RA, Morillo CA, Rymer MM, et al. Cryptogenic stroke and underlying atrial fibrillation. N Engl J Med. 2014;370(26):2478-2486.
doi pubmed - Vera A, Cecconi A, Ximenez-Carrillo A, Ramos C, Martinez-Vives P, Lopez-Melgar B, Sanz-Garcia A, et al. A comprehensive model to predict atrial fibrillation in cryptogenic stroke: the decryptoring score. J Stroke Cerebrovasc Dis. 2022;31(1):106161.
doi pubmed - Bahit MC, Sacco RL, Easton JD, Meyerhoff J, Cronin L, Kleine E, Grauer C, et al. Predictors of atrial fibrillation development in patients with embolic stroke of undetermined source: an analysis of the RE-SPECT ESUS trial. Circulation. 2021;144(22):1738-1746.
doi pubmed - Sanz-Garcia A, Cecconi A, Vera A, Camarasaltas JM, Alfonso F, Ortega GJ, Jimenez-Borreguero J. Electrocardiographic biomarkers to predict atrial fibrillation in sinus rhythm electrocardiograms. Heart. 2021;107(22):1813-1819.
doi pubmed - Smulyan H. The computerized ECG: friend and foe. Am J Med. 2019;132(2):153-160.
doi pubmed - Minchole A, Camps J, Lyon A, Rodriguez B. Machine learning in the electrocardiogram. J Electrocardiol. 2019;57S:S61-S64.
doi pubmed - Bond R, Finlay D, Al-Zaiti SS, Macfarlane P. Machine learning with electrocardiograms: A call for guidelines and best practices for 'stress testing' algorithms. J Electrocardiol. 2021;69S:1-6.
doi pubmed - Johnston SC, Rothwell PM, Nguyen-Huynh MN, Giles MF, Elkins JS, Bernstein AL, Sidney S. Validation and refinement of scores to predict very early stroke risk after transient ischaemic attack. Lancet. 2007;369(9558):283-292.
doi pubmed - Hindricks G, Potpara T, Dagres N, Arbelo E, Bax JJ, Blomstrom-Lundqvist C, Boriani G, et al. 2020 ESC Guidelines for the diagnosis and management of atrial fibrillation developed in collaboration with the European Association for Cardio-Thoracic Surgery (EACTS): The Task Force for the diagnosis and management of atrial fibrillation of the European Society of Cardiology (ESC) Developed with the special contribution of the European Heart Rhythm Association (EHRA) of the ESC. Eur Heart J. 2021;42(5):373-498.
doi pubmed - Lang RM, Badano LP, Mor-Avi V, Afilalo J, Armstrong A, Ernande L, Flachskampf FA, et al. Recommendations for cardiac chamber quantification by echocardiography in adults: an update from the American Society of Echocardiography and the European Association of Cardiovascular Imaging. J Am Soc Echocardiogr. 2015;28(1):1-39.e14.
doi pubmed - Badano LP, Kolias TJ, Muraru D, Abraham TP, Aurigemma G, Edvardsen T, D'Hooge J, et al. Standardization of left atrial, right ventricular, and right atrial deformation imaging using two-dimensional speckle tracking echocardiography: a consensus document of the EACVI/ASE/Industry Task Force to standardize deformation imaging. Eur Heart J Cardiovasc Imaging. 2018;19(6):591-600.
doi pubmed - Harrell FE. Regression modeling strategies: with applications to linear models, logistic and ordinal regression, and survival analysis. Springer International Publishing, Cham.
- Sanz-Garcia A, Cecconi A, Alday E, Cecconi M, Perez-Romero M, Garrido J, Moreno JMC, et al. Usefulness of computer-assisted ECG analysis in the pre-operative evaluation of noncardiac surgery. Eur J Anaesthesiol. 2020;37(11):1075-1077.
doi pubmed - Attia ZI, Noseworthy PA, Lopez-Jimenez F, Asirvatham SJ, Deshmukh AJ, Gersh BJ, Carter RE, et al. An artificial intelligence-enabled ECG algorithm for the identification of patients with atrial fibrillation during sinus rhythm: a retrospective analysis of outcome prediction. Lancet. 2019;394(10201):861-867.
doi pubmed - de Leon A, Neira V, Alhammad N, Hopman W, Hansom S, Chacko S, Simpson C, et al. Electrocardiographic predictors of atrial fibrillation in patients with cryptogenic stroke. Pacing Clin Electrophysiol. 2022;45(2):176-181.
doi pubmed - Acampa M, Lazzerini PE, Guideri F, Tassi R, Andreini I, Domenichelli C, Cartocci A, et al. Electrocardiographic predictors of silent atrial fibrillation in cryptogenic stroke. Heart Lung Circ. 2019;28(11):1664-1669.
doi pubmed - Skrebelyte-Strom L, Ronning OM, Dahl FA, Steine K, Kjekshus H. Prediction of occult atrial fibrillation in patients after cryptogenic stroke and transient ischaemic attack: PROACTIA. Europace. 2022;24(12):1881-1888.
doi pubmed - Rabinstein AA, Yost MD, Faust L, Kashou AH, Latif OS, Graff-Radford J, Attia IZ, et al. Artificial intelligence-enabled ECG to identify silent atrial fibrillation in embolic stroke of unknown source. J Stroke Cerebrovasc Dis. 2021;30(9):105998.
doi pubmed - Mattu A, Brady WJ, Perron AD, Robinson DA. Prominent R wave in lead V1: electrocardiographic differential diagnosis. Am J Emerg Med. 2001;19(6):504-513.
doi pubmed - Khan MZ, Patel K, Zarak MS, Gupta A, Hussian I, Patel K, Figueredo VM, et al. Association between atrial fibrillation and bundle branch block. J Arrhythm. 2021;37(4):949-955.
doi pubmed - Zhang FT, Liu XJ, Zhao DQ, Wu JT, Zhang LM, Hu J, Fan XW, et al. Association between complete right bundle branch block and atrial fibrillation development. Ann Noninvasive Electrocardiol. 2022;27(4):e12966.
doi pubmed - Yano M, Egami Y, Ukita K, Kawamura A, Nakamura H, Matsuhiro Y, Yasumoto K, et al. Impact of baseline right bundle branch block on outcomes after pulmonary vein isolation in patients with atrial fibrillation. Am J Cardiol. 2021;144:60-66.
doi pubmed - Bussink BE, Holst AG, Jespersen L, Deckers JW, Jensen GB, Prescott E. Right bundle branch block: prevalence, risk factors, and outcome in the general population: results from the Copenhagen City Heart Study. Eur Heart J. 2013;34(2):138-146.
doi pubmed - Nielsen JB, Olesen MS, Tango M, Haunso S, Holst AG, Svendsen JH. Incomplete right bundle branch block: a novel electrocardiographic marker for lone atrial fibrillation. Europace. 2011;13(2):182-187.
doi pubmed - Frontera A, Carpenter A, Ahmed N, Fasiolo M, Nelson M, Diab I, Cripps T, et al. Demographic and clinical characteristics to predict paroxysmal atrial fibrillation: insights from an implantable loop recorder population. Pacing Clin Electrophysiol. 2015;38(10):1217-1222.
doi pubmed - Chatterjee NA, Shah RV, Murthy VL, Praestgaard A, Shah SJ, Ventetuolo CE, Barr RG, et al. Right ventricular structure and function are associated with incident atrial fibrillation: MESA-RV Study (Multi-Ethnic Study of Atherosclerosis-Right Ventricle). Circ Arrhythm Electrophysiol. 2017;10(1):e004738.
doi pubmed - Thijs VN, Brachmann J, Morillo CA, Passman RS, Sanna T, Bernstein RA, Diener HC, et al. Predictors for atrial fibrillation detection after cryptogenic stroke: Results from CRYSTAL AF. Neurology. 2016;86(3):261-269.
doi pubmed - Riordan M, Opaskar A, Yoruk A, Younis A, Ali A, McNitt S, Sahin B, et al. Predictors of atrial fibrillation during long-term implantable cardiac monitoring following cryptogenic stroke. J Am Heart Assoc. 2020;9(15):e016040.
doi pubmed - Xu J, Sethi P, Biby S, Allred J, Seiler A, Sabir R. Predictors of atrial fibrillation detection and features of recurrent strokes in patients after cryptogenic stroke. J Stroke Cerebrovasc Dis. 2020;29(9):104934.
doi pubmed - Bufano G, Radico F, D'Angelo C, Pierfelice F, De Angelis MV, Faustino M, Pierdomenico SD, et al. Predictive value of left atrial and ventricular strain for the detection of atrial fibrillation in patients with cryptogenic stroke. Front Cardiovasc Med. 2022;9:869076.
doi pubmed - Rufibach K. Use of Brier score to assess binary predictions. J Clin Epidemiol. 2010;63(8):938-939; author reply 939.
doi pubmed
This article is distributed under the terms of the Creative Commons Attribution Non-Commercial 4.0 International License, which permits unrestricted non-commercial use, distribution, and reproduction in any medium, provided the original work is properly cited.
Cardiology Research is published by Elmer Press Inc.