| Cardiology Research, ISSN 1923-2829 print, 1923-2837 online, Open Access |
| Article copyright, the authors; Journal compilation copyright, Cardiol Res and Elmer Press Inc |
| Journal website https://cr.elmerpub.com |
Original Article
Volume 16, Number 3, June 2025, pages 238-249

Dissecting Autophagy Gene Expression in Endothelial Cells of Pulmonary Arterial Hypertension at Single-Cell Resolution
Chang Zhi Zhanga, b, Qian Yua, Wei Jia Liua, Jing Hana
aDepartment of Respiratory and Critical Care Medicine, Guizhou Provincial People’s Hospital, Guiyang 550001, China
bCorresponding Author: Chang Zhi Zhang, Department of Respiratory and Critical Care Medicine, Guizhou Provincial People’s Hospital, Guiyang 550001, China
Manuscript submitted February 15, 2025, accepted March 28, 2025, published online April 16, 2025
Short title: Single-Cell Autophagy Profiling in PAH ECs
doi: https://doi.org/10.14740/cr2055
| Abstract | ▴Top |
Background: Endothelial cell (EC) dysfunction is one of the pathogeneses of pulmonary arterial hypertension (PAH); autophagy is an important conserved mechanism for maintaining cellular homeostasis. However, to date, transcriptional signatures of autophagy-related genes during PAH are not well characterized.
Methods: We analyzed the single-cell RNA sequencing (scRNA-seq) data and revealed the relationship between autophagy and PAH in EC from the perspective of differential expression, transcriptional signature typing, comparative analysis, pseudo-temporal changes of autophagy genes, and high dimensional weighted gene co-expression network analysis (hdWGCNA) networks of autophagy genes. Moreover, we established an in vitro PAH model and verified the expression signatures of candidate autophagy-related genes by western blotting. Student’s t-test was used to detect data differences.
Results: Single-cell data showed that ECs had three different subgroups, namely Endo-Nor (normal state), Endo-Mid (transition state), and Endo-PAH (PAH disease group). Functional enrichment analysis of differentially expressed genes between Endo-PAH and Endo-Nor showed that autophagy and phosphatidylinositol 3-kinase (PI3K)-AKT signaling pathways were abnormal. Pseudo-temporal trajectory analysis showed that eight autophagy-related genes were involved in regulating PAH progression. Furthermore, the hdWGCNA network revealed six autophagy-related PAH progression genes. By comprehensively comparing different analysis methods, we identified Ddit4 as an autophagy-related PAH biomarker. Western blot observed that DDIT4 protein was significantly upregulated (P < 0.01) in the PAH model.
Conclusion: This study dissected the expression signature of autophagy genes in PAH at single-cell resolution and identified DDIT4 as a potential biomarker.
Keywords: PAH; Endothelial cell; Autophagy; hdWGCNA; Ddit4
| Introduction | ▴Top |
Pulmonary arterial hypertension (PAH), characterized by elevated pulmonary artery pressure (mean > 25 mm Hg) and right ventricular hypertrophy, is a rare disease with an incidence of only 1 in 20,000 [1, 2]. The pathogenesis of PAH is complex, such as pulmonary vascular remodeling due to endothelial cell (EC) dysfunction, inflammation of the vasculature, and genetic factors [3]. Although current treatment options exist for PAH, its prognosis is poor, ultimately leading to heart failure and death [4]. Heart-lung transplantation is the last resort for terminal stage patients, which greatly increases the difficulty of treatment [1]. Hence, deeper understanding of the pathogenesis is significant for proposing new therapeutic targets and improving the prognosis of PAH.
Endothelial injury is common in vascular diseases such as aortic dissection and atherosclerosis [5, 6]. Of note, ECs participate in primary vascular changes leading to PAH [7]. It has been reported that EC apoptosis is observed in the early stages of PAH, whereas hyperproliferative apoptosis-resistant EC may directly contribute to vascular remodeling in later stages [8]. On the other hand, the regulatory role of autophagy in PAH has also been reported [9]. Autophagy and apoptosis are two different physiological phenomena, but they are closely related in function [10]. Autophagy, whose main function is to maintain the dynamic balance of nutrition and energy by removing damaged or harmful components through catabolism and recycling, is a pathway strictly regulated by molecular signals [11]. Previous in vitro studies have reported a correlation between the autophagy pathway and PAH pathobiology [12]. In addition, elevated LC3 expression levels have been reported not only in rodent models of pulmonary hypertension but also in PAH patients [13, 14].
Previous studies have mainly used microarrays and bulk RNA sequencing (RNA-seq); however, these methods may hinder the discovery of new targets for identification of therapeutics due to the problem of cellular heterogeneity [15, 16]. Furthermore, the whole-lung approach does not allow for the study of EC heterogeneity at a high resolution. Here, this study analyzed the transcriptional characteristics of EC at the single-cell level and highlighted the relationship between PAH and autophagy. Through the comprehensive comparative analysis of cell subtypes, pseudo-time trajectories, and high dimensional weighted gene co-expression network analysis (hdWGCNA), we emphasize that DDIT4 may be a new biomarker for autophagy-related PAH gene. Autophagy may become a prospective option for PAH treatment, and DDIT4 is expected to be a potential target.
| Materials and Methods | ▴Top |
Data collection
All single-cell RNA sequencing (scRNA-seq) data of ECs from SU5416/hypoxia-induced PAH model mice were downloaded from the Gene Expression Omnibus (GEO) database, and the accession number was GSE154959 [15]. The data included control and PAH groups, with three replicates for each group.
Quality control and integrated analysis
To obtain a high-quality scRNA-seq data, we used Seurat (v4.3.0, R package) to perform data filtering on the upstream data generated by Cellranger (v7.0.0) [17]. We filtered out cells with gene < 200, count < 500, and mitochondrial gene content > 10%. Next, we integrated different single-cell datasets using the canonical correlation analysis (CCA) algorithm from Seurat package, specifically executed by the FindIntegrationAnchors() function and the IntegrateData() function. The integrated data were subjected to uniform manifold approximation and projection (UMAP) dimensionality reduction using the first 15 dimensions, and resolution = 0.3 was used to divide the cell clusters.
Identification of cell types
Canonical marker genes of individual cell types are used to classify cell types. For all cells, we identified four main cell types, ECs (Kdr, Pecam1), macrophages and monocyte cells (Csf1r, Cd14), fibroblast cells (Col3a1, Col1a1), and B cells (Cd79a, Cd79b) [15, 18-20]. For the division of EC subpopulations, we first extracted the ECs, then re-clustered them using the first 20 dimensions and used a resolution of 0.3 for cluster division. Then, we annotated the subpopulations according to the cell states in different clusters.
Different gene expression analysis
For scRNA-seq data, to identify differentially expressed genes (DEGs) in different cell types, we used the findmarkers() function of Seurat software for differential expression analysis [17]. We set the threshold as log2FC > 0.1, min.pct > 0.1. Unless otherwise mentioned, other parameters used the default settings. For bulk RNA-seq data, limma (v3.54.2, R package) was used to identify the DEGs, and the threshold as log2FC > 0.05, P < 0.05.
Functional enrichment analysis
Functional enrichment analysis was used to determine the functional expression network of DEGs. We used clusterProfiler (v4.6.2, R package) for the Kyoto Encyclopedia of Genes and Genomes (KEGG) pathway analysis [21]. The input was a DEGs list. First, the bitr function was used to convert the gene symbol to an ID, and then enrichKEGG was used for functional enrichment analysis, with P value cutoff of 0.05 and other parameters as default. Protein-protein interaction (PPI) analysis was performed by Metascape, and the input was the DEGs. Moreover, the Metascape was used to build the functional enrichment network. Both the functional enrichment network and the PPI network were calculated and plotted by Metascape’s built-in integration software [22].
Gene set acquisition of autophagy-related genes
Autophagy-related genes are from the KEGG database, accession number: mmu04140. The gene set includes 142 genes participating in regulating autophagy process [23].
Constructing pseudo-time developmental trajectories of ECs
Monocle (v2.28.0, R package) is a well-established and widely used tool for constructing pseudo-chronological developmental trajectories [24]. We used the seurat object of ECs as the input of monocle. Next, we used the newCellDataSet function to construct a monocle object. We used genes with a certain expression level as the input for unsupervised clustering. When determining the trajectory, the parameters were set to max_components = 2, reduction_method = 'DDRTree'. Then, we used the orderCells function to sort cells and determine the trajectory direction. We used the BAEM function to screen genes for fate trajectory branches and visualize autophagy-related genes.
Construction of WGCNA in high dimensional data
WGCNA is widely used in screening key genes in different fields [25], including the cardiovascular field [26]. hdWGCNA (v2.28.0, R package) was used to perform WGCNA in ECs at a single-cell level [27]. The MetacellsByGroups function was used to aggregate the expression levels of multiple cells, and then the SetDatExpr function was used to select ECs for matrix selection, and the default parameters were used to determine the soft threshold. Further, the hdWGCNA network was constructed using the ConstructNetwork function, and finally, the autophagy-related genes were displayed in the gene network.
Cell culture
Human pulmonary artery endothelial cells (HPAECs) were cultured in DMEM medium (Gibco, Beijing, China) supplemented with 10% fetal bovine serum (FBS; Excell Bio, Shanghai, China). When the cells were 90% confluent, they were washed with phosphate-buffered saline (PBS) and digested into single cells by trypsinization (Gibco, Thermo Fisher Scientific, USA).
To establish a hypoxia-induced PAH model, HPAECs were treated with different oxygen concentrations. HPAECs were divided into two groups: normoxic group (Ctrl group) and hypoxic group (PAH group). The incubator environment of the normoxic group was set to 37 °C, 21% O2, 5% CO2, and 74% N2, while that of the hypoxic group was set to 37 °C, 5% CO2, 2% O2, and 90% N2, which were based on previous studies [28, 29]. After 24 h of culture, samples were collected for protein immunoblotting experiments.
Western blot analysis
Western blotting steps were conducted as described by Yu et al with a slight modification [30]. After HPAECs were enzymatically digested and collected, they were lysed using radioimmunoprecipitation assay (RIPA) to obtain proteins. Proteins were first denatured at high temperature and then subjected to sodium dodecyl sulfate (SDS) gel electrophoresis. Subsequently, protein transfer and antibody incubation were performed, followed by color development and photography. Antibody information is detailed in Supplementary Table 1 (cr.elmerpub.com).
Statistical analysis
All experiments were performed in at least three independent replicates and data were shown using mean ± standard deviation (SD). Student’s t-test was used to determine differences between samples by Graphpad Prism 8.0 software, compared to the Ctrl group (*P < 0.05 and **P < 0.01).
Ethical compliance
This study does not involve the study of any human tissue samples, and the study protocol was approved by the Ethics Committee of Guizhou Provincial People’s Hospital (No. 2022041, data: 2022.05.06).
| Results | ▴Top |
scRNA-seq profiles of PAH models
We first observed whether different single-cell datasets have batch effects. The UMAP plot showed that different clusters have different dataset data distribution, indicating that there is no obvious batch effect between different datasets (Fig. 1a). Next, we identified four different major cell types, including ECs, macrophages and monocyte cells, fibroblast cells, and B cells (Fig. 1b). The distribution of cell types in different cell pools is shown in Supplementary Figure 1A (cr.elmerpub.com). We used feature plot and violin plot to show the distribution of major marker genes in different cell types. Different cell types showed a clear degree of discrimination, which shows that our classification of cell types is accurate (Supplementary Figure 1B, C, cr.elmerpub.com). We further analyzed the ECs and found that these cells were distributed in 12 clusters in the integrated dataset (Fig. 1c). Then, we marked the distribution of ECs in different datasets and found a clear distribution among them (Supplementary Figure 1D, cr.elmerpub.com). Subsequently, we divided ECs into three subtypes, namely PAH type (Endo-PAH), intermediate type (Endo-Mid), and normal type (Endo-Nor), according to different cell states (Fig. 1d). Heatmap shows that different EC subtypes have distinct gene transcription and expression signatures (Fig. 1e).
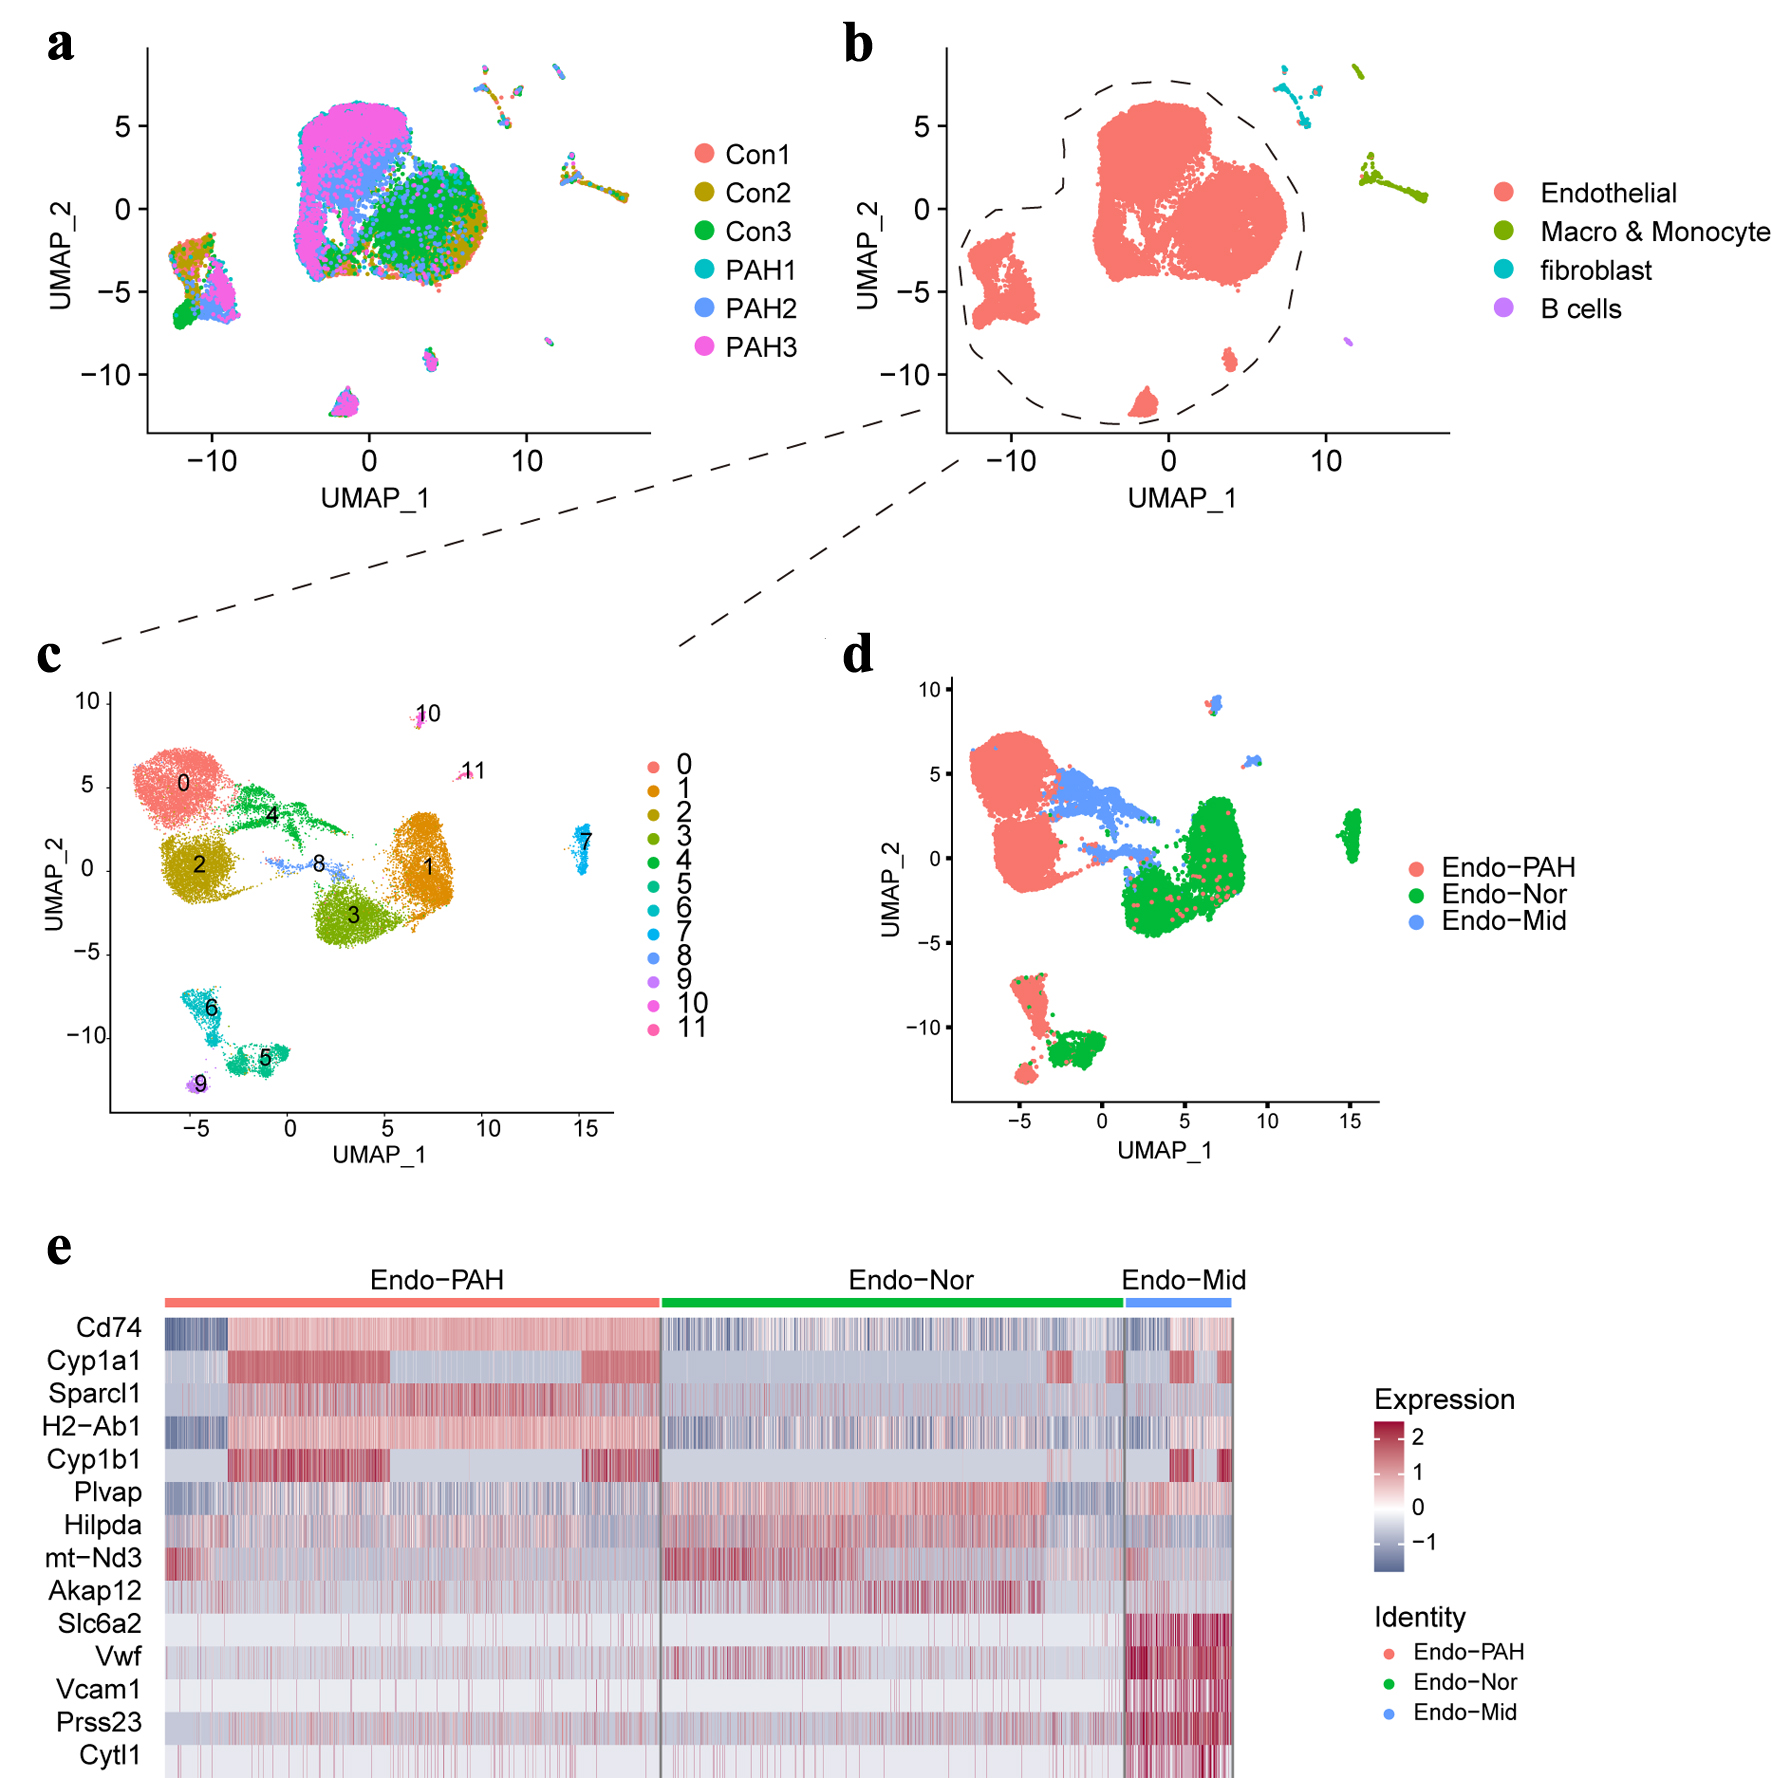 Click for large image | Figure 1. The single-cell landscape in this study. (a) The UMAP plot showing the merged data in this study. (b) The UMAP plot showing the main cell types. (c) The UMAP plot showing the different clusters of endothelial cells. (d) Display of sub-cell types of endothelial cell. (e) The heatmap showing the top five genes in different sub- cell types. UMAP: uniform manifold approximation and projection. |
The gene expression characteristics of ECs
To investigate the gene expression characteristics of ECs during PAH process, we first globally compared the transcriptional dynamics of ECs under different conditions, and as a result, 2,176 DEGs were obtained, of which 1,539 were upregulated and 637 were downregulated (Fig. 2a). Functional enrichment analysis showed that the PI3K-AKT signaling pathway was significantly enriched, and autophagy, apoptosis, necroptosis, and ferroptosis signals were also enriched (Fig. 2b). Next, the different expression analysis of ECs between Endo-PAH subtypes and Endo-Nor subtypes was performed. The volcano map shows that we identified a total of 1,676 DEGs (Fig. 2c). The KEGG pathway analysis indicated that the PI3K-AKT signaling pathway was the top 1 pathway (Fig. 2d).
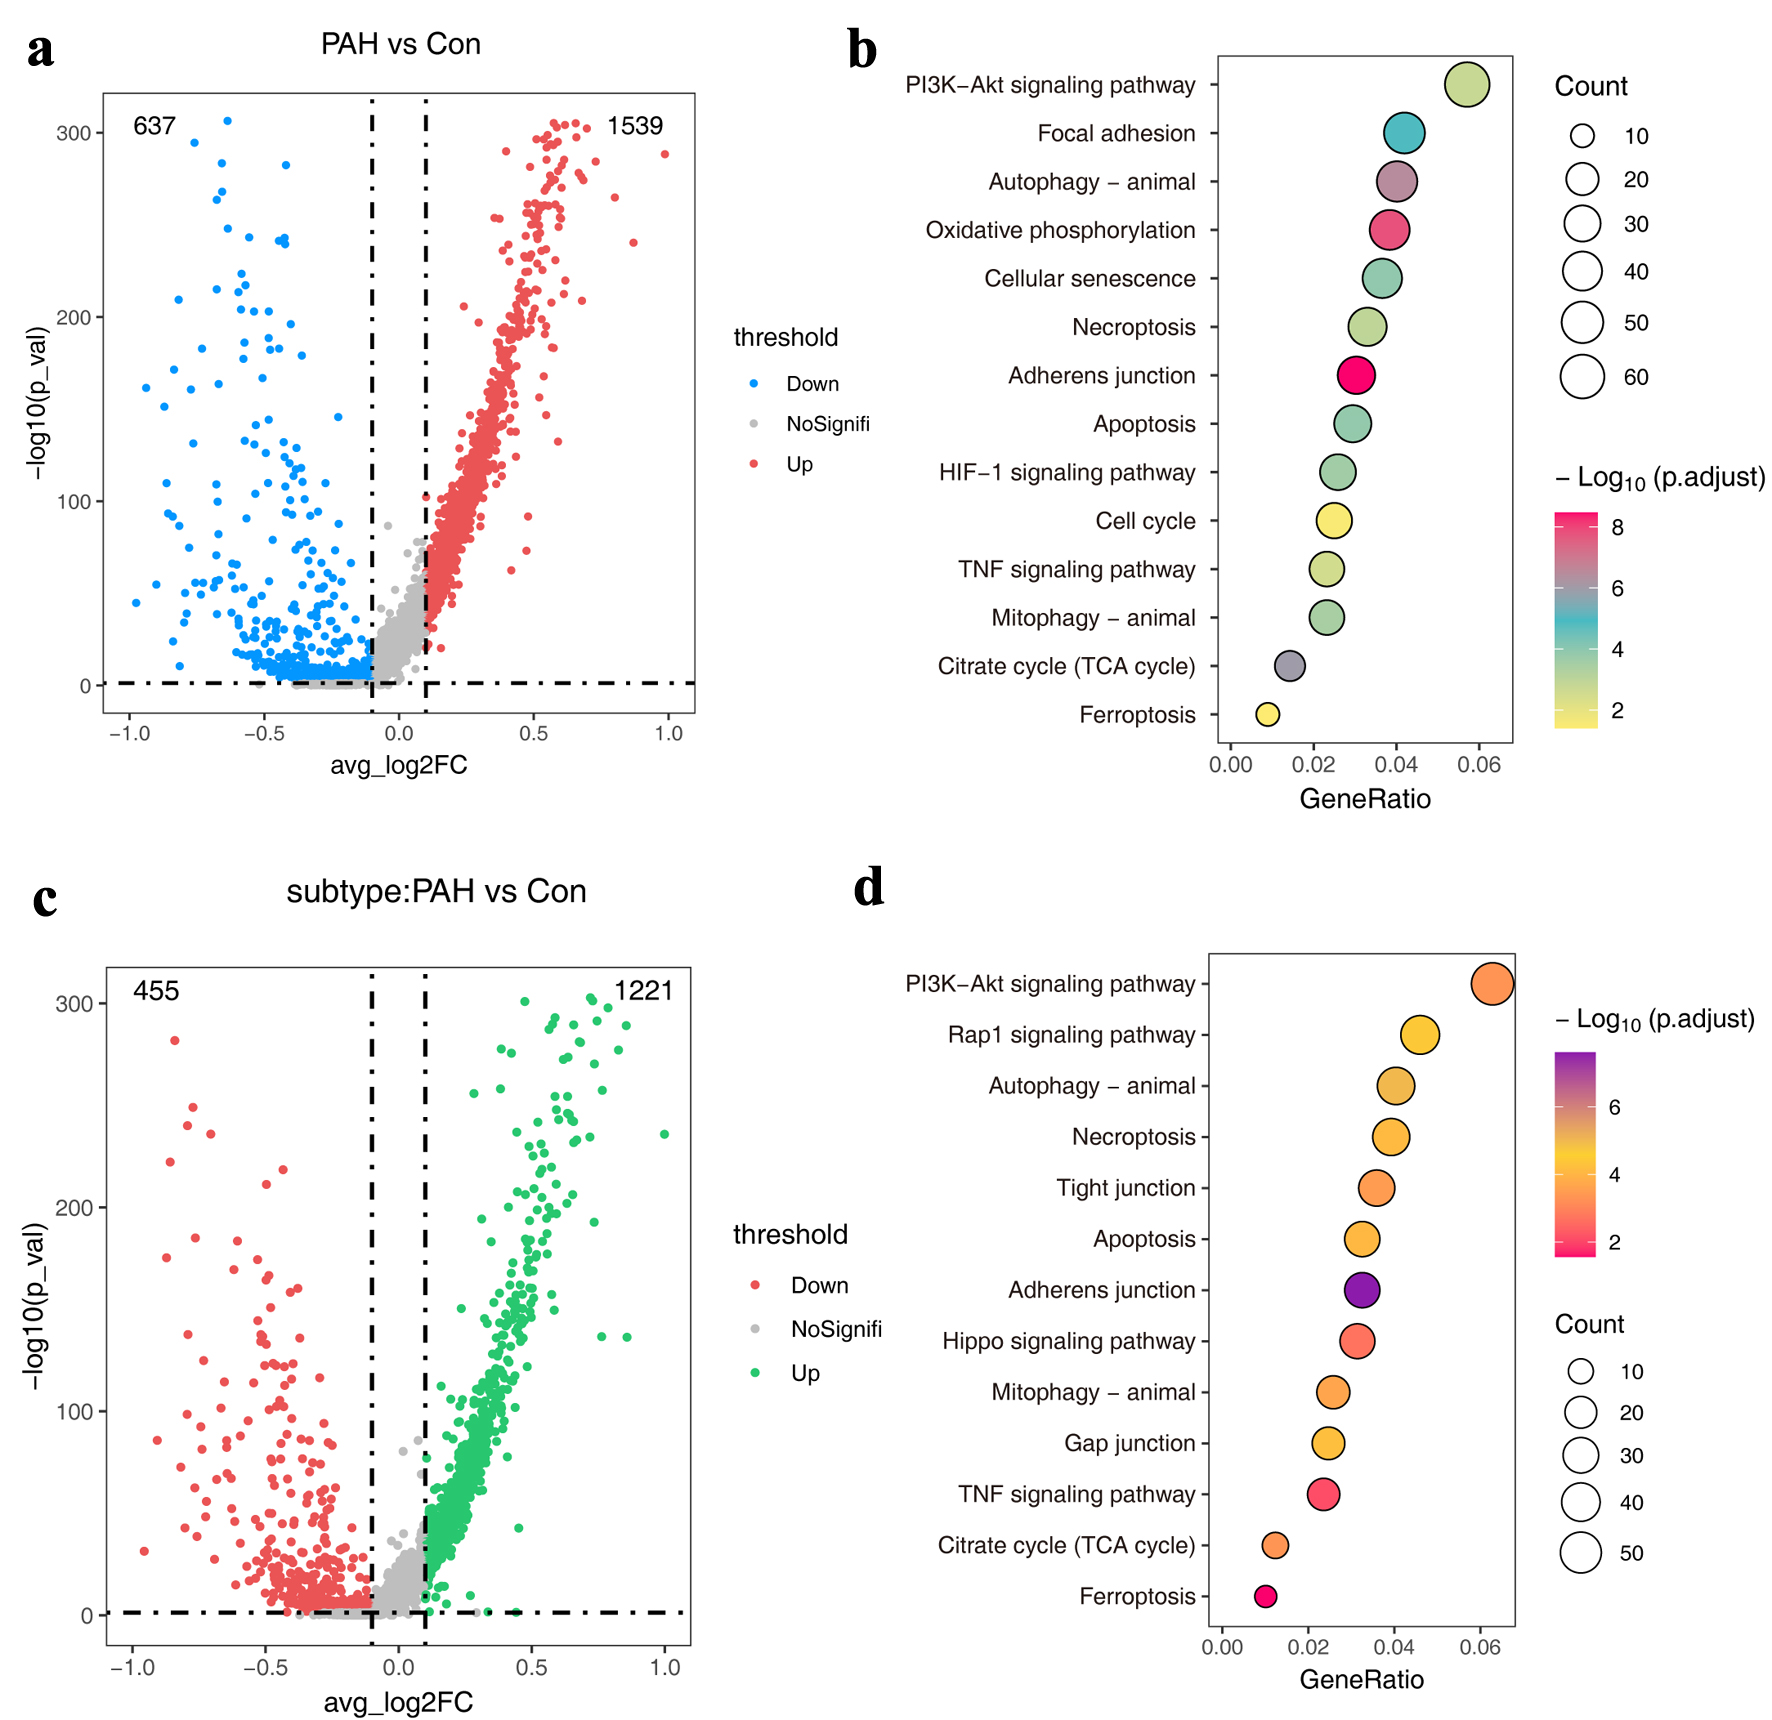 Click for large image | Figure 2. The atlas of molecular features of ECs. (a) Volcano plots showing DEGs in the PAH group compared to the normal group. (b) The KEGG pathways of DEGs in (a). (d) Volcano plots showing DEGs in the Endo-PAH group compared to the Endo-Nor group. (d) The KEGG pathways of DEGs in (c). DEGs: differentially expressed genes; ECs: endothelial cells; Endo-PAH: PAH disease group; Endo-Nor: normal state; KEGG: Kyoto Encyclopedia of Genes and Genomes; PAH: pulmonary arterial hypertension. |
Autophagy-related gene expression characteristics in ECs
To explore the expression characteristics of autophagy-related genes in ECs, we performed comparative analysis. The Venn diagram showed that a total of 29 autophagy-related genes were differentially expressed in ECs during PAH (Fig. 3a). The functional network analysis of 29 genes showed that they were highly associated with autophagy, macroautophagy, apoptosis, etc. (Fig. 3b). Next, the PPI network analysis showed that they were related to endocrine resistance, thyroid hormone signaling pathway, insulin signaling pathway, etc. (Fig. 3c).
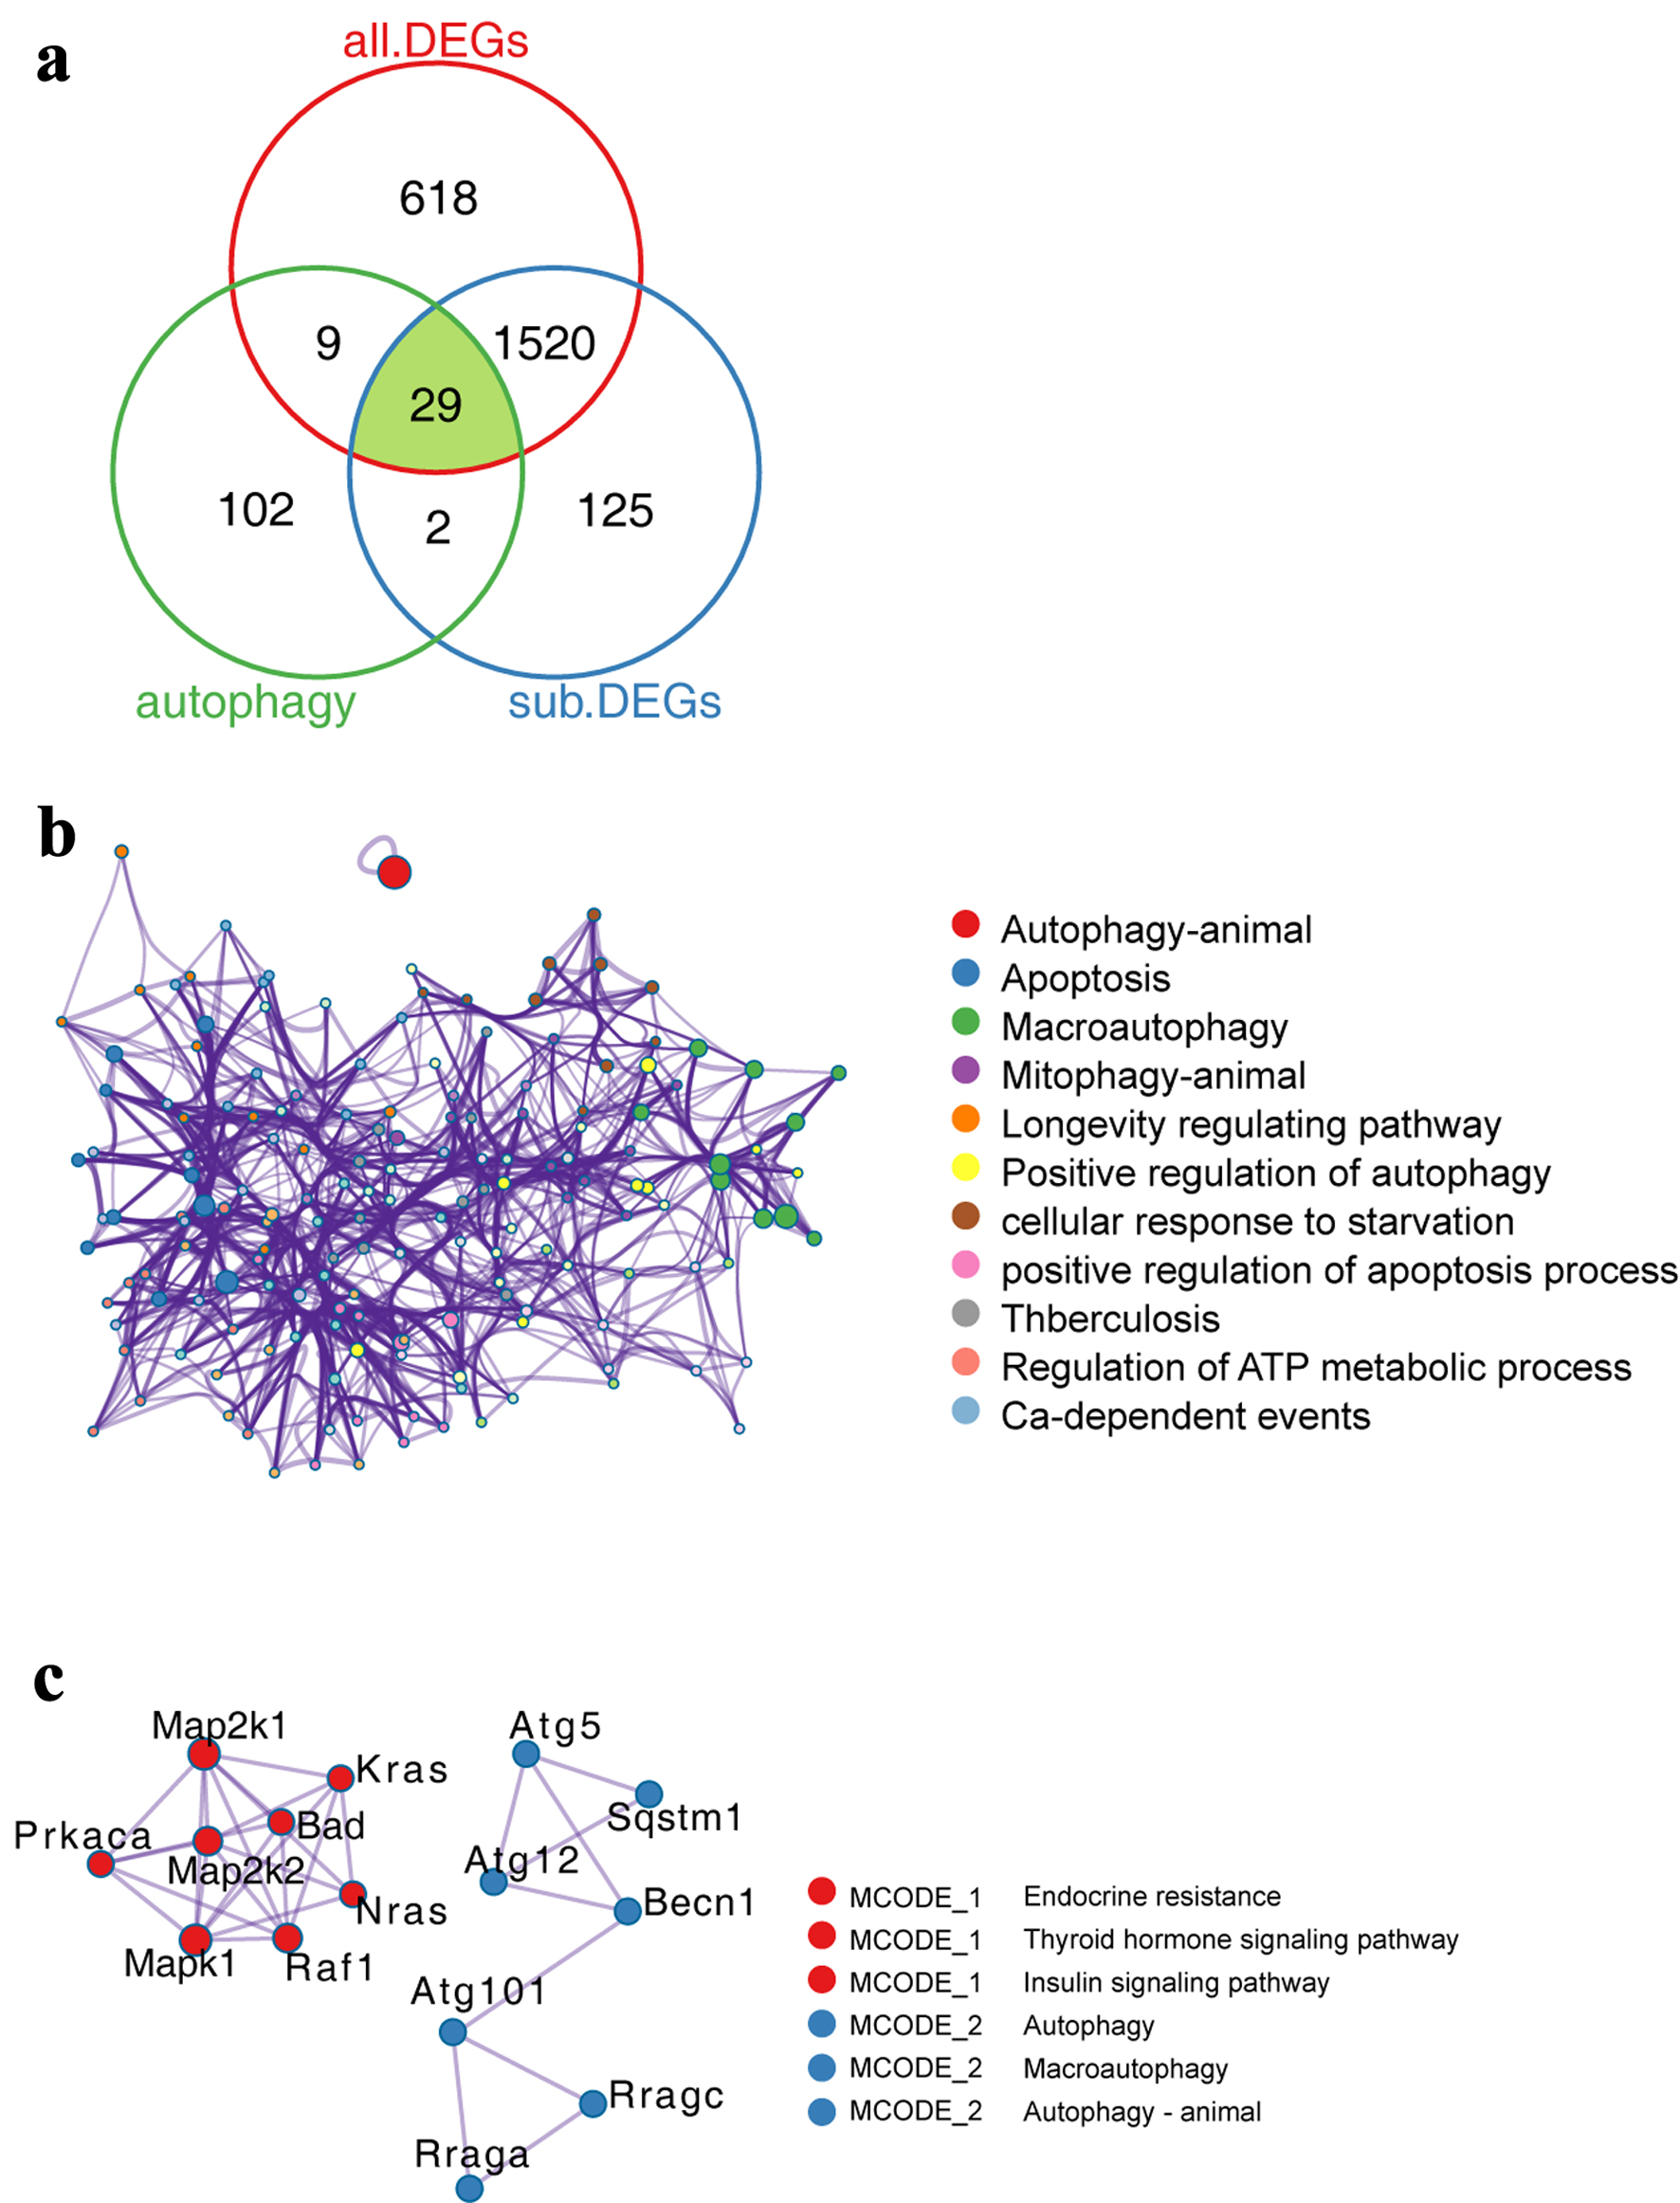 Click for large image | Figure 3. Expression characteristics of autophagy-related genes in PAH model. (a) Venn diagram showing the comparative analysis of autophagy-related genes and genes related to PAH process. (b) Functionally enriched network of autophagy-related genes. The size of the dots represents the number of genes enriched by the term, while the lines represent the interconnections between different terms. (c) PPI network of autophagy-related genes. Dots of the same color represent that they belong to the same type, while lines represent the interconnections between different proteins. PAH: pulmonary arterial hypertension; PPI: protein-protein interaction. |
Expression characteristics of autophagy-related genes in pseudo-time trajectories
Pseudo-time developmental trajectories can reveal the characteristics of cell fate regulation. First, we constructed a pseudo-time developmental trajectory of ECs, and the results showed that ECs went through two fate-determining branches and formed five different cell fate states (Fig. 4a, b). Furthermore, we visualized the distribution of cells in cell trajectories under different conditions and found that the proportion of cells in PAH samples was higher in stage 3, which was consistent with the cell distribution statistics (Fig. 4c, d). The above results suggest that during cell differentiation 1, the transcriptional program driving PAH changes, resulting in two different cell fates, one developing toward PAH (cell fate1) and the other being a normal program (cell fate2) (Fig. 4c). In order to explore the dynamics, we used the BEAM algorithm for analysis, and the results suggested that autophagy-related genes play a role in it. In the PAH fate, Ddit4 expression is gradually upregulated, while Mapk3 is gradually downregulated (Fig. 4e).
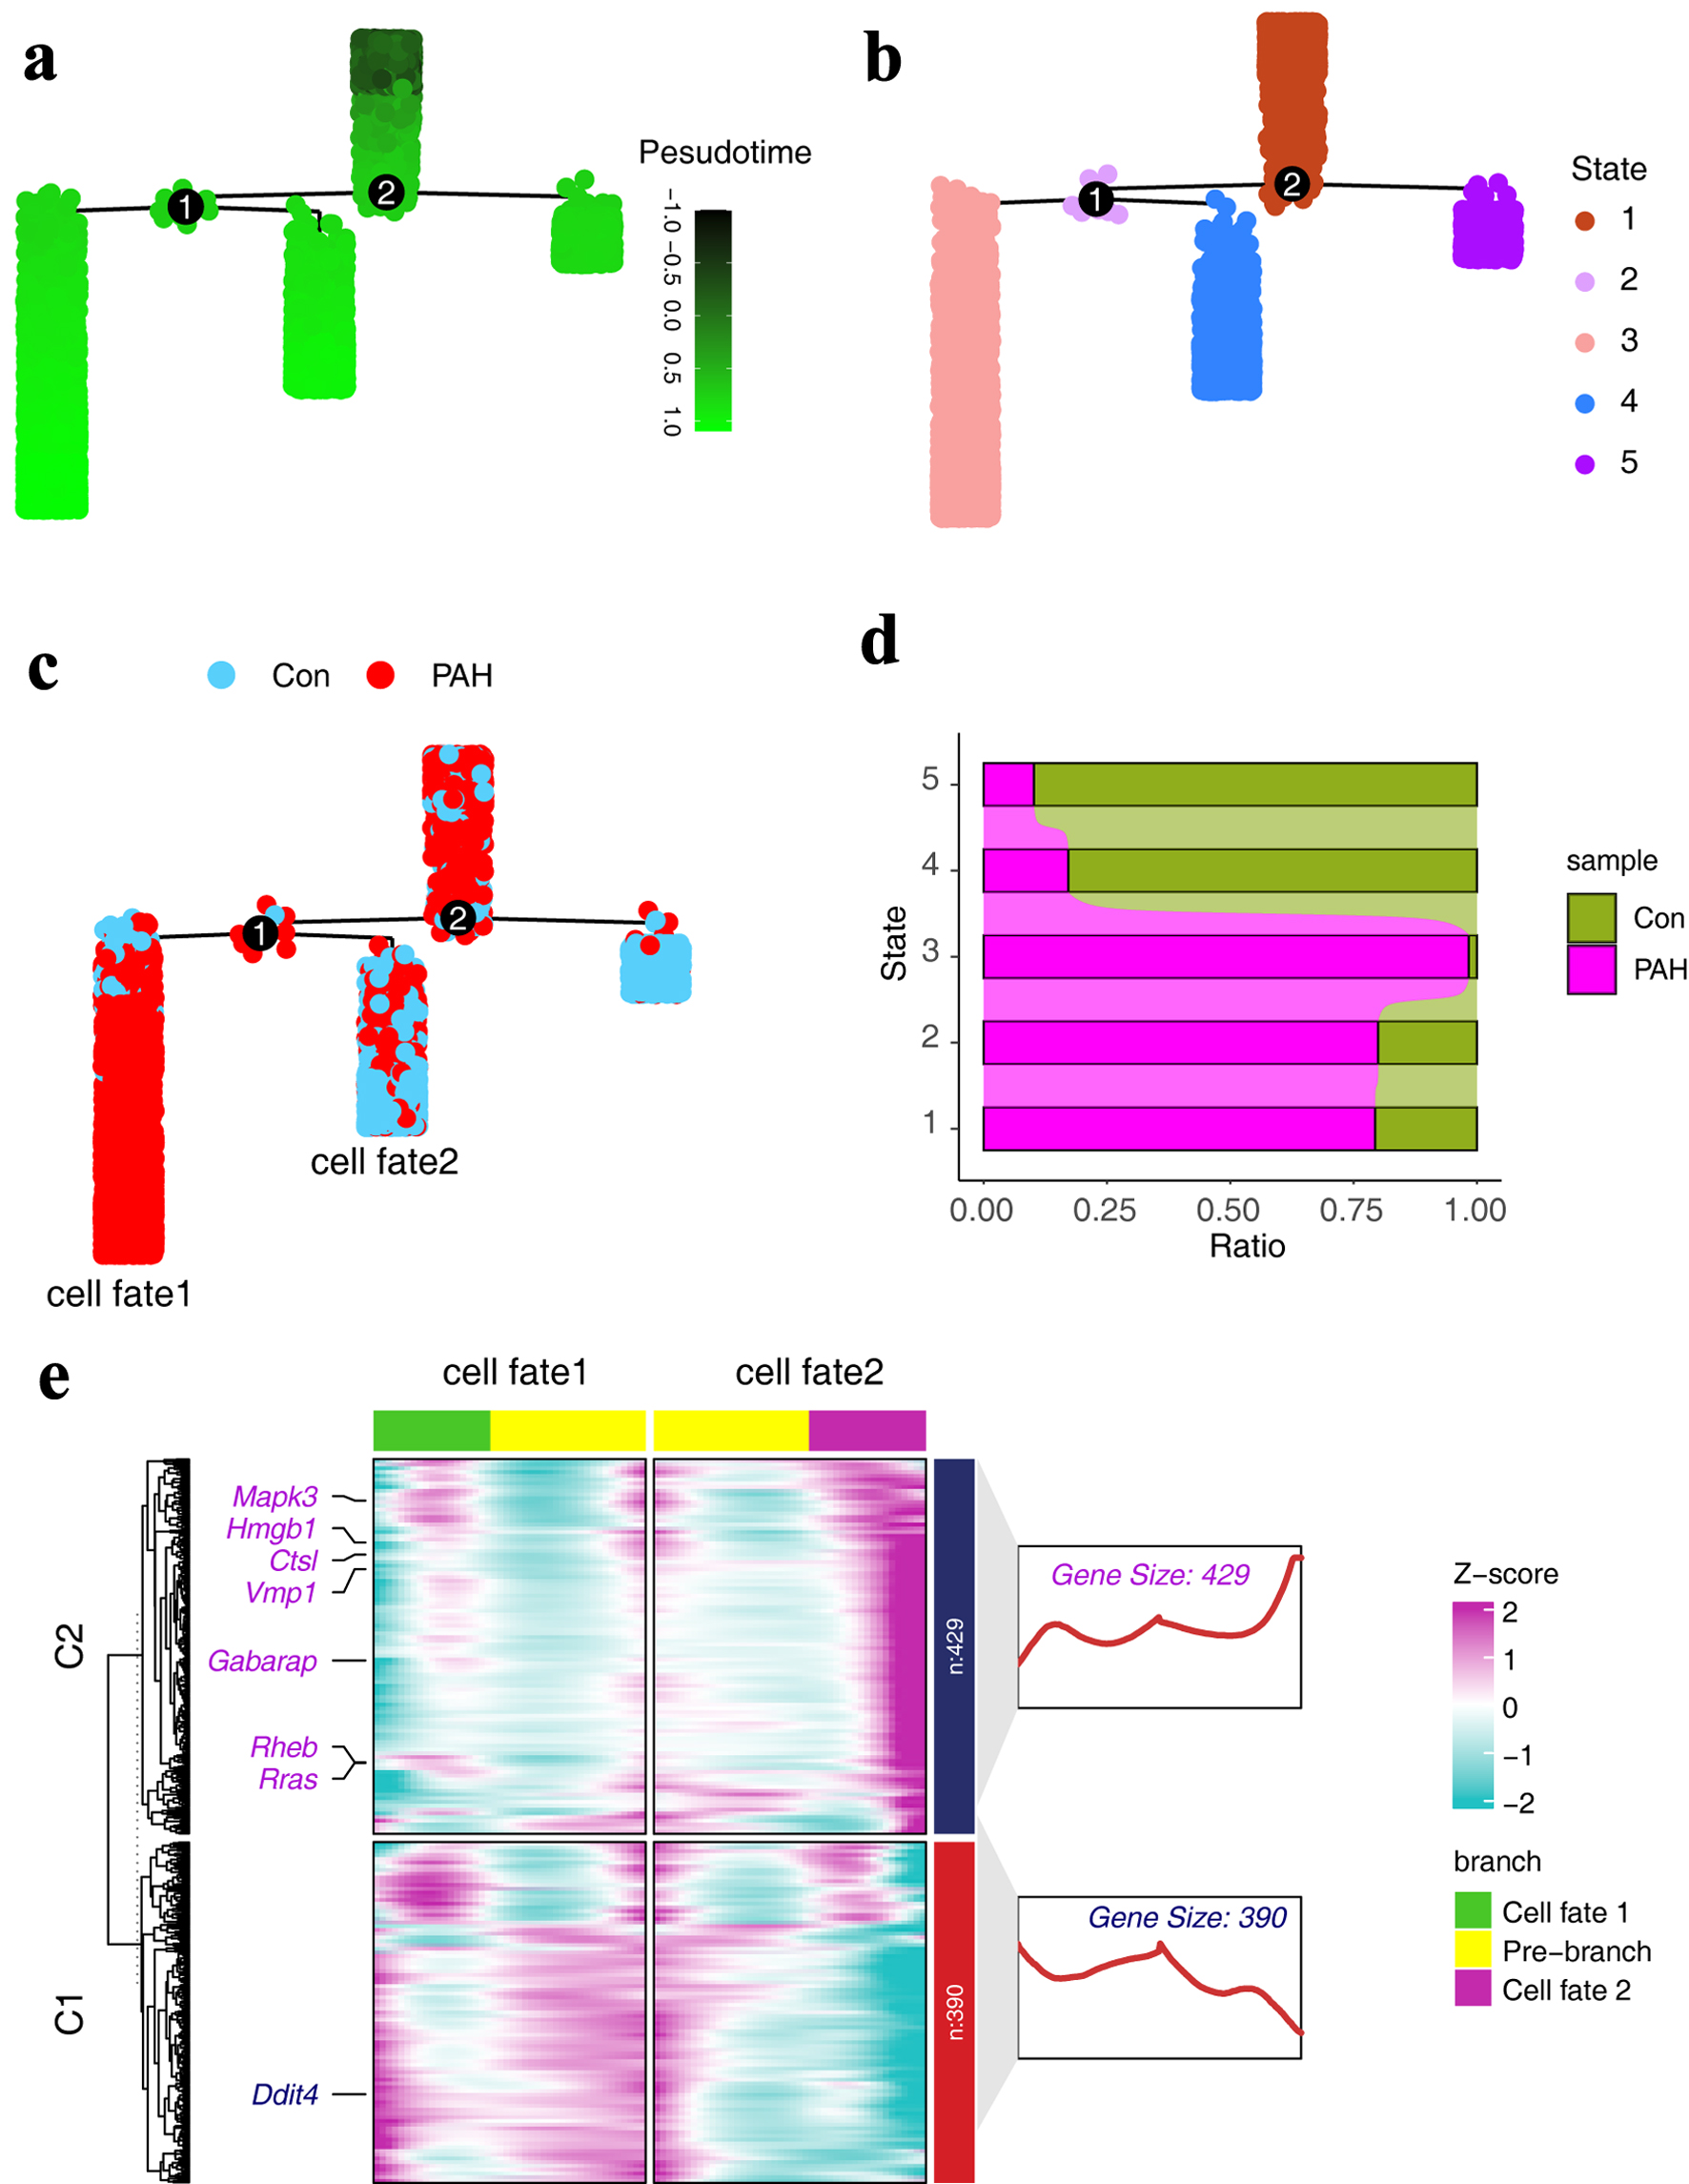 Click for large image | Figure 4. Expression characteristics of autophagy-related genes in pseudo-time trajectories. (a) Pseudo-time trajectories of ECs, with colors representing developmental trajectory states. (b) Fate states of ECs in pseudo-time trajectories. (c) Distribution of different groups in the pseudo-time series trajectory. (d) The distribution of different groups in different states of the pseudo-time trajectory. (e) Heat map showing the expression characteristics of autophagy-related genes in pseudo-time trajectory. ECs: endothelial cells. |
Construction of ECs autophagy-related gene network by hdWGCNA
We used hdWGCNA to construct the regulatory network of autophagy-related genes in ECs. First, in order to meet the construction of a scale-free network, we selected a threshold of 4 for network construction (Fig. 5a). Under this threshold, genes were divided into different modules (Fig. 5b). A total of nine modules were obtained, of which the turquoise module had the most genes, 610, and Plpp1, H2-D1, and Srgn were the top genes in this module (Fig. 5c, d). Furthermore, we observed the distribution characteristics of different modules within the samples, and we found that turquoise was highly expressed in the PAH group (Fig. 5e). Finally, we constructed a scale-free network of autophagy-related genes and the results showed that there were six core genes, including Ddit4, Mras, Ctsl, Lamp1, Sqstm1, and Map1lc3a (Fig. 5f).
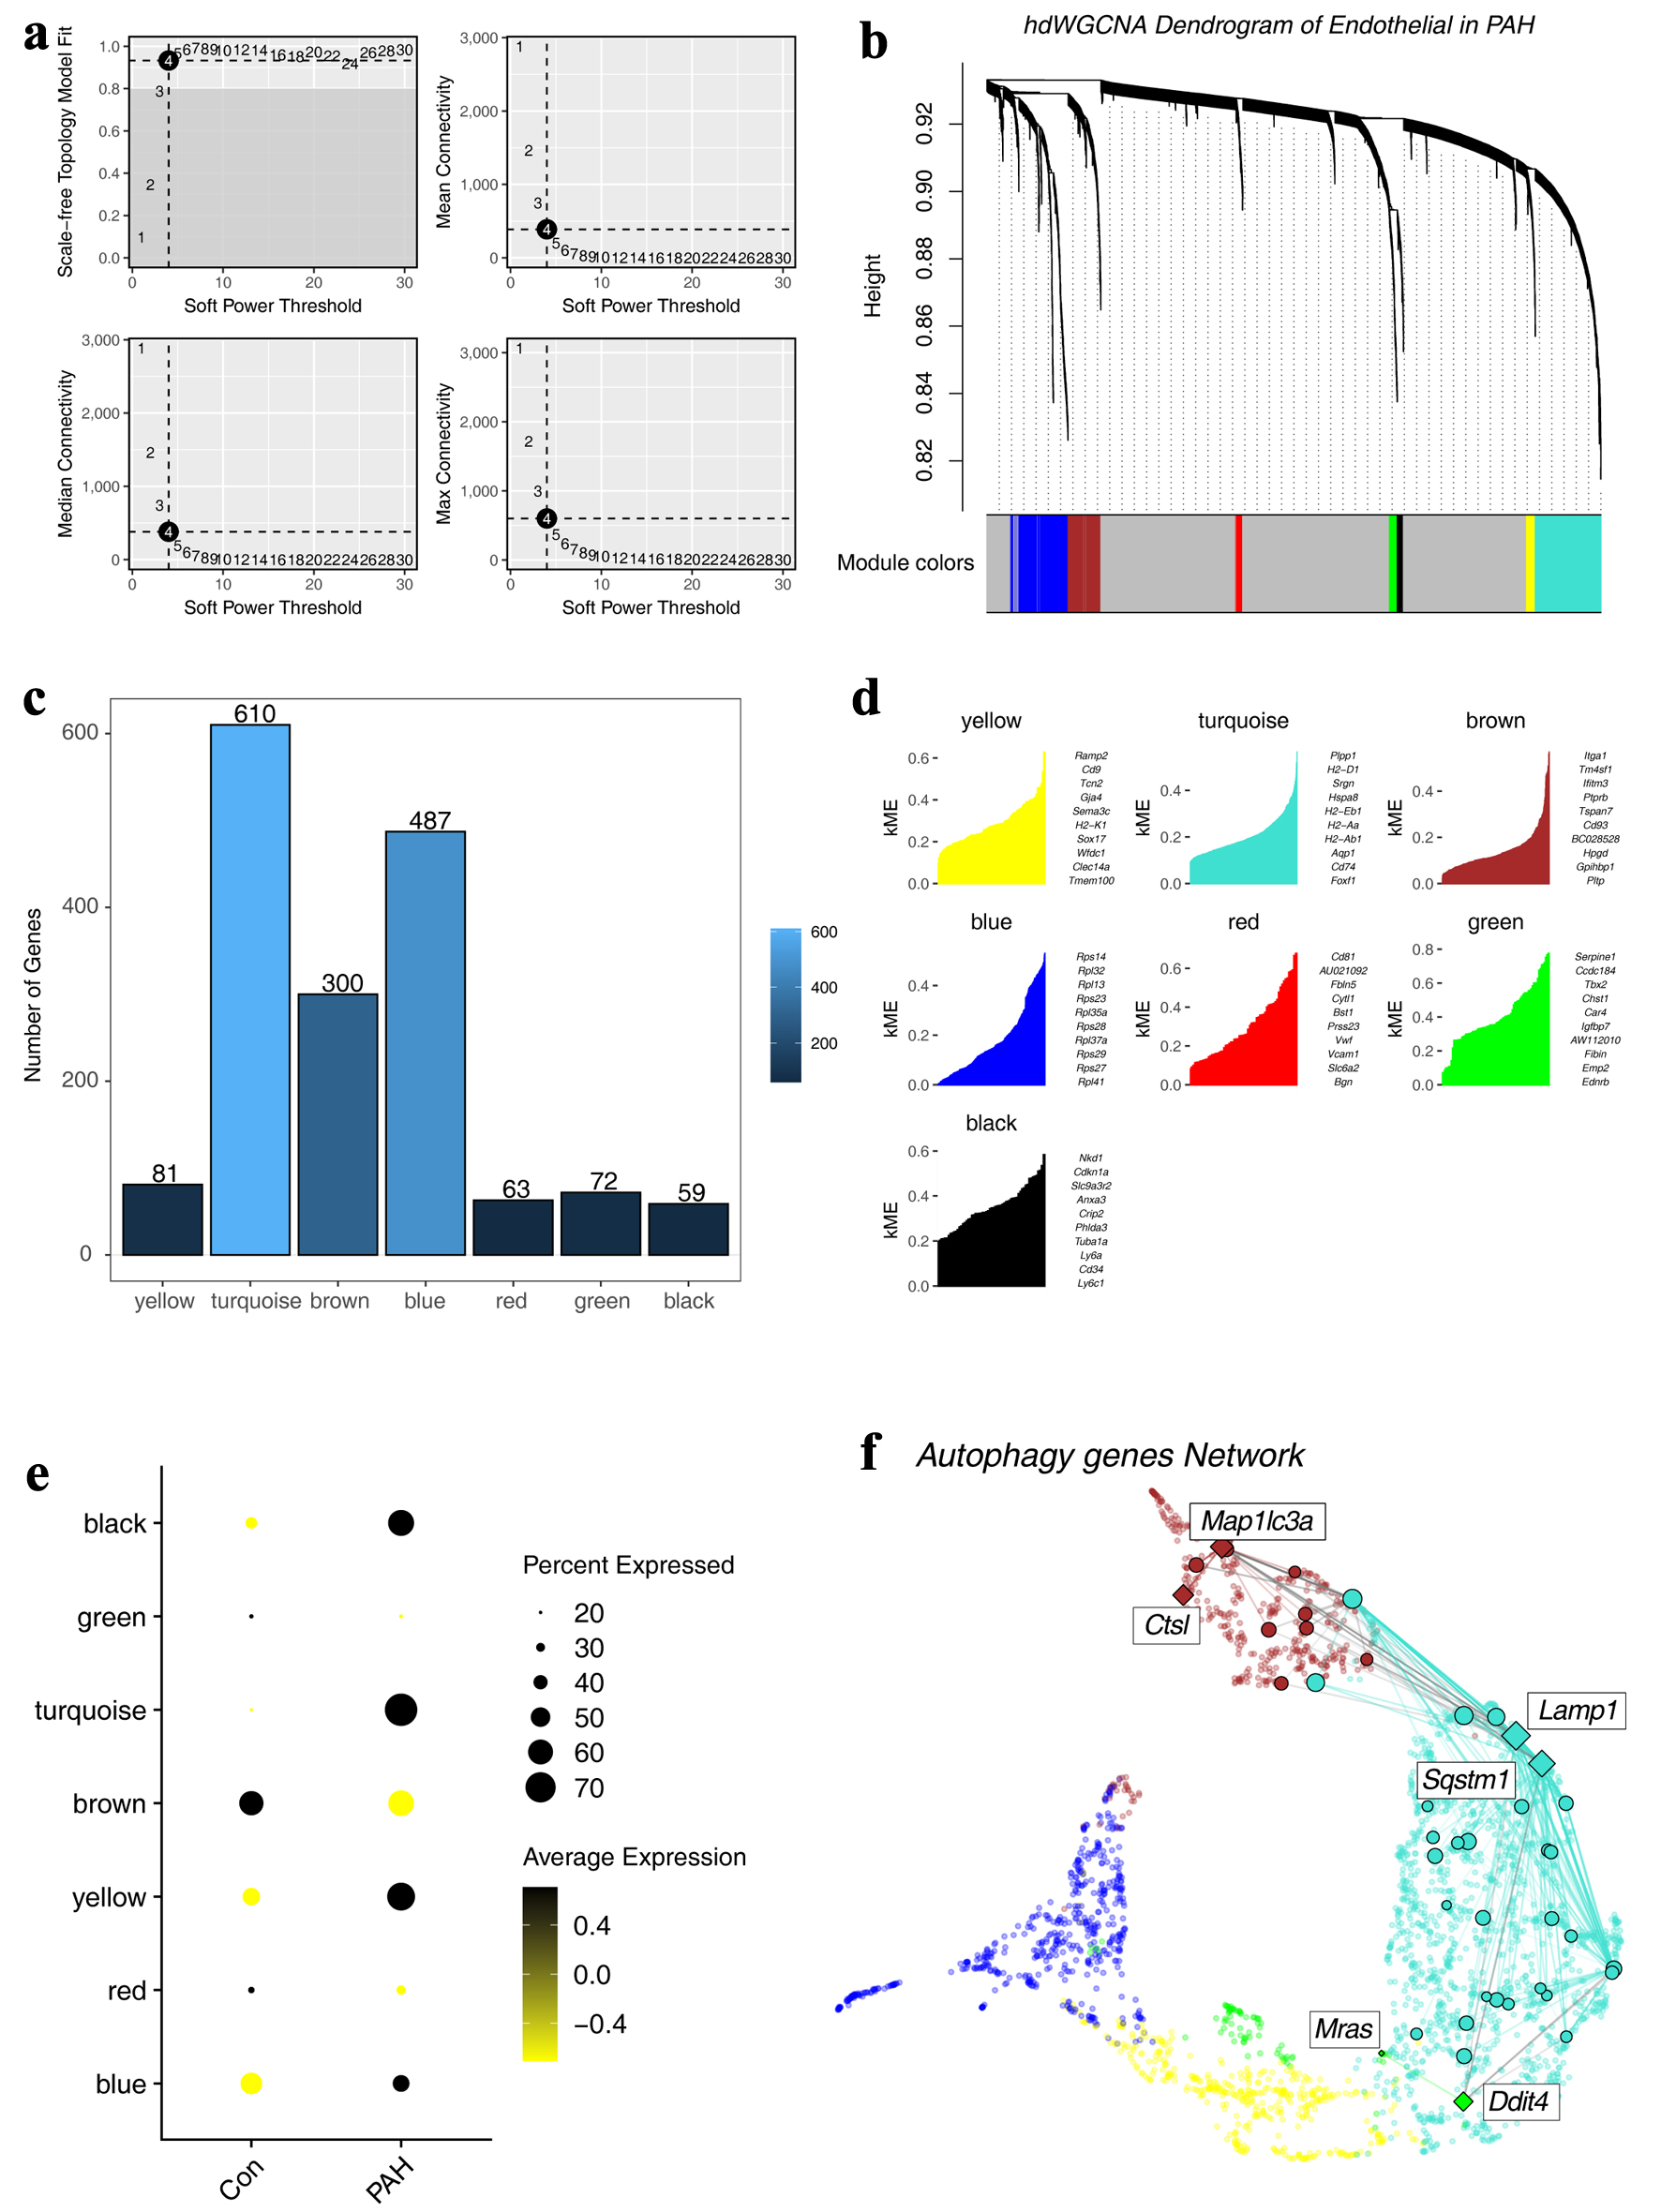 Click for large image | Figure 5. Construction of a regulatory network of autophagy-related genes. (a) Distribution of scale-free networks under different thresholds. (b) Hierarchical clustering shows the module divisions to which different genes belong. (c) The bar graph shows the number of genes in different modules. (d) Top 10 genes in different modules. (e) Expression characteristics of different modules in different groups. (f) The regulatory network of autophagy-related genes. |
DDIT4 as an autophagy-related PAH biomarker
Next, we sought to identify PAH-associated autophagy genes to characterize candidate therapeutic targets. We comprehensively analyzed the results of different algorithms and found a common gene, Ddit4, which was obtained in differential comparative analysis, pseudo-sequential analysis, and hdWGCNA network construction (Fig. 6a). Therefore, we identified it as a candidate gene. Subsequently, we constructed an in vitro hypoxia-induced PAH model and found that the PAH group had increased autophagy levels, as reflected by a significant increase in the LC3B-II/I ratio, which was consistent with previous findings. In addition, we found that the protein level of DDIT4 was also significantly increased (Fig. 6b-d).
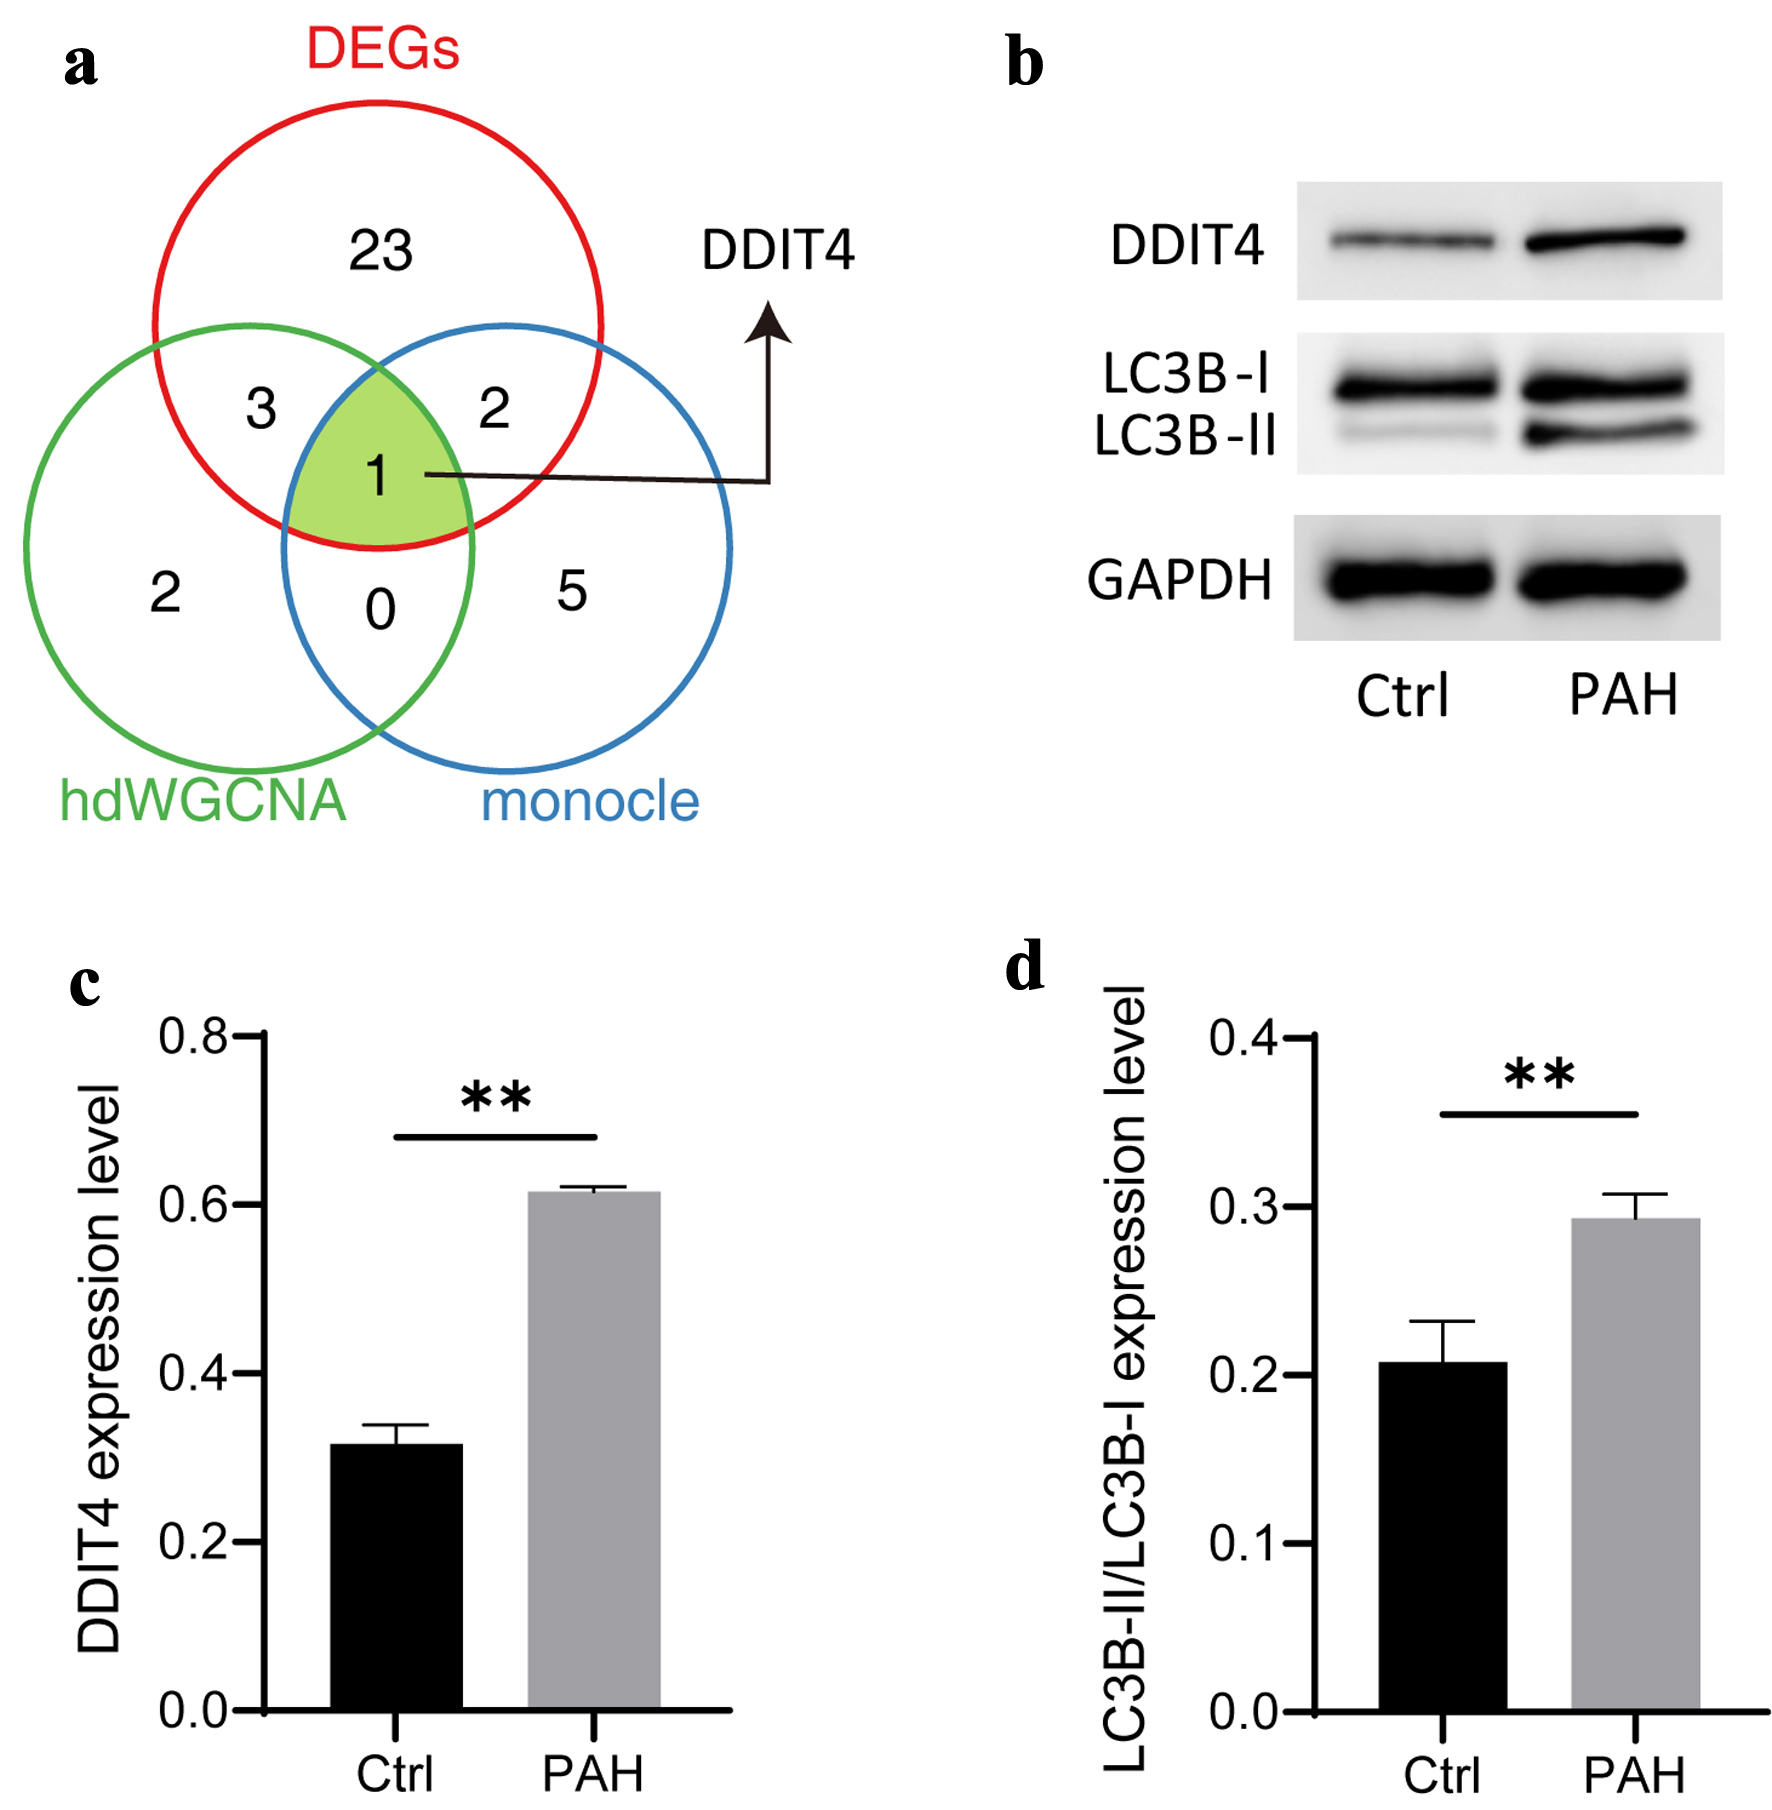 Click for large image | Figure 6. Identification of candidate biomarkers associated autophagy-related genes. (a) Venn diagram showing the comparative analysis of different bioinformatic analysis. (b) Typical diagram of autophagy-related proteins, including DDIT4, LC3B-I, and LC3B-II. (c, d) The histogram shows the expression of autophagy-related proteins, followed by DDIT4, LC3B-II/LC3B-I. N = 3. Student’s t-test was used to identify difference. Compared to the control group, **P < 0.01. |
| Discussion | ▴Top |
Autophagy plays a regulatory role in a variety of diseases [31, 32]. Indeed, the results of several in vitro studies suggest a correlation between the autophagy pathway and the pathobiology of PAH [12]. However, reports on the role of autophagy in the development of PAH are often contradictory [33]. In humans, the expression of LC3B and its activated form LC3B-II is significantly increased in the lungs of PAH patients [13]. Hypoxia is an important initiating factor of PAH. Previous reports have shown increased autophagy in mouse hypoxia models [34], which is consistent with the results in humans and our in vitro model. Conversely, decreased autophagy was observed in rats [35]. In another classic rat model, it was found that the ingestion of monocrotaline led to the development of PAH through direct endothelial damage, thus inducing pulmonary vasculitis. Mechanistically, P62 expression was reduced and the LC3B-II/ I ratio was significantly increased, leading to the activation of autophagy in rat lung tissue [36]. To date, the expression signature of autophagy-related genes in PAH has not been well resolved at the single-cell level, particularly in EC. To investigate the relationship between autophagy in EC molecular changes during PAH process at the single-cell resolution, we re-analyzed the scRNA data of ECs from SU5416/hypoxia-induced PAH model. Of note, by comparing different bioinformatics approaches, we identified a potential autophagy-related PAH marker gene and validated it using an in vitro hypoxia-induced PAH model, which broadens the understanding of the pathogenesis of PAH and may serve as a candidate therapeutic target.
In a previous study [15], five main EC clusters, including Artery, Vein, CapillaryA, CapillaryB, and Lymphatic, were obtained. Interestingly, in this study, we first identified ECs by classical marker, like Kdr and Pecam1. Kdr, serving as a vascular EC growth factor, is a receptor of vascular endothelial growth factor (VEGF) [18, 37]. Pecam1, also known as CD31, is a regulator of endothelial junctional integrity [38]. Except for the vast majority of ECs detected, a small number of cells were annotated to immune cell types, such as B cells, with Cd79a as a marker [19]. Moreover, we obtained other two cell types, including fibroblast and monocyte cells. Csf1r was used as the marker for identification of fibroblast [39].
Based on the cell types we identified, we further performed an in-depth analysis of ECs. Interestingly, in this study, we found that during PAH progression, ECs undergo a distinct switch based on transcription state at a single-cell resolution. Hence, we classified EC into three distinct subtypes, including normal (EC-Nor), transitional (EC-Mid), and pathogenic (EC-PAH). Top1 marker gene in EC-PAH is Cd74. CD74 is an integral membrane protein that was thought to function mainly as a major histocompatibility complex (MHC) class II chaperone [40]. Previous studies suggested that CD74 was highly expressed in PAH patients and is associated with EC inflammation in PAH [15, 41, 42]. In second place is Cyp1a1. It was reported that Cyp1a1 was related to PAH [43]. In normal ECs, Plvap and Hilpda were high expression. A study of Plvap-deficient mice revealed that Plvap is critical for the development of EC and is specifically expressed in EC [44].
Different expression analysis showed that during PAH, the gene expression changed a lot in EC. The function enrichment showed that DEGs were related to PI3K-AKT signaling pathway. The PI3K-AKT signaling pathway plays an important role in regulating a variety of cellular functions, including autophagy, metabolism, growth, proliferation, survival, transcription, and protein synthesis [45]. In PAH, the PI3K-AKT signaling pathway is considered a potential therapeutic target [46, 47], which is consistent with our finding. Currently, studies have reported that abnormalities in the autophagy-related PI3K-AKT signaling pathway were observed in PAH [48].
The above work emphasizes the role of autophagy in PAH. In order to characterize the transcriptional dynamics of autophagy-related genes in PAH, we performed pseudo-time analysis because it can well present the dynamic changes along the developmental trajectory [24]. For one example, the data suggest that Ddit4 may be involved in regulating PAH, which is consistent with a previous report suggesting that Ddit4 may be a potential biomarker [49]. WGCNA is a widely used method for selecting key candidate genes in bulk RNA-seq [25], but it cannot be applied due to the sparsity of single-cell data. Fortunately, the emergence of hdWGCNA has made it possible [27]. We used hdWGCNA to construct a regulatory network of autophagy-related genes and found six candidate genes. Interestingly, we again obtained Ddit4 [49]. DDIT4 has been reported as an inhibitor of mTORC1, and reducing the activity of mTOR can induce autophagy [50, 51]. In our work, our model showed that DDIT4 expression increased, and the results of LC3B indicated an increase in autophagy levels. Based on the above, we speculate that this is related to the abnormal expression of DDIT4.
Although this study explored the heterogeneity of ECs in PAH in detail at the single-cell level, this study has certain limitations. All data are from mouse models, lacking exploration of human samples. Rodor et al have demonstrated the reliability of the SU5416/hypoxia-induced PAH model, manifested by a marked increase in right ventricular hypertrophy and vascular remodeling [15], which is consistent with the typical clinical symptoms of PAH. Moreover, HPAECs in vitro cell model is also used to verify the mechanism of PAH. Although it cannot model the pathological characteristics in vivo, it can also be reported as a damage model [28]. This study found that the expression of DDIT4 in HPAECs is consistent with that in vivo. However, the function of DDIT4 in PAH needs to be further clarified.
Conclusion
In summary, this study explored the molecular characteristics of ECs in PAH at the single-cell level and identified DDIT4 as a biomarker for autophagy-related PAH through comparative analysis of different bioinformatics analysis methods, which expands the understanding of the pathogenesis of PAH and may serve as a potential therapeutic target.
| Supplementary Material | ▴Top |
Suppl Fig. 1. (A) Display of individual cell types in different samples. The UMAP (B) and violin plots (C) showing the expression of marker genes in different cell types. (D) The UMAP plot showing the endothelial cells in merged data.
Suppl Table 1. The antibody information.
Acknowledgments
The authors thank Julie Rodor’s laboratory for sharing the sequencing data.
Financial Disclosure
This work was supported by the Guizhou Science and Technology Fundamentals (ZK[2024]-460).
Conflict of Interest
The authors declare that they have no competing interests.
Informed Consent
Not applicable.
Author Contributions
CZZ, QY, and JH wrote the main manuscript text. CZZ and WJL analyzed the data. All authors reviewed the manuscript.
Data Availability
The authors declare that the data supporting the findings of this study are available within the article and its supplementary materials.
Abbreviations
EC: endothelial cell; DEGs: differentially expressed genes; GEO: Gene Expression Omnibus; HPAECs: human pulmonary artery endothelial cells; KEGG: Kyoto Encyclopedia of Genes and Genomes; PAH: pulmonary arterial hypertension; PPI: protein-protein interaction; WGCNA: weighted gene co-expression network analysis
| References | ▴Top |
- Ruopp NF, Cockrill BA. Diagnosis and treatment of pulmonary arterial hypertension: a review. JAMA. 2022;327(14):1379-1391.
doi pubmed - Naeije R, Richter MJ, Rubin LJ. The physiological basis of pulmonary arterial hypertension. Eur Respir J. 2022;59(6):2102334.
doi pubmed - Wang RR, Yuan TY, Wang JM, Chen YC, Zhao JL, Li MT, Fang LH, et al. Immunity and inflammation in pulmonary arterial hypertension: From pathophysiology mechanisms to treatment perspective. Pharmacol Res. 2022;180:106238.
doi pubmed - Shah AJ, Vorla M, Kalra DK. Molecular pathways in pulmonary arterial hypertension. Int J Mol Sci. 2022;23(17):10001.
doi pubmed - Cober ND, VandenBroek MM, Ormiston ML, Stewart DJ. Evolving concepts in endothelial pathobiology of pulmonary arterial hypertension. Hypertension. 2022;79(8):1580-1590.
doi pubmed - Huertas A, Perros F, Tu L, Cohen-Kaminsky S, Montani D, Dorfmuller P, Guignabert C, et al. Immune dysregulation and endothelial dysfunction in pulmonary arterial hypertension: a complex interplay. Circulation. 2014;129(12):1332-1340.
doi pubmed - Ahearn GS, Tapson VF, Rebeiz A, Greenfield JC, Jr. Electrocardiography to define clinical status in primary pulmonary hypertension and pulmonary arterial hypertension secondary to collagen vascular disease. Chest. 2002;122(2):524-527.
doi pubmed - Le Vely B, Phan C, Berrebeh N, Thuillet R, Ottaviani M, Chelgham MK, Chaumais MC, et al. Loss of cAbl tyrosine kinase in pulmonary arterial hypertension causes dysfunction of vascular endothelial cells. Am J Respir Cell Mol Biol. 2022;67(2):215-226.
doi pubmed - Feng W, Wang J, Yan X, Zhang Q, Chai L, Wang Q, Shi W, et al. ERK/Drp1-dependent mitochondrial fission contributes to HMGB1-induced autophagy in pulmonary arterial hypertension. Cell Prolif. 2021;54(6):e13048.
doi pubmed - Xie Q, Liu Y, Li X. The interaction mechanism between autophagy and apoptosis in colon cancer. Transl Oncol. 2020;13(12):100871.
doi pubmed - Vargas JNS, Hamasaki M, Kawabata T, Youle RJ, Yoshimori T. The mechanisms and roles of selective autophagy in mammals. Nat Rev Mol Cell Biol. 2023;24(3):167-185.
doi pubmed - Jin Y, Choi AM. Cross talk between autophagy and apoptosis in pulmonary hypertension. Pulm Circ. 2012;2(4):407-414.
doi pubmed - Lee SJ, Smith A, Guo L, Alastalo TP, Li M, Sawada H, Liu X, et al. Autophagic protein LC3B confers resistance against hypoxia-induced pulmonary hypertension. Am J Respir Crit Care Med. 2011;183(5):649-658.
doi pubmed - Gou YY, Liu D, Li G, Hu YN, Jia P, Liu HM, Liu B. [Preventive and therapeutic effects of exogenous apelin regulating autophagy on the formation of pulmonary artery hhypertension in rats]. Sichuan Da Xue Xue Bao Yi Xue Ban. 2020;51(2):193-199.
doi pubmed - Rodor J, Chen SH, Scanlon JP, Monteiro JP, Caudrillier A, Sweta S, Stewart KR, et al. Single-cell RNA sequencing profiling of mouse endothelial cells in response to pulmonary arterial hypertension. Cardiovasc Res. 2022;118(11):2519-2534.
doi pubmed - Yang Z, Zhou L, Ge H, Shen W, Shan L. Identification of autophagy-related biomarkers in patients with pulmonary arterial hypertension based on bioinformatics analysis. Open Med (Wars). 2022;17(1):1148-1157.
doi pubmed - Satija R, Farrell JA, Gennert D, Schier AF, Regev A. Spatial reconstruction of single-cell gene expression data. Nat Biotechnol. 2015;33(5):495-502.
doi pubmed - Zhang FL, Feng YQ, Wang JY, Zhu KX, Wang L, Yan JM, Li XX, et al. Single cell epigenomic and transcriptomic analysis uncovers potential transcription factors regulating mitotic/meiotic switch. Cell Death Dis. 2023;14(2):134.
doi pubmed - Mason DY, Cordell JL, Brown MH, Borst J, Jones M, Pulford K, Jaffe E, et al. CD79a: a novel marker for B-cell neoplasms in routinely processed tissue samples. Blood. 1995;86(4):1453-1459.
pubmed - Zoppi N, Gardella R, De Paepe A, Barlati S, Colombi M. Human fibroblasts with mutations in COL5A1 and COL3A1 genes do not organize collagens and fibronectin in the extracellular matrix, down-regulate alpha2beta1 integrin, and recruit alphavbeta3 Instead of alpha5beta1 integrin. J Biol Chem. 2004;279(18):18157-18168.
doi pubmed - Yu G, Wang LG, Han Y, He QY. clusterProfiler: an R package for comparing biological themes among gene clusters. OMICS. 2012;16(5):284-287.
doi pubmed - http://metascape.org/gp/index.html#/main/step1.
- Kanehisa M, Araki M, Goto S, Hattori M, Hirakawa M, Itoh M, Katayama T, et al. KEGG for linking genomes to life and the environment. Nucleic Acids Res. 2008;36(Database issue):D480-D484.
doi pubmed - Cao J, Spielmann M, Qiu X, Huang X, Ibrahim DM, Hill AJ, Zhang F, et al. The single-cell transcriptional landscape of mammalian organogenesis. Nature. 2019;566(7745):496-502.
doi pubmed - Zhang FL, Li WD, Zhang G, Zhang M, Liu ZJ, Zhu KX, Liu QC, et al. Identification of unique transcriptomic signatures through integrated multispecies comparative analysis and WGCNA in bovine oocyte development. BMC Genomics. 2023;24(1):265.
doi pubmed - Liang W, Sun F, Zhao Y, Shan L, Lou H. Identification of susceptibility modules and genes for cardiovascular disease in diabetic patients using WGCNA analysis. J Diabetes Res. 2020;2020:4178639.
doi pubmed - Morabito S, Reese F, Rahimzadeh N, Miyoshi E, Swarup V. hdWGCNA identifies co-expression networks in high-dimensional transcriptomics data. Cell Rep Methods. 2023;3(6):100498.
doi pubmed - Chen A, Liu J, Zhu J, Wang X, Xu Z, Cui Z, Yao D, et al. FGF21 attenuates hypoxia-induced dysfunction and apoptosis in HPAECs through alleviating endoplasmic reticulum stress. Int J Mol Med. 2018;42(3):1684-1694.
doi pubmed - Yao D, He Q, Sun J, Cai L, Wei J, Cai G, Liu J, et al. FGF21 attenuates hypoxia-induced dysfunction and inflammation in HPAECs via the microRNA-27b-mediated PPARgamma pathway. Int J Mol Med. 2021;47(6):1-12.
doi pubmed - Yu S, Zhao Y, Zhang FL, Li YQ, Shen W, Sun ZY. Chestnut polysaccharides benefit spermatogenesis through improvement in the expression of important genes. Aging (Albany NY). 2020;12(12):11431-11445.
doi pubmed - Debnath J, Gammoh N, Ryan KM. Autophagy and autophagy-related pathways in cancer. Nat Rev Mol Cell Biol. 2023;24(8):560-575.
doi pubmed - Zhai C, Zhang N, Wang J, Cao M, Luan J, Liu H, Zhang Q, et al. Activation of autophagy induces monocrotaline-induced pulmonary arterial hypertension by FOXM1-mediated FAK phosphorylation. Lung. 2022;200(5):619-631.
doi pubmed - Chen R, Jiang M, Li B, Zhong W, Wang Z, Yuan W, Yan J. The role of autophagy in pulmonary hypertension: a double-edge sword. Apoptosis. 2018;23(9-10):459-469.
doi pubmed - Li L, Wang X, Wang L, Qu L, Zhu X, Li M, Dang X, et al. Mammalian target of rapamycin overexpression antagonizes chronic hypoxia-triggered pulmonary arterial hypertension via the autophagic pathway. Int J Mol Med. 2015;36(1):316-322.
doi pubmed - Lahm T, Frump AL, Albrecht ME, Fisher AJ, Cook TG, Jones TJ, Yakubov B, et al. 17beta-Estradiol mediates superior adaptation of right ventricular function to acute strenuous exercise in female rats with severe pulmonary hypertension. Am J Physiol Lung Cell Mol Physiol. 2016;311(2):L375-388.
doi pubmed - Gomez-Arroyo JG, Farkas L, Alhussaini AA, Farkas D, Kraskauskas D, Voelkel NF, Bogaard HJ. The monocrotaline model of pulmonary hypertension in perspective. Am J Physiol Lung Cell Mol Physiol. 2012;302(4):L363-369.
doi pubmed - Terman BI, Dougher-Vermazen M, Carrion ME, Dimitrov D, Armellino DC, Gospodarowicz D, Bohlen P. Identification of the KDR tyrosine kinase as a receptor for vascular endothelial cell growth factor. Biochem Biophys Res Commun. 1992;187(3):1579-1586.
doi pubmed - Privratsky JR, Newman PJ. PECAM-1: regulator of endothelial junctional integrity. Cell Tissue Res. 2014;355(3):607-619.
doi pubmed - Kumar V, Donthireddy L, Marvel D, Condamine T, Wang F, Lavilla-Alonso S, Hashimoto A, et al. Cancer-associated fibroblasts neutralize the anti-tumor effect of CSF1 receptor blockade by inducing PMN-MDSC infiltration of tumors. Cancer Cell. 2017;32(5):654-668.e655.
doi pubmed - Starlets D, Gore Y, Binsky I, Haran M, Harpaz N, Shvidel L, Becker-Herman S, et al. Cell-surface CD74 initiates a signaling cascade leading to cell proliferation and survival. Blood. 2006;107(12):4807-4816.
doi pubmed - Tu L, Le Hiress M, Ricard N, Phan C, Seferian A, Girerd B, Fadel E, et al. MIF/CD74 contributes to the endothelial pro-inflammatory phenotype in pulmonary arterial hypertension. Eur Respiratory Soc. 2013.
- Le Hiress M, Tu L, Ricard N, Phan C, Thuillet R, Fadel E, Dorfmuller P, et al. Proinflammatory signature of the dysfunctional endothelium in pulmonary hypertension. Role of the macrophage migration inhibitory Factor/CD74 complex. Am J Respir Crit Care Med. 2015;192(8):983-997.
doi pubmed - Masaki T, Okazawa M, Asano R, Inagaki T, Ishibashi T, Yamagishi A, Umeki-Mizushima S, et al. Aryl hydrocarbon receptor is essential for the pathogenesis of pulmonary arterial hypertension. Proc Natl Acad Sci U S A. 2021;118(11):e2023899118.
doi pubmed - Herrnberger L, Seitz R, Kuespert S, Bosl MR, Fuchshofer R, Tamm ER. Lack of endothelial diaphragms in fenestrae and caveolae of mutant Plvap-deficient mice. Histochem Cell Biol. 2012;138(5):709-724.
doi pubmed - Mayer IA, Arteaga CL. The PI3K/AKT pathway as a target for cancer treatment. Annu Rev Med. 2016;67:11-28.
doi pubmed - Lv X, Li J, Wei R, Meng L, Kong X, Wei K, Tang M, et al. Ethyl pyruvate alleviates pulmonary arterial hypertension via PI3K-Akt signaling. Mol Cell Biochem. 2025;480(2):1045-1054.
doi pubmed - Li N, Su S, Xie X, Yang Z, Li Z, Lu D. Tsantan Sumtang, a traditional Tibetan medicine, protects pulmonary vascular endothelial function of hypoxia-induced pulmonary hypertension rats through AKT/eNOS signaling pathway. J Ethnopharmacol. 2024;320:117436.
doi pubmed - Zhou R, Li R, Ding Q, Zhang Y, Yang H, Han Y, Liu C, et al. OPN silencing reduces hypoxic pulmonary hypertension via PI3K-AKT-induced protective autophagy. Sci Rep. 2024;14(1):8670.
doi pubmed - Wang H, Zhang H, Yang P, Lu C, Liu Y, Zhang Y, Xie Y, et al. Identification of the key ferroptosis-related genes in the pathogenesis of thoracic aortic dissection and thoracic aortic aneurysm using integrated bioinformatic analysis and experimental verification. 2022.
- Zhang F, Liu G, Li D, Wei C, Hao J. DDIT4 and Associated lncDDIT4 Modulate Th17 Differentiation through the DDIT4/TSC/mTOR Pathway. J Immunol. 2018;200(5):1618-1626.
doi pubmed - Jung CH, Ro SH, Cao J, Otto NM, Kim DH. mTOR regulation of autophagy. FEBS Lett. 2010;584(7):1287-1295.
doi pubmed
This article is distributed under the terms of the Creative Commons Attribution Non-Commercial 4.0 International License, which permits unrestricted non-commercial use, distribution, and reproduction in any medium, provided the original work is properly cited.
Cardiology Research is published by Elmer Press Inc.